


Abstract
Post-translational modification (PTM)-based regulation can be mediated not only by the modification of a single residue but also by the interplay of different modifications. Accurate prediction of PTM cross-talk is a highly challenging issue and is in its infant stage. Especially, less attention has been paid to the structural preferences (except intrinsic disorder and spatial proximity) of cross-talk pairs and the characteristics of individual residues involved in cross-talk, which may restrict the improvement of the prediction accuracy. Here we report a structure-based algorithm called PCTpred to improve the PTM cross-talk prediction. The comprehensive residue- and residue pair-based features were designed for paired PTM sites at the sequence and structural levels. Through feature selection, we reserved 23 newly introduced descriptors and 3 traditional descriptors to develop a sequence-based predictor PCTseq and a structure-based predictor PCTstr, both of which were integrated to construct our final prediction model. According to pair- and protein-based evaluations, PCTpred yielded area under the curve values of approximately 0.9 and 0.8, respectively. Even when removing the distance preference of samples or using the input of modeled structures, our prediction performance was maintained or moderately reduced. PCTpred displayed stable and reliable improvements over the state-of-the-art methods based on various evaluations. The source code and data set are freely available at https://github.com/Liulab-HZAU/PCTpred or http://liulab.hzau.edu.cn/PCTpred/.
Introduction
Post-translational modifications (PTMs) play a key regulatory role in biological processes, including gene expression, enzymatic activity and protein–protein interactions [1–3]. More than 300 types of PTMs have been identified in eukaryotic proteins. PTM-based regulation can be mediated not only by an individual modification but also by a combination of interdependent modifications [4]. The interplay between different PTMs within the same protein or from different interacting proteins to determine a functional outcome is called PTM cross-talk [5, 6]. Existing studies show that PTM cross-talk events commonly occur in transcription factors and histones [7, 8]. For instance, O-GlcNAcylation of Ser149 in transcription factor p53 is related to decreased phosphorylation of Thr155, and these two modifications coordinately mediate the stability and activity of p53 [9]. In histone H3, the interaction between the phosphorylation of Ser10 and acetylation of Lys14 plays an indispensable role in transcriptional regulation in mammalian cells [10]. The development of specialized mass spectrometry (MS) techniques has significantly improved the identification of cross-talk among PTM sites [11, 12]. Nevertheless, the inherent shortcomings of these experimental methods are inevitable. For instance, although top-down and middle-down MS approaches have been utilized to detect the co-occurrence of PTM sites in short peptides, this strategy is restricted to the cross-talk among histone modifications [13–15]. Accordingly, the large-scale experimental identification of PTM cross-talk is a challenging issue in proteomics, and computational algorithms are required to guide or assist experimental techniques.
Over the past decade, a series of computational studies have investigated the characteristics of cross-talk pairs and inferred potential PTM cross-talk events. Beltrao et al. [8, 16] showed that the functional importance of PTMs was correlated with their conservation that can be adopted to identify putative regulatory regions within protein families by computing the enrichment of PTMs over random expectation. Woodsmith et al. [17] found that sequence fragments with dense PTMs showed strong preferences toward disordered regions through a local sequence scanning analysis. Pejaver et al. [18] proposed that intrinsic disorder was a critical structural signature of PTM cross-talk by systematically dissecting experimental and predicted PTM sites. Schweiger et al. [19] suggested that cooperative phosphorylation sites tended to form clusters within protein sequences based on the statistical assessment of large-scale proteomic data. Korkuć et al. [20, 21] displayed that phosphorylation sites were more proximate in 3D space than would be expected by chance at the structural level. Peng et al. [22] created an automatic pipeline that recognized 18 PTM cross-talk motifs using motif discovery and conservation assessment techniques. Minguez et al. [23–25] developed a framework to discover the functional associations between PTMs based on the co-evolutionary signals and built a database termed PTMcode by incorporating other evidence (e.g. sequence and structural proximity and manual annotations in the literature). Due to the scarcity of gold standard PTM cross-talk data sets, the above methods were lacking in stringent assessments. Recently, based on 193 manually curated PTM cross-talk pairs from the literature, Huang et al. [26] invented a naïve Bayes classifier called PTM-X by integrating sequence and structural distances, residue and modification co-evolution and co-localization in disordered regions. The existing resources for PTM cross-talk prediction are shown in Supplementary Table S1. The above works advance our understanding of the interplay of PTMs and provide novel insights into the prediction of cross-talk events.
Although significant progress has been made, there are at least two limitations of current methods that hamper the accurate prediction of PTM cross-talk. First, previous studies mainly focused on the cross-talk pairs at the sequence level. Nevertheless, the function of a protein is determined by its tertiary structure. Aside from intrinsic disorder and spatial proximity [21, 27], other structural preferences of cross-talk pairs are largely unknown and have yet to be applied to the recognition of PTM cross-talk. Second, most existing research intuitively used coupling features between PTM sites, such as co-evolution and co-localization [24, 26], to characterize and recognize cross-talk pairs but neglected the properties of individual residues involved in cross-talk. The residue pair-based features whose utilities are largely dependent on the distance between PTMs might be less useful for remote cross-talk sites or close unrelated sites, whereas the residue-based features would provide additional information. Therefore, developing novel algorithms is critical to overcome the current limitations.
With these problems in mind, we proposed a structure-based algorithm termed PCTpred (PTM Cross-Talk predictor) to improve the prediction accuracy of PTM cross-talk events. We designed a group of novel residue- and residue pair-based features that effectively showed the preferences of cross-talk pairs from sequence and structural perspectives. Then we constructed two component predictors using random forest (RF) algorithm with finely selected sequence- and structure-based features. Combining these two predictors, PCTpred took full advantage of the complementarity between residue- and residue pair-based features and the synergy between sequence and structural information. Using both pair- and protein-based evaluations, PCTpred yielded consistently better results than the state-of-the-art method PTM-X, even in stringent cases that eliminated the bias induced by the distance between PTMs.
Materials and methods
Data sets
We followed the steps proposed by Huang et al. [26] to collect the experimentally verified PTM cross-talk pairs. The keyword combination ‘((cross AND (talk OR regulate OR link)) OR interplay) AND post translational modification’ was adopted to search the PubMed database. We retrieved 22 cross-talk pairs within proteins by reading 411 associated articles from January 2014 to September 2017 (Supplementary Table S2). In addition, the 193 cross-talk pairs before 2014 collected by Huang et al. [26] were also used in this work. By removing overlapped samples, we obtained 205 cross-talk pairs from 81 human proteins. Using a sequence identity threshold of 30%, these human proteins were divided into 74 clusters, suggesting that the sequence redundancy is lower. The statistical analysis of the PTM type and residue composition of these samples is shown in Supplementary Figure S1. To generate negative samples, we downloaded all the PTM sites of Homo sapiens determined by low-throughput experiments from the PhosphoSitePlus database [28]. We generated the pairwise combinations of PTM sites in each protein and deleted pairs whose component sites simultaneously appeared in the positive set. The resulting 12 468 PTM pairs were used as negative samples. The positive and negative samples were combined to constitute the Seq-set data set. We found that 73 human proteins had corresponding structures by SIFTS mapping [29]. The structures without any cross-talk or negative sample were eliminated. If a PTM pair appeared in more than one structure, the longest one determined by X-ray diffraction (resolution from 1.6 Å to 3.7 Å) or NMR spectroscopy (the first model in the PDB file) was used as a representative. At the structural level, we obtained 61 cross-talk and 2161 negative pairs, and this data set was termed Str-set.
Considering that some features might be dependent on the distance between residues, we established three stringent data sets, including Seq-control, Str-control and SeqStr-control, to evaluate the robustness of our method. To generate the Seq-control data set, we computed the sequence distance of each PTM pair by counting the number of residues between two PTM sites. According to the sequence distance, the samples from Seq-set were divided into different bins with a step of five residues. We used the cross-talk pairs in each bin and randomly chose the same number of negative pairs to ensure a similar distribution of positive and negative samples. We calculated the structural distance of each PTM pair that is defined as the distance between the alpha carbons of two PTM sites and divided the samples from Str-set into bins with a step of 5 Å to construct the Str-control data set. Regarding the SeqStr-control data set, we partitioned the samples from Str-set into bins by restricting both sequence and structural distances.
Overview of our prediction model
As shown in Figure 1, PCTpred is composed of a sequence-based module PCTseq and a structure-based module PCTstr. The comprehensive sequence and structural descriptors are extracted to characterize each PTM pair in the query protein. The optimal feature combinations are determined using feature selection techniques. PCTseq and PCTstr are then implemented with RF algorithm. If the structural information is available, PCTseq and PCTstr are combined to recognize cross-talk pairs; otherwise, only PCTseq is used. Note that the features used in our model can be further divided into residue pair- and residue-based features. Most residue pair-based features show a bias toward the distance between PTM sites. For instance, adjacent residues tend to possess a strong co-evolutionary signature and be located in the same functional regions. This may reduce their power to identify distant cross-talk sites and exclude the illusive pairs within a short distance. In these cases, residue-based features that are not heavily dependent on the proximity complement the limitations of residue pair-based features, resulting in improved prediction accuracy.
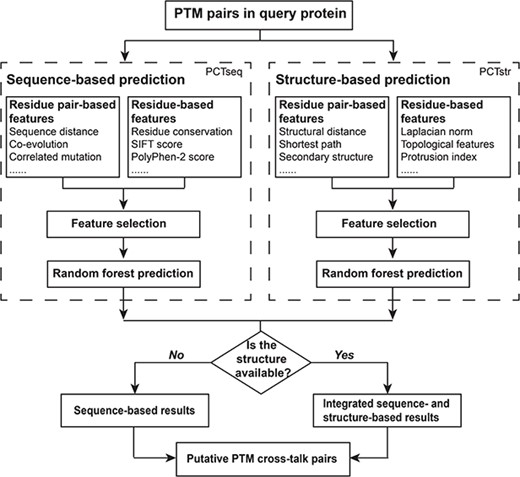
Flowchart of PCTpred. Our algorithm comprises two modules, namely PCTseq and PCTstr, which are further combined to build PCTpred.
Feature representation
To quantitatively depict PTM pairs, we extracted four groups of features, including residue pair-based sequence features, residue-based sequence features, residue pair-based structural features and residue-based structural features. The majority of these descriptors were newly applied to PTM cross-talk prediction except the traditional features, such as sequence distance, structural distance and co-localization within disordered regions. For residue-based features, the minimum, maximum and average values of two individual sites were used to characterize each PTM pair based on a specific property. A detailed list of the features is shown in Supplementary Table S3.
Residue pair-based sequence features
Residue co-evolution
Correlated mutation
Co-localization within disordered regions and protein domains
Disordered regions were predicted for each protein using DisEMBL [34], and protein domains were annotated using HMMER searches against the Pfam database [35, 36]. We checked whether the paired PTM sites were located in the same disordered regions and protein domains. If the co-localization was observed, the attribute value was set to 1; otherwise, the value was 0.
Residue-based sequence features
Deleterious score
To assess the effects of missense mutations, SIFT and PolyPhen-2 were used to predict the deleterious score of each PTM site [37, 38]. A lower SIFT score or a higher PolyPhen-2 score indicates that the mutation has a higher probability of affecting protein function. The average deleterious score of 19 possible amino acid substitutions was computed as the final score.
Residue conservation
Residue pair-based structural features
Shortest path distance
In addition to the structural distance used by Huang et al. [26], we computed the shortest path length between PTM sites in a residue interaction network where residues were regarded as nodes and the contacts between residues were regarded as edges. A physical contact was generated if two residues contained at least one pair of heavy atoms within a distance less than 5 Å. The shortest path distance is defined as the smallest number of links between residues.
Pairwise secondary structure state
The secondary structure state of a residue was assigned using DSSP [40]. The residues in H (α-helix), G (3/10-helix) and I (π-helix) were considered to be in helical conformation, and those in E (β-strand) and B (β-bridge) were in sheet conformation. The remaining residues were in coil conformation. Combinations of these three states, denoted by a six-dimensional binary vector, were used to describe each PTM pair.
Co-localization within pockets
Pockets in each query structure were detected by Fpocket2 [41]. If the paired PTM sites were located in the same pockets, the attribute value was 1; otherwise, the value was 0.
Residue-based structural features
Laplacian norm
Topological features
Based on each residue interaction network, one PTM site was further characterized by four topological descriptors, in which closeness and betweenness are used to estimate its global importance in the residue network, the degree reflects its local connectivity and the clustering coefficient measures the compactness of its adjacent residues. The original measures should be converted into z-scores.
Depth and protrusion indices
Depth and protrusion indices are geometric descriptors that reflect the local concavity and convexity of a protein surface. PSAIA was used to calculate the average atomic index of each PTM site [45].
Number of hydrogen bonds
Hydrogen bonds might play an important role in maintaining the conformation of PTM sites serving as donors or acceptors. The number of hydrogen bonds was computed using HBPLUS [46].
B-factor
The B-factor is an indicator of atomic thermal motion and disorder [47]. We adopted the B-factor of alpha carbon to represent the flexibility of each residue, followed by the z-score transformation. Note that only crystal structures have the experimentally measured B-factors. The normalized B-factors of all the residues in crystal structures ranged from −4 to 4, and the mean was very close to zero that was assigned to each sample in the NMR structures to avoid possible biases.
Feature selection
Sequential forward selection (SFS) is a greedy algorithm used to generate the optimal combination of sequence- or structure-based features [48, 49]. The SFS started with the feature showing the highest discriminatory capability between cross-talk and negative pairs based on the area under the curve (AUC). To calculate the AUC measure, we generated the receiver operating characteristic (ROC) curve by plotting the true positive rate against the false positive rate at different prediction thresholds. The area under the ROC curve can be estimated using trapezoidal approximation. We iteratively selected a new feature from the remaining ones so that the combination of this feature and the reserved ones can obtain the best performance. This process was halted when the AUC value failed to increase. Feature selection was conducted on Seq-set and Str-set. To remove the imbalance between positive and negative samples, we used all the cross-talk pairs and randomly sampled an equal number of negative pairs from each data set. This sampling procedure was repeated 100 times. For each iteration, we used the SFS to generate a feature subset. The features that were selected at least 30 times constituted the optimal feature subset.
Model construction and performance evaluation
To take full advantage of the selected sequence and structural features, we created a sequence-based predictor PCTseq and a structure-based predictor PCTstr, both of which were RF-based models implemented using the scikit-learn package with 500 trees [50, 51]. The average value of the probability scores generated by these two predictors was adopted to disentangle cross-talk from negative pairs when the protein structure was provided. Otherwise, the probability score of PCTseq was used individually. We conducted 10-fold cross-validation (CV) on the five data sets used in this work. For each data set, the balanced positive and negative pairs were adopted. The samples were randomly partitioned into 10 subgroups, 9 of which were used for training and the remaining subgroup was used for testing. The 10-fold CV was repeated 100 times by resampling negative pairs and the average performance was reported. In addition to the above pair-based validation, we used protein-based validation, cross-talk subset assessment and independent testing to evaluate the robustness of our algorithm, in which the feature combination determined by the 10-fold CV on Seq-set and Str-set was consistently used. In this work, the Matthews correlation coefficient (MCC) and AUC were used as the primary measures. We also computed other metrics including recall, precision, F1-score and accuracy.
Results and discussion
Statistical analysis of residue pair-based features
We systemically compared the cross-talk and negative samples based on the residue pair-based properties. Compared to negative pairs, cross-talk pairs generally had smaller sequence distances (median: 6 versus 154 amino acids, P = 2.2e-59), structural distances (median: 10.8 Å versus 29.7 Å, P = 1.2e-16) and shortest path distances (median: 2 versus 5 steps, P = 1.3e-16). The co-localization analysis indicated that 69.3 and 16.9%, 34.6 and 20.6% and 19.7 and 0.04% of positive and negative samples were observed within the same disordered regions (P = 1.2e-84), protein domains (P = 4.8e-07) and protein pockets (P = 3.4e-09), respectively, showing that cross-talk sites were prone to being simultaneously located in functional regions. In Figure 2A, in agreement with their higher occurrences in disordered regions, cross-talk pairs achieved a greater fraction of coil–coil (CC) conformation, whereas negative pairs had higher fractions of coil–helix (CH) and coil–sheet (CE) conformations. This result suggested that the pairwise secondary structure state could be used as an indicator of cross-talk events.
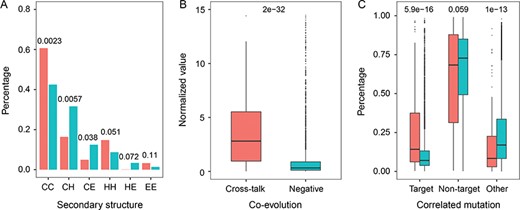
Comparison of the distributions of residue pair-based features between cross-talk (red) and negative (cyan) pairs. (A) Pairwise secondary structure state, (B) residue co-evolution and (C) correlated mutation. P-values are provided in each figure.
In this work, the DCA algorithm was used to measure the co-evolution of residues [30]. In Figure 2B, cross-talk pairs displayed higher co-evolutionary strength than negative pairs. Supplementary Figure S2A–C shows that the distribution discrepancy of the DCA-based score (P = 2e-32) was more significant than those of the conventional MI-based score (P = 1.9e-12) and normalized MI score (P = 1.7e-24). Supplementary Figure S2D displays that the direct information was more useful for identifying co-regulatory PTM pairs than the other two co-evolutionary features. Additionally, we used correlated mutation to reflect the covariation pattern between paired PTM sites. Figure 2C displays that both target residues involved in cross-talk tended to simultaneously appear in the homologous sequences, whereas those in negative pairs were easily mutated. A higher co-occurrence frequency of paired sites suggested their stronger functional association.
Statistical analysis of residue-based features
We also compared the two categories of samples at the single residue level. Regarding the sequence features, Figure 3A shows that cross-talk sites possessed significantly lower residue conservation scores based on the Shannon entropy, suggesting that these residues were more evolutionarily conserved than negative samples. In Figure 3B and C, additionally, cross-talk residues had lower SIFT scores and higher PolyPhen-2 scores, implying a higher probability of inducing deleterious mutations. At the structural level, Figure 3D shows that the LNs of positive samples were consistently lower than those of negative samples from local to global scales, indicating that cross-talk residues prefer relatively concave locations in protein structures. In Figure 3E, cross-talk sites achieved higher degree and betweenness measures but lower clustering coefficients than negative ones. This result indicated that the residues in cross-talk appeared in the center of residue networks, whereas there were sparse contacts between their neighboring residues. These locations generally correspond to the protein pocket, cleft and cavity regions. The distributions of two local geometric features in Figure 3F and G illustrate that cross-talk sites had lower depth values and higher protrusion values, suggesting that these residues were in the convex surface of proteins. Figure 3H indicates that positive samples had more difficulty forming hydrogen bonds with other residues than negative samples. In Figure 3I, the positive sites tended to possess higher B-factors, implying that these residues had a higher degree of flexibility in protein structures. Overall, the residue-based features can reflect the differences between cross-talk and negative sites.
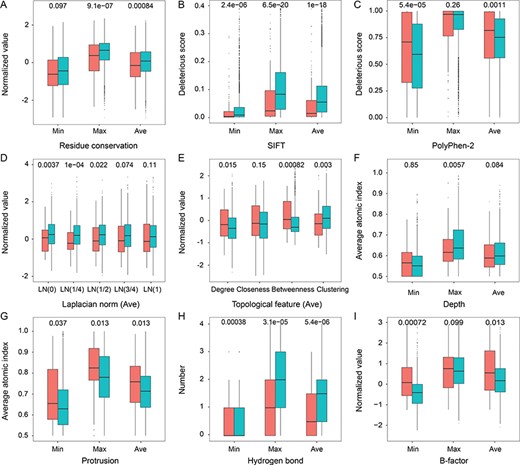
Comparison of the distributions of residue-based features between cross-talk (red) and negative (cyan) pairs. (A) Residue conservation, (B) SIFT score, (C) PolyPhen-2 score, (D) average of LN, (E) average of topological features, (F) depth index, (G) protrusion index, (H) number of hydrogen bonds and (I) B-factor. Min, Max and Ave represent the minimum, maximum and average values of two residues in each PTM pair regarding a given attribute. P-values are provided in each figure. The complete distributions of LN and topological features are shown in Supplementary Figure S3. Regarding the analysis of B-factor, we only used the samples from crystal structures.
Performance assessment of single features
We created a group of RF-based predictors using individual features and evaluated their performance with 10-fold CV. Based on Seq-set, Figure 4A shows that the top three sequence features were correlated mutation, sequence distance and co-localization in disordered regions with AUCs of 0.766, 0.760 and 0.724, respectively. The AUCs of the remaining sequence features were from 0.536 to 0.707. In Figure 4B, the structural distance, shortest path distance and B-factor obtained higher AUCs of 0.775, 0.770 and 0.713, respectively. The AUCs of the other structural features ranged from 0.535 to 0.682 for Str-set. Apart from the co-localization in domains, co-localization in pockets and pairwise secondary structure state, the residue pair-based features largely outperformed the residue-based features. Conversely, when we used Seq-control and Str-control in which the positive and negative samples possessed a similar distance distribution, the residue-based features achieved remarkably better results than the residue pair-based features with the exception of correlated mutation. Especially, the AUCs of residue pair-based features (including the conventional ones) were dramatically reduced to approximately 0.5, suggesting that these features almost lost their distinguishing capability. In contrast, the residue-based features suffered less from this influence and maintained predictive power. Thus, the residue-based features might complement the limitations of residue pair-based features in more difficult cases.
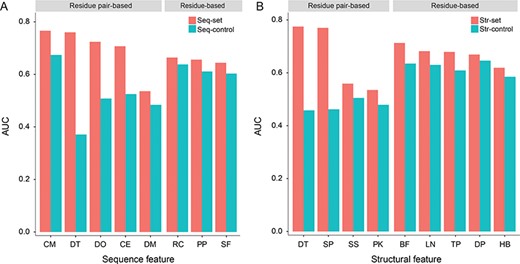
Performance assessment of single features. (A) Performance of single sequence features on Seq-set and Seq-control. CM, correlated mutation; DT, sequence distance; DO, co-localization within the same disordered region; CE, residue co-evolution; DM, co-localization within the same domain; RC, residue conservation; PP, PolyPhen-2 score; and SF, SIFT score. (B) Performance of single structural features on Str-set and Str-control. DT, structural distance; SP, shortest path distance; SS, pairwise secondary structure state; PK, co-localization within the same pocket; BF, B-factor; LN, Laplacian norm; TP, topological features; DP, depth and protrusion indices; and HB, number of hydrogen bonds. The disorder feature is divided into the sequence group, because this feature is derived from protein sequence, and all our structural features are calculated based on atomic coordinates.
Performance assessment of residue pair- and residue-based features
We further examined whether combining the individual features could help improve the prediction performance. Table 1 shows that the integration of all residue pair- or residue-based features yielded largely better performance for Seq-set and Str-set than single features in the corresponding category (Figure 4). The performance was further improved when we combined residue pair- and residue-based features, and similar trends were observed for the three control data sets at the sequence level. As expected, all the feature combinations in Table 1 attained poorer results after the distance preference was eliminated. In terms of AUCs, residue pair-based features (Fseq: 0.883 to 0.662 and Fstr: 0.767 to 0.450) showed more remarkable fluctuations than residue-based features (Fseq: 0.774 to 0.694 and Fstr: 0.806 to 0.693), suggesting that the former more heavily depended on the proximity of PTMs. Additionally, we found that the performance of sequence features for Str-set was superior to that for Seq-set. The major reason may be that the cross-talk pairs in Str-set had shorter sequence distances than those in Seq-set (Mean: 13.30 versus 56.06 amino acids) and were thus recognized easily. Because of the close correlation between the sequence and structural distances (Pearson correlation coefficient = 0.86), we found an obvious decrease in the sequence-based results for Str-control as well as for Seq-control. Collectively, the synergetic effect of the proposed features facilitated the prediction of PTM cross-talk.
Performance of residue pair- and residue-based features
| Feature set | Str-set | Seq-set | Str-control | Seq-control | SeqStr-control | |||||
|---|---|---|---|---|---|---|---|---|---|---|
| MCC | AUC | MCC | AUC | MCC | AUC | MCC | AUC | MCC | AUC | |
| Fseq (residue pair) | 0.667 | 0.883 | 0.588 | 0.862 | 0.439 | 0.753 | 0.315 | 0.702 | 0.275 | 0.662 |
| Fseq (residue) | 0.466 | 0.774 | 0.355 | 0.733 | 0.401 | 0.733 | 0.299 | 0.694 | 0.341 | 0.710 |
| Fseq (all) | 0.684 | 0.889 | 0.616 | 0.877 | 0.501 | 0.783 | 0.381 | 0.747 | 0.382 | 0.732 |
| Fstr (residue pair) | 0.462 | 0.767 | NA | NA | 0.071 | 0.497 | NA | NA | 0.003 | 0.450 |
| Fstr (residue) | 0.497 | 0.806 | NA | NA | 0.385 | 0.738 | NA | NA | 0.313 | 0.693 |
| Fstr (all) | 0.590 | 0.856 | NA | NA | 0.378 | 0.734 | NA | NA | 0.300 | 0.688 |
Feature selection and performance assessment of our final model
To avoid overtraining and remove redundant descriptors, we adopted the SFS algorithm to produce the optimal subsets from sequence and structural features based on Seq-set and Str-set, respectively. Supplementary Table S4 shows that both subsets obtained the best performance when the number of occurrences of the selected features across 100 repetitions was not less than 30. We obtained six residue pair- and five residue-based sequence features, and seven residue pair- and eight residue-based structural features (Supplementary Table S5). Apart from the sequence distance, structural distance and co-localization in disordered regions, 23 out of 26 reserved descriptors were newly introduced here. As shown in Table 2 and Supplementary Table S6, the AUCs of 0.892 and 0.879 generated by PCTseq and PCTstr for Str-set were higher than the AUCs of 0.889 and 0.856 generated by Fseq-all and Fstr-all in Table 1, showing the usefulness of our feature selection procedure. The improved performance was probably due to the fact that the reserved descriptors appearing at least 30 times in the feature selection process were more stable determinants compared to the removed descriptors and better reflected the specificity of cross-talk pairs, especially from the structural perspective. We further integrated these two predictors to build PCTpred that yielded an improved AUC of 0.903. When the structural information was unavailable, PCTseq got an AUC of 0.886 for Seq-set. The complementarity between the residue pair- and residue-based features in PCTseq and PCTstr is shown in Supplementary Table S7. The in-depth analysis shown in Supplementary Figure S4 indicates that general residue pair-based features had difficulty recognizing distant cross-talk pairs (e.g. sequence distance ≥43 or structural distance ≥15 Å) and adjacent negative pairs (e.g. sequence distance <52 or structural distance <18 Å), in which case the addition of correlated mutation and residue-based features effectively alleviated these limitations. Regarding the stringent data sets, PCTseq and PCTstr consistently outperformed the predictors based on all features and complemented each other (Table 2 and Supplementary Table S8). Especially, PCTpred yielded an AUC of 0.821 for Str-control, indicating that our structure-based algorithm maintained its utility after discarding the distance bias.
Performance of PCTpred and PTM-X on the five data sets prepared in this work
| Methoda | Str-set | Seq-set | Str-control | Seq-control | SeqStr-control | |||||
|---|---|---|---|---|---|---|---|---|---|---|
| MCC | AUC | MCC | AUC | MCC | AUC | MCC | AUC | MCC | AUC | |
| PCTseq | 0.698 | 0.892 | 0.635 | 0.886 | 0.493 | 0.788 | 0.420 | 0.765 | 0.377 | 0.735 |
| PCTstr | 0.653 | 0.879 | NA | NA | 0.433 | 0.775 | NA | NA | 0.341 | 0.727 |
| PCTstrm | 0.658 | 0.880 | NA | NA | 0.401 | 0.741 | NA | NA | 0.321 | 0.696 |
| PCTpred | 0.717 | 0.903 | NA | NA | 0.534 | 0.821 | NA | NA | 0.444 | 0.773 |
| PCTpredm | 0.705 | 0.903 | NA | NA | 0.498 | 0.791 | NA | NA | 0.408 | 0.745 |
| PTM-Xseq | 0.610 | 0.852 | 0.518 | 0.812 | 0.403 | 0.726 | 0.202 | 0.594 | 0.249 | 0.579 |
| PTM-Xstr | 0.427 | 0.753 | NA | NA | 0.000 | 0.421 | NA | NA | 0.000 | 0.408 |
| PTM-X | 0.627 | 0.853 | 0.529 | 0.813 | 0.390 | 0.716 | 0.178 | 0.588 | 0.202 | 0.557 |
aPCTstrm and PCTpredm denote that the modeled structures were used.
If PCTpred was only suitable for experimentally solved protein structures, the application scope of our algorithm would be severely restricted. Therefore, we used the predicted structures to evaluate PCTpred. To this end, we generated the I-TASSER structural model for each protein in Str-set [52]. All templates having a sequence identity more than 30% with the target were excluded to avoid close homologs. Based on the predicted structures, PCTstr and PCTpred showed competitive performance compared to the results obtained for the native structures. Regarding Str-control and SeqStr-control, the results of PCTstr and PCTpred were moderately worse. Furthermore, our structural model-based hybrid predictor yielded more reliable results than the pure sequence-based predictor and thus will have broad applications.
Protein-based assessment of our algorithm
To further validate PCTpred, we conducted protein-based evaluation in addition to the pair-based evaluation described above. Due to the limited data, we performed 5-fold and 10-fold CVs on the proteins with and without structural information, respectively. Supplementary Table S9 shows the proteins having more than five cross-talk pairs. Because p53 and H3 included remarkably more positive samples, each of these proteins constituted a subset, and the other proteins were randomly divided into the remaining subsets. To reduce the potential bias, the CV was repeated 100 times and the average performance was reported. Notably, all the cross-talk and negative pairs of each protein in the test set were used for evaluation, although we still used the balanced cross-talk and negative samples for training models. As shown in Table 3 and Supplementary Table S10, we obtained the relatively poorer protein-based results compared to the pair-based results. Based on the native structures, PCTseq and PCTstr yielded AUCs of 0.780 and 0.763, respectively, whereas PCTpred generated an improved AUC of 0.804. Furthermore, PCTstr and PCTpred obtained AUCs of 0.746 and 0.789 for the I-TASSER structural models, and PCTseq yielded an AUC of 0.787 for the proteins without structural information. These results reflected the usefulness and robustness of our method for PTM cross-talk prediction.
Protein-based evaluation of PCTpred and PTM-X
| Methoda | Seq-protein | Str-protein | ||
|---|---|---|---|---|
| MCC | AUC | MCC | AUC | |
| PCTseq | 0.248 | 0.787 | 0.337 | 0.780 |
| PCTstr | NA | NA | 0.222 | 0.763 |
| PCTstrm | NA | NA | 0.242 | 0.746 |
| PCTpred | NA | NA | 0.338 | 0.804 |
| PCTpredm | NA | NA | 0.326 | 0.789 |
| PTM-Xseq | 0.194 | 0.758 | 0.207 | 0.728 |
| PTM-Xstr | NA | NA | 0.220 | 0.720 |
| PTM-X | 0.192 | 0.760 | 0.212 | 0.742 |
aPCTstrm and PCTpredm denote that the modeled structures were used.
Comparison with other algorithms
To our best knowledge, only the PTM-X algorithm, a naïve Bayes classifier combining sequence and structural distances, residue and modification co-evolution and co-localization in disordered regions, was established on manually curated data for predicting PTM cross-talk [26], so we conducted a head-to-head comparison of PCTpred and PTM-X. As shown in Table 2, PCTpred yielded improvements over PTM-X for different data sets in terms of the pair-based evaluation. The AUC and MCC of PCTpred for Str-set were 0.903 and 0.717 compared with 0.853 and 0.627 achieved by PTM-X, with the increase of 5.9 and 14.4%, respectively. Our individual PCTseq and PCTstr modules also got better results than their respective counterparts, namely PTM-Xseq comprising four sequence features and PTM-Xstr relying on the structural distance (AUCs: 0.892 and 0.879 versus 0.852 and 0.753). Regarding the three stringent data sets, we observed a dramatic decrease in the performance of PTM-Xseq and PTM-Xstr, indicating that the distance bias greatly impacted PTM-X. In contrast, the AUCs of our three predictors stably ranged from 0.7 to 0.8. According to the protein-based evaluation in Table 3, the AUCs of PTM-X for the sequence and structural data sets were 0.760 and 0.742, respectively, whereas the measures of PCTpred were 0.787 and 0.804, respectively, demonstrating that our algorithm maintained its advantages in cases close to actual applications. The overall better performance of our algorithm might be due to the following reasons: (i) in addition to the structural distance adopted by PTM-X, our corresponding module considered multifaceted structural features to characterize the paired PTM sites; (ii) compared to the conventional association features, the incorporation of individual residue features provided additional information, playing a critical role in cases without distance preference; and (iii) the feature selection procedure and the fusion of sequence and structural modules fully utilized the complementarity among different signatures.
Because the cross-talk events show strong preferences toward specific PTM types, residue compositions and proteins (Supplementary Figure S1 and Table S9), we checked the performance of PCTpred and PTM-X for these subsets using the remaining samples for training. As shown in Figure 5A and C, both our method and PTM-X can generally achieve AUCs ranging from 0.8 to 0.9, suggesting that the sample preference had little influence on these two algorithms. Furthermore, in some cases, our method showed remarkable superiority over PTM-X. For example, PCTseq yielded AUCs of 0.872 and 0.919 compared to those of 0.800 and 0.782 from PTM-Xseq for the methylation-acetylation and phosphorylation-methylation groups, and PCTpred obtained an AUC of 0.871 compared to that of 0.809 from PTM-X for the lysine-serine group. Through closely examining the number of false predictions, Figure 5B and D illustrates that our method improved the accuracy of negative samples compared to PTM-X. In addition, the transcription factor p53 was chosen for case study. As shown in Figure 5C and D, PCTpred and PTM-X yielded AUCs of 0.906 and 0.887 for this protein, respectively, and the primary difference was that PCTpred correctly identified 32 more negative pairs than PTM-X. Supplementary Figure S5E shows the detailed pairs, and Supplementary Figure S5A–D provides the prediction states of these pairs depending on the partial features or modules in PCTpred. The number of true negatives (TNs) gradually increased with the incorporation of residue-based features and the integration of different modules (A-B-E, TN: 23-24-32; C-D-E, TN: 19-29-32), confirming the utility of our proposed improvements.
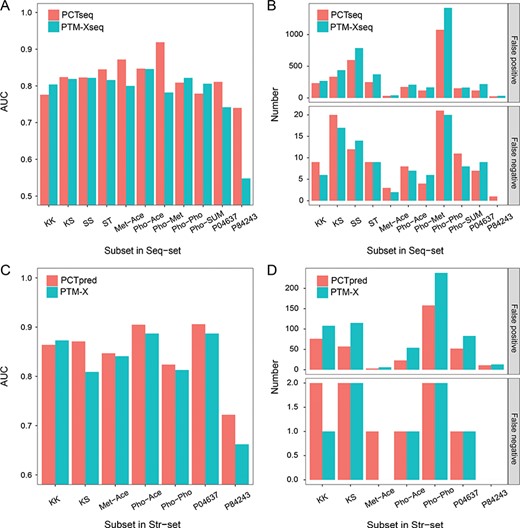
Comparison of the prediction performance of PCTpred (red) and PTM-X (cyan) on different subsets. (A) AUC of subsets in Seq-set, (B) number of false predictions of subsets in Seq-set, (C) AUC of subsets in Str-set and (D) number of false predictions of subsets in Str-set. K, lysine; S, serine; T, threonine; Met, methylation; Ace, acetylation; Pho, phosphorylation; SUM, SUMOlation; P04637, p53 protein; and P84243, histone H3. For the sequence and structural subsets, the numbers of cross-talk pairs are required to be at least 20 and 10, respectively. The sample size of each subset is shown in Supplementary Table S11.
Recently, Casanovas et al. [53] fused the single-PTM-type data of human T cells to build the TCellXTalk database that can perform the inference of co-modified peptides. In addition, they combined in silico inference and experimental detection to investigate the co-occurrence of phosphorylation and ubiquitination in CD3 proteins. The 32 PTM pairs from the 53 potential co-modified peptides inferred by TCellXTalk could be used as an independent test set. Moreover, 15 co-modified peptides comprising 11 PTM pairs were validated by subsequent MS experiments, suggesting that these paired PTMs might interact with each other upon T-cell activation. When the prediction cut-off was set to 0.5, PCTpred and PTM-X achieved the hit rates of 100 (32/32) and 59% (19/32) for the whole set (Supplementary Table S12). Regarding the experimentally verified peptides, these two approaches yielded the hit rates of 100 (11/11) and 73% (8/11), respectively. These results not only reflected the superiority of PCTpred over PTM-X but also demonstrated the generalization ability of our method.
Conclusions
The interplay between PTMs has become a topic of ever-increasing interest in proteomics, but the computational prediction of PTM cross-talk has remarkably lagged behind. Previous studies generally investigated this problem at the sequence level and utilized the association properties between PTMs as the primary descriptors. To address these limitations, we designed an integrated algorithm termed PCTpred based on a group of residue- and residue pair-based properties from both sequence and structural perspectives. Comparing 205 manually curated PTM cross-talk pairs with negative pairs, we found that the properties of individual residues were different between the two groups of samples as well as the association determinants of paired residues. To develop PCTpred, two component predictors, PCTseq and PCTstr, were created based on the finely selected 26 features, 23 of which were newly introduced in this work and 13 of which were residue-based features. The experimental results suggested that the inclusion of residue-based features complemented the weaknesses of traditional residue pair-based features, especially for more stringent data sets without distance preference. Furthermore, compared to native structures, our method can generate competitive prediction results with the input of modeled structures. The head-to-head comparison demonstrated that PCTpred showed stable improvements over the state-of-the-art method PTM-X according to different types of validations.
Despite the improvements achieved here, several problems will continue to be studied in our future work. First, we performed feature selection and model evaluation using the 10-fold CV on Seq-set and Str-set because of the limited positive samples, which may lead to the overestimation of performance. To show the overall robustness of selected features, we further evaluated PCTpred using the other three distance-constrained data sets, protein-based CV and cross-talk subset assessment. Although we used the 32 PTM pairs from co-modified peptides as an external data set to assess our method, more experimentally verified samples should be collected to conduct a rigorous independent test on a relatively large scale. Second, PCTpred and PTM-X mainly utilized the inner information of proteins to characterize and predict cross-talk sites. Cross-talk between distant PTMs usually requires the participation of intermediate proteins and protein complexes [54–56]. Thus, the existing theoretical models neglected the influence generated by these interactors, and the external determinants would be considered in more complicated models when sufficient experimental data become available. Third, there are also cross-talk events between PTM sites from different interacting proteins, but the prediction of this type of cross-talk remains to be explored, especially at the structural level. The present study will offer new insights into this issue, and we will design the structure-based method to identify cross-talk between proteins in the future.
In summary, PCTpred is an efficient and effective algorithm for predicting PTM cross-talk within proteins. Although the interactions between modifications have been considered as a universal mode of PTM-based regulation, the experimentally validated PTM cross-talk events are still scarce in this regard. Here PCTpred opens an alternative avenue, and the information from this tool can be seen as potential evidence that is adopted to guide experimental research for investigating the dynamics and regulation of related PTMs. In addition, unlike the current experimental techniques that are probably restricted to specific proteins such as transcription factors and histones, our predictions can be readily applied to all proteins within the human proteome, which is useful for the study of PTM cross-talk events and associated proteins from a network perspective. Finally, with the help of the native or predicted protein structures, our predictions could not only better estimate the occurrence probability of the interplay between two PTM sites but also show more details about their interaction in the structural context. Therefore, it is anticipated that the creation of PCTpred will advance our understanding of PTM cross-talk events in multiple ways.
We briefly review the computational methods to study PTM cross-talk events and point out that existing studies generally neglect the structural preferences of cross-talk pairs and the properties of individual residues in cross-talk.
We create a structure-based method PCTpred that combines a series of residue- and residue pair-based properties at the sequence and structural levels to predict PTM cross-talk events.
Extensive evaluations indicate that the incorporation of residue-based features effectively complements the weaknesses of traditional residue pair-based ones, and PCTpred achieves consistently better results than the state-of-the-art methods, especially in stringent cases without a distance bias.
Funding
National Natural Science Foundation of China (31301091); Fundamental Research Funds for the Central Universities (2662018JC031).
Hui-Fang Liu is a Master’s student at the College of Informatics, Huazhong Agricultural University. She is interested in developing algorithms in structural bioinformatics.
Rong Liu is an associate professor at the College of Informatics, Huazhong Agricultural University. He is interested in developing computational methods in structural bioinformatics and conducting systems biology research on infectious diseases.
References
