


Abstract
Protein phosphorylation is a reversible and ubiquitous post-translational modification that primarily occurs at serine, threonine and tyrosine residues and regulates a variety of biological processes. In this paper, we first briefly summarized the current progresses in computational prediction of eukaryotic protein phosphorylation sites, which mainly focused on animals and plants, especially on human, with a less extent on fungi. Since the number of identified fungi phosphorylation sites has greatly increased in a wide variety of organisms and their roles in pathological physiology still remain largely unknown, more attention has been paid on the identification of fungi-specific phosphorylation. Here, experimental fungi phosphorylation sites data were collected and most of the sites were classified into different types to be encoded with various features and trained via a two-step feature optimization method. A novel method for prediction of species-specific fungi phosphorylation-PreSSFP was developed, which can identify fungi phosphorylation in seven species for specific serine, threonine and tyrosine residues (http://computbiol.ncu.edu.cn/PreSSFP). Meanwhile, we critically evaluated the performance of PreSSFP and compared it with other existing tools. The satisfying results showed that PreSSFP is a robust predictor. Feature analyses exhibited that there have some significant differences among seven species. The species-specific prediction via two-step feature optimization method to mine important features for training could considerably improve the prediction performance. We anticipate that our study provides a new lead for future computational analysis of fungi phosphorylation.
Introduction
Reversible phosphorylation [1], one of the most important post-translational modifications (PTMs), plays a key role in diverse cellular processes including cell division [2], apoptosis [3], immune response [4] and signal transduction pathway [5]. The process of protein phosphorylation primarily occurs at amino acid residues such as serine (S), threonine (T) and tyrosine (Y) in substrate protein. However, not all of the three residues can be phosphorylated. Thus, the efficient identification of phosphorylation sites is very significant to the understanding of intracellular mechanism. To date, various experimental methods have been used for the identification of phosphorylation sites. Especially, the advent of high-throughput mass spectrometry (MS) [6] has rapidly accumulated fungi phosphorylation data. Furthermore, there is much evidence to indicate that fungi phosphorylation also occurs in more complex organisms [7–9], but its abundance and role remain largely unknown, primarily due to the lack of adequate analytical tools [10]. Indeed, since the discovery of phosphorylation in 1906 by Phoebus A. Leve [11], most researches have been made to analyse the pattern of phosphorylation sites in plants [12, 13], animals [14] and bacteria [15]; only limited advances have been made in the detection of fungi phosphorylation and the clarification of its biological function.
The overall framework of PreSSFP.
Compared with conventional experimental approaches, in silico prediction of phosphorylation sites has become a promising strategy, which could be conducted as preliminary analyses and screens out the potential targets for further confirmation. Although there are excellent methods to analyse protein phosphorylation at S/T/Y residues, few are suitable for the study of fungi phosphorylation. From the research, we also observed that understanding the molecular mechanisms of different species of fungi phosphorylation proteins was essential to regulate fungal pathogenicity of fungal biology. For example, for Cryptococcus neoformans (C. neoformans), one of the essential factors for its virulence is due to activation of cyclic adenosine 5′-monophosphate (cAMP)-dependent protein kinase A (PKA) pathway. PKA is known to phosphorylate various down-stream targets including transcription factors such as Nrg1 and Rim101, through which cAMP/PKA pathway modulates capsule size and melanin formation in C. neoformans. Identification of phosphoproteins in C. neoformans could serve as a discovery platform to establish a molecular network that confers virulence in C. neoformans [16].
Here we used the Fungi Phosphorylation Database (FPD) provided by Bai et al. that comprises 62 272 non-redundant phosphorylation sites in 11 222 proteins across 8 fungal species [17], including Aspergillus flavus (A. flavus) [18], Aspergillus nidulans (A. nidulans) [19], C. neoformans [16], Fusarium graminearum (F. graminearum) [20], Magnaporthe oryzae (M. oryzae) [21], Neurospora crassa (N. crassa) [22], Saccharomyces cerevisiae (S. cerevisiae) [23] and Schizosaccharomyces pombe (S. pombe) [23] to preprocess, and proposed a computational tool of PreSSFP via a two-step feature optimization method for the prediction of specific fungi phosphorylation sites. At first, five types of feature extraction strategies were used to formulate our protein peptide fragments based on the sequence information, evolutionary information and physicochemical properties. Then we performed a two-step feature selection to remove the redundant feature vectors and construct the optimization model on the basis of 10-fold cross-validation. By comparison, PreSSFP exhibited a competitive performance to other existing tools for predicting specific fungi phosphorylation sites. The fungi phosphorylation sites were classified into different species and PTMs sites for training, which could further improve the prediction performance. Taken all together, PreSSFP is provided as an open source tool and implemented in Matlab and JAVA at http://computbiol.ncu.edu.cn/PreSSFP.
Materials and methods
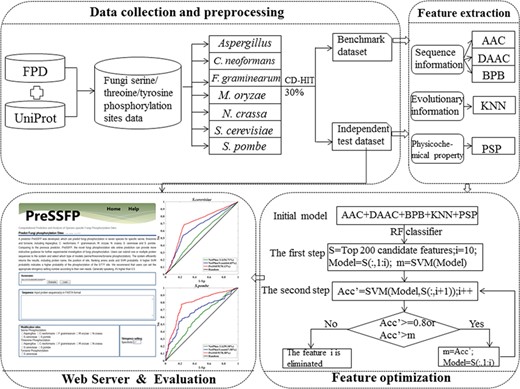
There are four main procedures to construct and evaluate PreSSFP system as follows (Figure 1): (i) construct valid benchmark dataset and independent dataset to train and test the PreSSFP for seven organisms separately; (ii) formulate the peptide samples in the datasets with an effective mathematical expression by extracting their various sequence, evolutionary and physicochemical properties feature; (iii) perform a two-step feature optimization algorithm based on the benchmark datasets to train the optimal feature subsets for each organism in a cross-validation manner; and (iv) objectively evaluate the optimal model for each organism by using the independent test datasets and develop the PreSSFP webserver.
Data collection and preprocessing
In this work, experimentally verified fungi phosphorylation data for eight model organisms, including A. flavus, A. nidulans, C. neoformans, F. graminearum, M. oryzae, N. crassa, S. cerevisiae and S. pombe datasets, were collected from publicly available FPD [16] and UniProt database [24]. Both A. flavus and A. nidulans are belonging to Aspergillus, so we consolidated them into a category of Aspergillus. Therefore, we obtained seven categories data in fungi. The homology protein sequences were removed with a 30% identity cutoff using CD-HIT [25]. For seven model organisms, independent datasets were constructed by randomly selecting 15% of all non-redundant protein entries and the remaining non-redundant proteins were used to construct training dataset. Experimentally verified phosphorylation serine (S) / threonine (T) / tyrosine (Y) residues were regarded as positive samples. All the remaining S/T/Y residues that had not been verified as phosphorylation sites in these proteins were considered as negative samples. Each site was represented as a peptide segment of the length of 15 with S/T/Y in the center. Based on that, a total of 94 proteins with 152 serine phosphorylation sites and 6762 non-phosphorylation sites were obtained as an independent dataset for Aspergillus in this study; the remaining 528 proteins containing 930 serine phosphorylation sites and 37420 non-phosphorylation sites were utilized as training samples (the other different species-specific phosphorylation serine, threonine and tyrosine datasets are shown in Table 1). From Table 1, we find that the number of tyrosine phosphorylation in all species except S. cerevisiae is too small and lacks statistical significance. Therefore, we regarded the tyrosine phosphorylation dataset in other six organisms as the second independent test dataset for cross-species prediction of tyrosine phosphorylation sites. Furthermore, the amount of serine phosphorylation data in S. cerevisiae is too big, so we divided it into 10 averages for training. Finally, the average value of all 10 training results is adopted. In addition, the number of negative samples is greater than positive samples, and a positive-to-negative sample ratio of 1:1 is randomly pooled as a training dataset and independent test dataset.
The statistics of fungi phosphorylation S/T/Y datasets in different organisms
| Organisms | Residue of type | Eliminated homology (sites/proteins) | Training dataset (sites/proteins) | Testing dataset (sites/proteins) |
|---|---|---|---|---|
| Aspergillus | Serine | 1082/622 | 930/528 | 152/94 |
| Threonine | 309/239 | 263/203 | 46/36 | |
| Tyrosine | 36/36 | |||
| C. neoformans | Serine | 931/599 | 785/509 | 146/90 |
| Threonine | 186/134 | 163/118 | 23/16 | |
| Tyrosine | 20/19 | |||
| F. graminearum | Serine | 2384/1090 | 1999/926 | 385/164 |
| Threonine | 625/468 | 526/397 | 99/71 | |
| Tyrosine | 64/60 | |||
| M. oryzae | Serine | 3757/1383 | 3144/1175 | 613/208 |
| Threonine | 1033/591 | 869/502 | 164/89 | |
| Tyrosine | 23/21 | |||
| N. crassa | Serine | 3347/1513 | 2835/1286 | 512/227 |
| Threonine | 1183/800 | 1003/680 | 180/120 | |
| Tyrosine | 139/134 | |||
| S. cerevisiae | Serine | 25497/3327 | 21613/2827 | 3884/500 |
| Threonine | 8567/2441 | 7197/2074 | 1370/367 | |
| Tyrosine | 1810/1194 | 1532/1014 | 278/180 | |
| S. pombe | Serine | 3035/1224 | 2581/1040 | 454/184 |
| Threonine | 561/385 | 481/327 | 80/58 | |
| Tyrosine | 81/75 |
Features extraction and optimization
Sequence information feature
where |${f}_i$| represents the frequency of i-th amino acid pair in|$\Big\{ AA, AC, AD,\cdots, YY\Big\}$|.
is used to encode peptide |$\mathrm{S}$|, where |${p}_j\Big(j=1,2,\cdots, n\Big)$| denotes the posterior probability of each amino acid at the j-th position in the positive training samples, and |${p}_j\Big(j=n+1,n+2,\cdots, 2n\Big)$| denotes the posterior probability of each amino acid at the j-th position in the negative training samples.
Evolutionary information feature
where |$a$| and |$b$| are the two amino acids; |$M$| is the BLOSUM62 substitution matrix; |$Sim$| stems from the normalized amino acid substitution matrix; |$L$| denotes the number of up-stream or down-stream amino acids flanking each side of the target S/T/Y; and |$\mathit{\max}(M)$| and |$\mathit{\min}(M)$| represent the largest and the smallest number in the matrix, respectively.
Physicochemical properties feature
For biochemical reactions, physicochemical property (PSP) is the most instinctive feature and is successfully applied in the bioinformatics field [32, 33]. The properties of each of the 20 amino acids are omnifarious, which can be answerable for the diversity and specificity of protein function and structure. A large number of experimental and theoretical studies have been carried out to show different varieties of properties of individual amino acids and to represent them based on the numerical index. Amino Acid index (AAindex) database (Version 9.1) contains 544 amino acid indices and specifies the physicochemical properties of amino acids. Then, according to the values connected with each PSP, the amino acids around the phosphorylation sites can be encoded. All of the 544 physicochemical properties are examined with descending order on the basis of the value of information gain (IG) in seven species separately. The larger the value of IG is, the greater the impact of the corresponding amino acid residue on the phosphorylation site is. Thus, in our work, in terms of the IG values of all PSP, the top nine are selected and defined as informative features in the prediction model.
Two-step feature optimization
A two-step feature optimization was employed to select prominent feature vectors and then to construct the optimal feature subset. In the first step, we calculated the importance of each feature vector by using random forest (RF) classifier in Python [34–36], which ranked each input feature according to the mean accuracy of the given test data and labels. When we made use of the RF classifier, the parameter n_estimators was first optimized. For n_estimators, the larger the better, but also the longer it will take to compute. In addition, note that results will stop getting significantly better beyond a critical number of trees. Thus, we defined it in the range of 50 to 250 via grid search with cross-validation to obtain the best n_estimators on the basis of accuracy (the detailed information of n_estimators in different model is shown in Table S1). Then we used the best parameter to execute model classification and acquired the top 200 features as the optimal feature candidates after this step. The second step was step-wise feature elimination. First, the feature vectors ranking top 10 in the first step were merged as a training model to calculate the performance based on support vector machine (SVM). At each round, the next feature of the first-step feature list was added into the model and then assessed. If SVM accuracy of the model is improved by its addition as a feature or the SVM accuracy of the model is over 80%, the feature is accepted as the final feature subset to build the prediction model; otherwise, it is eliminated (the detail in Algorithm Two-step feature optimization).
Algorithm Two-step feature optimization
Input:
Benchmark dataset, S; |$\mathrm{S}\!={\!\Big({X}_1,{X}_2,\dots, {X}_n\!\Big)}^T$|,|${X}_i\!=\!\Big({x}_{i1},{x}_{i2},\dots, {x}_{ip}\Big),\\ i=1,2,\dots, n$|
Response values|$, y=\Big({y}_1,{y}_2,\dots, {y}_n\Big)$|
Testing dataset, T; |$\mathrm{T}\!=\!{\Big({X_1}^{\prime },{X_2}^{\prime },\dots, {X_m}^{\prime}\!\Big)}^T$|,|${X_i}^{\prime}\!=\!\Big({x_{i1}}^{\prime },{x_{i2}}^{\prime },\dots, {x_{ip}}^{\prime}\Big),\\ i=1,2,\dots, m$|
Feature selection method, Two-step feature optimization;
Output:
Predicted label |${y}^{\prime }=\Big({y}_1^{\prime },{y}_2^{\prime },\dots, {y}_m^{\prime}\Big)$| for testing dataset.
1: for each |$i\in \Big[1,n\Big]$| do
2: S’=FiveFeatureCode(S,|$i$|);
3: end for
4: for each |$n\_ estimator\in \Big[50,250\Big]$| do
5: best_n_estimator = GridSearchCV(S’,|$y$|, n_estimator);
6: end for
7: [ranking, index] = RFclassifier(S’,|$y$|, best_n_estimator);
8: Model=Extract(S’, index (1:10));
9: Acc=SVM (Model);
11: m=Acc;
12: for each |$i\in \Big[11,200\Big]$| do
13: Model = Combine (Model, Exact(S’, index (i)));
14: NewAcc = SVM (Model);
15: if m>NewAcc
16: if NewAcc>=0.8
17: m=NewAcc;
18: continue;
19: elseif NewAcc <0.8
20: Model (:,i)=[];
21: end if;
22: elseif m<= NewAcc
23: m=NewAcc;
24: continue;
25: end if;
26: end for;
27: for each |$i\in \Big[1,m\Big]$| do
28: |${\mathrm{T}}^{\prime }$|=FiveFeatureCode(|$\mathrm{T}$|,|$i$|);
29: end for
30: F=getTopfeatures(|${\mathrm{T}}^{\prime }$|, Model);
31: |${y}^{\prime }$|=SVMfromCrossValidation(F);
32: return |${y}^{\prime }$|;
Performance evaluation
where TP, TN, FP and FN denote the number of true positives, true negatives, false positives and false negatives, respectively. The receiver operating characteristic (ROC) curves and area under ROC (AUC) values were also carried out.
Results
Current progresses in the prediction of eukaryotic phosphorylation sites
It is believed that up to one-half of eukaryotic proteins undergo phosphorylation [39]. Thus, most of the previous studies were mainly focused on eukaryotic proteins phosphorylation, including animals, plants and fungi. Table 2 provides a simple overview of currently available eukaryotic protein phosphorylation site prediction methods, including the type of species, tool name, kinase or kinase family-specific prediction, feature information, prediction algorithm, reference and website. From Table 2, 47 phosphorylation site prediction tools have been developed. We have broadly divided them into two categories: tools for general phosphorylation site prediction and tools for species-specific phosphorylation site prediction. However, the tool for fungi-specific phosphorylation site prediction is not available due to lack of data. There have only tools for predicting yeast phosphorylation site, including NetPhosYeast [38] and PhosphoPICK [76]. Meanwhile, it can be seen that the biggest difference among these computational methods is the feature information and prediction algorithm. As shown in Table 2, most of the prediction algorithms for identifying protein phosphorylation sites were machine learning methods, including artificial neural networks (ANNs), SVM, RFs, logistic regression and Bayesian network, etc. For example, the first tool, NetPhos 3.1, was built to predict eukaryotic proteins phosphorylation sites based on ANN by Blom et al. in 1999 [40]. Kim et al. implemented PredPhospho 1.0 in SVMs algorithm to predict for four PK groups and four PK families. And its enhanced version-PredPhospho 2.0 could predict for 7 PK groups and 18 PK families [70, 71]. As we can see from Table 2, owing to the strong generalization ability and versatility of SVM, it is the most widely used prediction algorithm for identifying phosphorylation sites.
Summary of currently available prediction tools of eukaryotic phosphorylation sites
| Type of species | Tool name | PK-spec | Feature information | Prediction algorithm | Reference | Website (http://) | |
| General | NetPhos | No | SI | ANN | [40] | www.cbs.dtu.dk/services/NetPhos | |
| Scansite 2.0 | Yes | SP | PSSM | [41] | scansite.mit.edu | ||
| NetPhosK | Yes | SI | ANN | [42] | www.cbs.dtu.dk/services/NetPhosK | ||
| DISPHOS 1.3 | No | AAF, Disorder | LR | [43] | www.dabi.temple.edu/disphos (N/A) | ||
| PHOSITE | Yes | PSSM | PA | [44] | www.phosite.com(N/A) | ||
| PPSP 1.0 | Yes | BDT | BP | [45] | ppsp.biocuckoo.org | ||
| pkaPS | Yes | Motif | SA | [46] | mendel.imp.univie.ac.at/sat/pkaPS | ||
| NetworKIN | Yes | Motif, PSSM | ANN | [47] | networkin.info/index.shtml | ||
| KinasePhos | Yes | SP, CP | SVM | [48, 49] | KinasePhos2.mbc.nctu.edu.tw | ||
| GANNPhos | No | BE | GANN | [50] | — | ||
| AMS | Yes | BE | SVM | [51, 52] | ams2.bioinfo.pl (N/A) | ||
| MetaPredPS | Yes | SP | WV | [53] | MetaPred.umn.edu/MetaPredPS | ||
| SMALI | Yes | PSSM | Match | [54, 55] | lilab.uwo.ca/SMALI.htm (N/A) | ||
| Predikin | Yes | PSSM, SA | HMM | [56, 57] | predikin.biosci.uq.edu.au. | ||
| CRPhos 0.8 | Yes | SI | CRF | [58] | www.ptools.ua.ac.be/CRPhos | ||
| PostMod | Yes | SP, EI | NR | [59] | biodb.kaist.ac.kr/PTM | ||
| iGPS 1.0 | Yes | SI | GPS | [60] | gps.biocuckoo.org | ||
| PhosK3D | Yes | SP, 3D | SVM | [61] | csb.cse.yzu.edu.tw/PhosK3D | ||
| PTMPred | Yes | PSPM | SVM | [62] | doc.aporc.org/wiki/PTMPred | ||
| ModPred | No | SP | MoRFs | [63] | www.modpred.org (N/A) | ||
| JUPred_MLP | No | PSSM | MLP | [64] | — | ||
| Animal | General | PhosphoSVM | No | SP | SVM | [14] | sysbio.unl.edu/PhosphoSVM. |
| PhosContext2vec | Both | SP | Context2vec | [65] | phoscontext2vec.erc.monash.edu | ||
| Homo | CRP | No | SP | SPR | [66] | fasta.bioch.virginia.edu/crp | |
| sapiens | GPS 2.0 | Yes | SI | GPS | [67] | gps.biocuckoo.org | |
| PhoScan | Yes | SI, flexibility | LOR | [68] | bioinfo.au.tsinghua.edu.cn/phoscan | ||
| Musite | Yes | KNN, Disorder, AAF | SVM | [69] | musite.sourceforge.net | ||
| PredPhospho | Yes | AAPC | SVMs | [70, 71] | phosphovariant.ngri.go.kr | ||
| Phos_pred | Yes | FI | RF | [72] | bioinformatics.ustc.edu.cn/phos_pred | ||
| PSEA | Yes | SP | PSEA | [73] | bioinfo.ncu.edu.cn/PKPred_Home.aspx | ||
| iPhos-PseEn | No | PseEn | RF | [74] | www.jci-bioinfo.cn/iPhos-PseEn | ||
| PhosphoPICK | Yes | PSAAF | BN | [75, 76] | bioinf.scmb.uq.edu.au/phosphopick | ||
| MusiteDeep | Both | BE | DL | [77] | github.com/duolinwang/MusiteDeep | ||
| PhosphoPredict | Yes | SP, FI | mRMR | [78] | phosphopredict.erc.monash.edu/webserver.html | ||
| KSRPred | Yes | SP, PPI | KRR | [79] | — | ||
| iPhos-PseEvo | No | EI, PseAAC | GST | [80] | www.jci-bioinfo.cn/iPhos-PseEvo | ||
| Multi-iPPseEvo | No | EI, PseAAC | GST | [81] | www.jci-bioinfo.cn/Multi-iPPseEvo | ||
| PTM-ssMP | No | ssMP | SVM | [82] | bioinformatics.ustc.edu.cn/PTM-ssMP/index | ||
| Quokka | Yes | NNS, AAF, WLS, BSI, KNN | LR | [83] | quokka.erc.monash.edu/ | ||
| Mouse | PhosphoPICK | Yes | PSAAF | BN | [76] | bioinf.scmb.uq.edu.au/phosphopick | |
| Plant | General | — | Yes | SI | HMM, GPS | [84] | ekpd.biocuckoo.org/protocol.php |
| Arabidopsis | PhosPhAt | No | Structure | SVMs | [12] | phosphat.uni-hohenheim.de | |
| thaliana | PlantPhos | No | MDD | HMM | [13] | csb.cse.yzu.edu.tw/PlantPhos | |
| Musite | Yes | KNN, Disorder, AAF | SVM | [85] | musite.sourceforge.net | ||
| KMPhos | No | KMs | SVM | [86] | — | ||
| Rice | PhosphoRice | No | SI | WVS | [87] | bioinformatics.fafu.edu.cn/PhosphoRice | |
| Rice_Phospho | No | AF-CKSAAP | SVM | [88] | bioinformatics.fafu.edu.cn/rice_phospho1.0 | ||
| Soybean | PHOSFER | No | AAIndex | RF | [89] | saphire.usask.ca | |
| Fungi | Yeast | NetPhosYeast | No | SI | ANN | [38] | www.cbs.dtu.dk/services/NetPhosYeast |
| PhosphoPICK | Yes | PSAAF | BN | [76] | bioinf.scmb.uq.edu.au/phosphopick |
On the other hand, in Table 2, many different feature infor-mation and encoding methods have been used to formulate the protein or peptide samples, including sequence information, structural information, physicochemical properties, evolutionary information and functional information. Among them, sequence information is the most widely used. Some predictors, like NetPhos, used the whole protein sequence information to input training model, or other predictors, such as GANNPhos and AMS, used AAC or binary encoding to encode amino acid sequence fragment for model training. Phosphorylation sites have been observed to be preferentially located in disordered regions [90]. In 2004 and 2010, predicted disorder scores for phosphorylation sites were used as features in the phosphorylation predictor DISPHOS [43] and Musite [69]. It is true that disorder scores of the experimentally verified phosphorylation sites are rare, and most of them require predictive tools to predict disorder scores, but doing so will bias the results of the prediction model. Meanwhile, the use of physicochemical properties could play a role in the phosphorylation site prediction tools. For example, the predictor PHOSFER used 24 AAIndex indices to encode protein sequence [89]. It mainly adopted consensus fuzzy clustering method to cluster 544 amino acid properties into 8 clusters and then identified a set of 24 indices consisting of three individual AAIndex indices from each cluster. The results suggested it was necessary to extract important information from 544 AAIndex for encoding phosphorylation sequences. Evolutionary information, such as KNN, was very effective feature when used for predicting phosphorylation sites [69, 83]. Li et al. designed Quokka with KNN and sequence information feature in 2018, which provided a high-quality prediction [83]. Furthermore, in order to improve predictive performance of the model, some tools utilized multiple information integration to predict phosphorylation sites, including PostMod [59] and Musite [69]. The combination of features can lead to a certain improvement, while they have not discussed the importance and contribution of different features for the phosphorylation sites prediction. Many of the derived features may contain redundant information and not all of the features play an equally important role in the prediction. Thereby feature selection is very necessary to select the most informative features and their contribution to the phosphorylation site prediction should be discussed in detail.
Fortunately, lots of fungi phosphorylation sites have been identified in the past 6 years, which provides a great opportunity to design a tool for fungi phosphorylation analysis. In view of the above, by incorporating sequence information, physicochemical properties and evolutionary information that had been evidenced good performances for prediction PTMs sites in the previous tools with two-step feature optimization strategy, we proposed PreSSFP for predicting species-specific fungi phosphorylation sites.
Feature optimization results via two-step feature optimization
In the previous research [26, 91, 92], we found that the results of independent coding tests with single feature were less than the combination of all five types of features (AAC, DAAC, BPB, PSP and KNN). So we combined all five types of features as a model for access. However, the prediction performances of the model were not fully satisfactory. It may be owing to all features that are not equivalently essential for the model performance. Or some of feature vectors may be unwanted noise, which easily leads to bias in the prediction performance. Thus, it is generally indispensable to execute feature optimization so that we can reserve the important one. As we know, the principal components analysis (PCA) [93] and maximum relevance minimum redundancy (mRMR) [78] are usually used for feature selection. PCA is aimed at selecting the data with higher cumulative contribution rate after processing and transformation of the original data. The mRMR method is based on mutual information for quantifying relevance and redundancy. In Figure 2, taking serine phosphorylation in Aspergillus, tyrosine phosphorylation in S. cerevisiae and threonine phosphorylation in C. neoformans as an example, we used the PCA and mRMR to carry out feature selection, respectively, and compared their results with two-step feature optimization. From Figure 2, we found that prediction performance of the model by using two-step feature optimization is superior to that of PCA and mRMR based on the feature vectors of the same dimension. For example, the accuracy has improved by 5% and 4% for serine phosphorylation of Aspergillus in comparison with mRMR and PCA separately, and the accuracy has increased at a rate of 17% and 15% for threonine phosphorylation in C. neoformans, compared with mRMR and PCA, respectively.
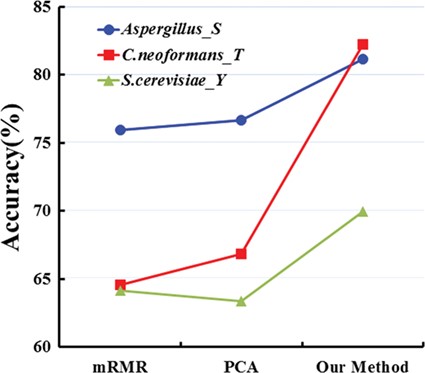
Accuracies of our method with mRMR and PCA for serine phosphorylationin Aspergillus, tyrosine phosphorylation in S. cerevisiae and threonine phosphorylation in C. neoformans, respectively.
Here we applied two-step feature optimization to dig the principal feature vectors when generating the serine phosphorylation sites predictive model of Aspergillus. To start with, we had a total of 580 dimension feature vectors by combining all five types of features. Then we set the parameter n_estimator in the range of 50 to 250 for acquiring the best n_estimator. By using gridsearchcv, we obtained that the best n_estimator was 190 for prediction Aspergillus serine phosphorylation. Next, we received the ranking of the feature importance via RF classifier on the basis of 190. The lower the ranking of the feature vector is, the greater the impact on the serine phosphorylation sites is. Accordingly, we obtained the top 200 feature vectors as the optimal feature candidates for the second step feature optimization. Finally, we selected the feature vectors ranking top 10 from the 200 feature vectors to construct an initial model and calculated the performance. Whereafter, the remaining 190 feature vectors were put into this model to train one by one. If SVM accuracy of the model has been improved, the feature vector is preserved to construct a new model for the next training. Otherwise, it is eliminated. From what has been described above, with the dimension decreasing from 580 to 146, the accuracy increased from 77.90% to 81.18% and the AUC value added from 77.41% to 80.65% in serine phosphorylation sites prediction for Aspergillus. Comparatively speaking, the chosen feature vectors have superior prediction performance to the combination of five types of features. Totally, 15 models are built, including 7 serine phosphorylation models, 7 threonine phosphorylation models and 1 tyrosine phosphorylation model. The prediction performance of combining five types of features and the selected feature vector by two-step feature optimization for predicting other species-specific fungi phosphorylation protein sites are shown in Table 3.
Analysis of feature importance and contribution
Sequentially, we further analysed which feature vectors are valuable to prediction model based on optimization features selected by two-step feature optimization. In Figure 3, taking serine phosphorylation in Aspergillus, tyrosine phosphorylation in S. cerevisiae and threonine phosphorylation in C. neoformans as an example, for phosphoserine in Aspergillus, we reconstituted 143-dimension new feature vectors from above five types of features, and the ratios of dimension of chosen feature vectors belonging to the five types of features are 0.04 (15/400), 1 (5/5), 0.72 (91/126), 0.75 (21/28) and 0.67 (14/21). For phosphothreonine in C. neoformans, 168-dimension new feature vectors were selected from the above five types of features, and 0.06 (27/400), 1 (5/5), 0.80 (101/126), 0.82 (23/28) and 0.57 (12/21) were the proportions of dimension of chosen feature vectors accounting for the five types of features. In view of these results, we observed that the ratio of KNN feature was notably higher than those of other four features, indicating that KNN features exerted a vital effect on the performance evaluation of the model and contributed to identifying phosphorylation S/T/Y sites. Meanwhile, from the RF classifier results, the importance ranking of KNN feature in seven species is also higher than those of other features. Correspondingly, KNN features exhibited the best performances in these models, which could be concerned with conserved residues and detected local sequence similarity. Phosphorylation-related clusters may exist in local sequences around phosphorylation sites [69], and KNN can capture the cluster information and distinguish them from the background. Therefore, KNN score is suitable to be used as a feature for predicting phosphorylation sites. Then, from Figure 3, the ratios of the PSP and BPB features were also relatively high, implying that the PSP and the frequency of each amino acid at each position were also comparatively important to predict phosphorylation S/T/Y sites. In fact, the physicochemical properties of amino acids surrounding phosphorylation sites had an impact on phosphorylation event [94]. In contrast, the ratios of DAAC feature vectors are relatively low. Meanwhile, from Figure 3, the constitution of final feature vectors is various in different species models. It shows that the impact of each feature on all species is distinct and then the performance evaluation of the prediction model is different as well. Furthermore, the feature optimization results of serine and threonine phosphorylation in different species also revealed that two-step feature optimization method, which fully considered the importance and contribution of each dimension feature vector, can achieve the higher prediction accuracy.
The prediction performance of before and after feature optimization for the fungi phosphorylation S/T/Y site in seven organisms
| Site | Organisms | Performance of prediction (before) | Performance of prediction (after) | ||||||||
|---|---|---|---|---|---|---|---|---|---|---|---|
| dim | Acc (%) | Sn (%) | Sp (%) | AUC (%) | dim | Acc (%) | Sn (%) | Sp (%) | AUC (%) | ||
| S | Aspergillus | 580 | 77.90 | 77.89 | 78.30 | 77.41 | 146 | 81.18 | 82.22 | 80.21 | 80.65 |
| C. neoformans | 580 | 76.06 | 77.16 | 75.37 | 75.80 | 77 | 81.01 | 83.56 | 78.82 | 80.81 | |
| F. graminearum | 580 | 75.71 | 75.10 | 76.52 | 75.43 | 41 | 79.40 | 80.63 | 78.62 | 80.16 | |
| M. oryzae | 580 | 77.08 | 76.67 | 77.57 | 77.30 | 45 | 80.10 | 78.38 | 82.03 | 80.80 | |
| N. crassa | 580 | 78.12 | 77.25 | 79.13 | 78.02 | 151 | 80.29 | 76.66 | 85.06 | 80.78 | |
| S. cerevisiae | 580 | 74.04 | 73.17 | 75.01 | 74.44 | 95 | 76.62 | 76.26 | 77.00 | 78.44 | |
| S. pombe | 580 | 76.69 | 76.60 | 76.86 | 76.58 | 44 | 78.68 | 77.21 | 80.33 | 77.50 | |
| T | Aspergillus | 580 | 69.88 | 70.74 | 69.58 | 70.65 | 123 | 74.18 | 74.03 | 75.06 | 75.34 |
| C. neoformans | 580 | 76.60 | 78.65 | 75.66 | 74.46 | 168 | 82.26 | 83.33 | 81.25 | 81.13 | |
| F. graminearum | 580 | 72.55 | 72.70 | 72.66 | 72.14 | 90 | 81.13 | 78.95 | 83.67 | 81.21 | |
| M. oryzae | 580 | 76.98 | 75.87 | 78.42 | 76.73 | 111 | 81.03 | 77.55 | 85.53 | 82.41 | |
| N. crassa | 580 | 78.25 | 78.96 | 78.20 | 78.00 | 151 | 78.96 | 78.41 | 79.96 | 78.81 | |
| S. cerevisiae | 580 | 69.28 | 71.30 | 67.27 | 73.16 | 94 | 75.35 | 72.39 | 79.20 | 75.08 | |
| S. pombe | 580 | 71.61 | 73.19 | 70.98 | 71.68 | 94 | 73.48 | 73.64 | 73.85 | 73.40 | |
| Y | S. cerevisiae | 580 | 62.96 | 63.11 | 62.88 | 62.54 | 51 | 69.93 | 71.63 | 68.48 | 70.00 |
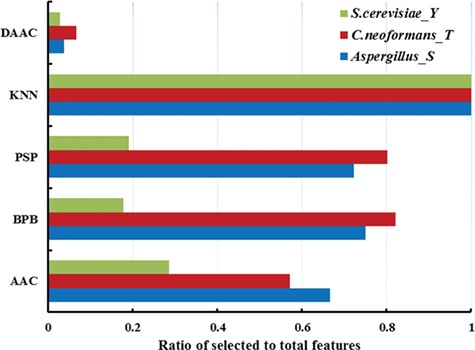
Comparison with ratio of each type of feature of serine phosphorylation in Aspergillus, tyrosine phosphorylation in S. cerevisiae and threonine phosphorylation in C. neoformans. The horizontal axis represents the ratios of dimension of chosen feature vectors belonging to the five types of features. The vertical axis represents the five types of features (AAC, DAAC, BPB, PSP and KNN).
Feature analysis of phosphorylation of different species
After that, we further detected and visualized statistically significant differences about the compositional biases of sequences between phosphorylation and non-phosphorylation sites. Figure 4a displays the frequency information of amino acid occurrence in serine phosphorylation. For Aspergillus, aliphatic amino acids such as aspartic, proline, alanine, glutamic and glycine are enriched in the positive fragment, while polar amino acids including cysteine, threonine and serine are depleted. For S. pombe, lysine, arginine, aspartic and glutamic, which have charged, are enriched in the positive fragment, while aliphatic amino acids such as leucine, asparagine and tryptophane are depleted in the negative fragment. It shows that there have significant differences among different species. This result is certified by the two-sample logo results (Figure 4c–d) [95]. Similarly, from Figure S1, we also find that there have significant differences in threonine phosphorylation for seven species. Then, based on IG, we chose the rank top 9 from 544 PSP to construct our model (Figure 4b). From the analysis of feature importance, we find that the selected nine PSP features make a great contribution to our model indeed.
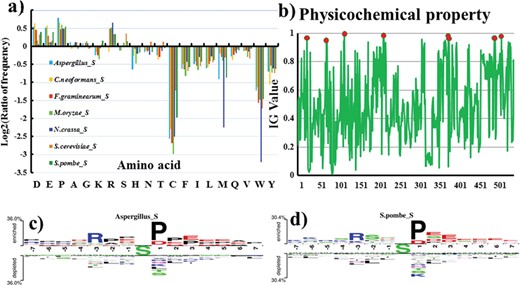
(a) Comparison of AAC between serine phosphorylation sites and non-phosphorylation sites for seven organisms. The vertical axis denotes the log2 ratio of the averages of amino acid frequencies for phosphorylation and non-phosphorylation sites. (b) Difference in 544 physicochemical properties based on IG scores. Two-sample Logos of composition biases around serine phosphorylation sites compared to the non-phosphorylation sites for (c) Aspergillus and (d) S. pombe.
Figure 5a and b reflects the frequency information of amino acid pair occurrence. Taking serine phosphorylation in Aspergillus as an example, after the two-step feature optimization, we extracted the DAAC feature from the final optimized feature set to plot the radar map (Figure 5a). We can find that the SP and SS have the highest values in 15 amino acid pairs, which represent the two most important types of amino acid pair. Figure 5b shows the frequency information of 400 amino acid pairs for serine phosphorylation in Aspergillus. It can be seen that SP and SS also have higher frequencies than other amino acid pairs. Meanwhile, the motif scores of Figure S2 are in accordance with the above results [96]. Similarly, we make the same analysis for threonine phosphorylation in C. neoformans (Figure S3). From Figure S3, the frequency of TP is far higher than other 26 amino acid pairs and the heat maps of DAAC also display that the amino acid pair TP is significant, which are consistent with motif result. Subsequently, in Figure 5c and Figure S4a, we further analysed the posterior probabilities of each amino acid at each position in the positive and negative training datasets for serine phosphorylation in Aspergillus, respectively. From Figure 5c, we observe that positive samples tend to enrich at position −3, +1 and +3, which is identical with the two-sample logo results, while the negative samples have almost the same value at each position, indicating that there have significant differences between positive and negative samples. It can be seen from the previous analysis of feature importance that the proportion of the selected BPB feature to the total reaches 80%. Similarly, we observe that the average frequency value of positive samples at position −4, −3, −2, +2, +3 and +4 is relatively higher than negative samples in Figure S4a. Finally, we compared the average KNN score of phosphorylation sites with those of non-phosphorylation sites in Figure 5d and Figure S4b. Due to the gap of data, we selected different k values and comparison sets (the detail in Table S2). With the biggest difference between positive and negative, KNN score with different k values exhibited the best performance. For example, for Aspergillus, the average KNN score of serine phosphorylation is within 0.70−0.88, while the non-phosphorylation average KNN scores are within 0.46–0.53. From the above results of feature optimization, the Acc value of Aspergillus is 0.812, which have the higher accuracy than that of other modifications. Taken together, it shows that there have significant differences among different species in the same modification residue, which indicates the necessity of species-special identification of fungi phosphorylation sites.
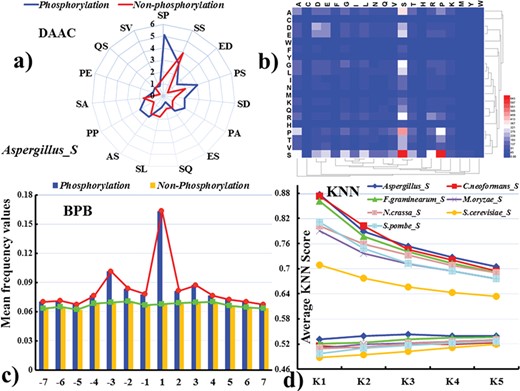
(a) Radar map for the 15 most important pairs of DAAC on the basis of two-step feature optimization. The primary axis refers to the number of occurrences in the positive and negative samples with the unit of 100. (b) Heat map for the DAAC scores of amino acid pair composition. (c) Difference in the average frequency value of each amino acid in the positive training datasets for serine phosphorylation in Aspergillus on different positions. (d) Comparison of mean KNN scores between threonine phosphorylation sites and non-phosphorylation sites. The vertical axis represents the average KNN scores. The horizontal axis represents numbers of nearest neighbors in positive and negative samples.
Species-specific fungi phosphorylation site prediction of PreSSFP
In this work, 15 models for fungi phosphorylation sites prediction were constructed. On the basis of 10-fold cross-validation, we evaluated the performance of each model on each training dataset and the ROC curve is shown in Figure 6. For serine phosphorylation in seven species, the AUC values of Aspergillus, C. neoformans, F. graminearum, M. oryzae, N. crassa, S. cerevisiae and S. pombe were 0.807, 0.808, 0.802, 0.808, 0.807, 0.784 and 0.775, respectively. For threonine phosphorylation in seven species, the AUC values were 0.754, 0.811, 0.812, 0.824, 0.788, 0.751 and 0.734. For tyrosine phosphorylation in S. cerevisiae, the AUC value was 0.70. From the ROC curves, we knew that those models have relatively good confident predictions. In contrast, we used the tyrosine phosphorylation dataset of each species except S. cerevisiae as testing set to test tyrosine phosphorylation site model for S. cerevisiae, but the results of prediction was not fully satisfactory and achieved lower AUC scores and specificities (the detail in Table S3). In general, these justify the necessity of species-specific prediction and our prediction model PreSSFP is a robust predictor.
Comparison with other existing tools
For the purpose of evaluating the prediction performance of the PreSSFP objectively, general and species-specific predictors were selected to compare with PreSSFP. Taking into account the availability and representativeness of tools, general tool NetPhos 3.1, yeast-specific predictor NetPhosYeast, soybean-specific predictor PHOSFER and human-specific predictor iPhos-PseEn were employed. Because NetPhosYeast tools can only predict S/T phosphorylation in yeast proteins, we used it to predict S. cerevisiae, S. pombe and C. neoformans data. The tool NetPhos 3.1, PHOSFER and iPhos-PseEn were used to predict all seven species. We directly submitted testing data set of each species for the prediction, and the results of PreSSFP were used for a comparison. As shown in Table 4, for the serine phosphorylation prediction of S. pombe, the AUC value of PreSSFP is 0.784. Compared with NetPhos 3.1, PHOSFER and iPhos-PseEn, the AUC value of our model has improved by 19.3%, 13.69% and 14.27%, respectively. Meanwhile, the AUC value of NetPhosYeast is 0.676. Comparison of prediction performance of PreSSFP with other tools in threonine and tyrosine phosphorylation sites is listed in Table S4. For the threonine phosphorylation in C. neoformans, compared with NetPhos 3.1, PHOSFER and iPhos-PseEn, the AUC value of our model has increased at a rate of 34.4%, 16.33% and 10.38%, respectively; compared with the test results of NetPhosYeast, the AUC value of our model has improved by 24.18%. This suggests that PreSSFP is better than general tools, and there are some differences among serine, threonine and tyrosine phosphorylation sites in the same species.
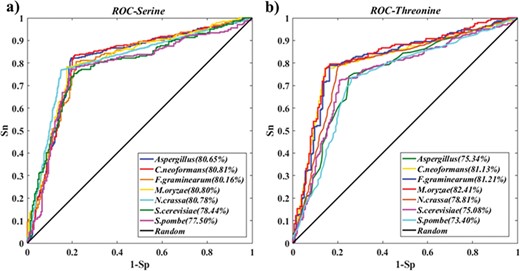
Performance evaluation of PreSSFP. The ROC curves and AUC values for 10-fold cross-validations of the training dataset for seven organisms. (a) Serine phosphorylation. (b) Threonine phosphorylation.
Comparison of prediction performance of PreSSFP with other tools in serine phosphorylation sites
| Organisms_S | Predictor | Performance of prediction | ||||
|---|---|---|---|---|---|---|
| Acc (%) | Sn (%) | Sp (%) | MCC (%) | AUC (%) | ||
| Aspergillus | NetPhos 3.1 | 54.28 | 53.89 | 54.74 | 8.38 | 54.27 |
| PHOSFER | 64.47 | 81.43 | 59.40 | 34.38 | 69.08 | |
| iPhos-PseEn | 69.44 | 85.00 | 63.46 | 43.41 | 75.10 | |
| Our work | 83.88 | 85.03 | 82.80 | 67.80 | 85.20 | |
| C. neoformans | NetPhos 3.1 | 57.53 | 56.88 | 58.33 | 15.14 | 57.96 |
| NetPhosYeast | 55.48 | 52.99 | 83.33 | 19.95 | 68.46 | |
| PHOSFER | 58.56 | 74.51 | 55.19 | 22.55 | 58.41 | |
| iPhos-PseEn | 70.00 | 78.57 | 65.38 | 41.93 | 68.68 | |
| Our work | 76.03 | 76.39 | 75.68 | 52.06 | 79.66 | |
| F. graminearum | NetPhos 3.1 | 56.62 | 56.14 | 57.18 | 13.29 | 58.05 |
| PHOSFER | 62.47 | 88.10 | 57.45 | 33.70 | 72.24 | |
| iPhos-PseEn | 64.84 | 75.68 | 60.44 | 32.74 | 68.73 | |
| Our work | 76.23 | 75.25 | 77.30 | 52.51 | 76.67 | |
| M. oryzae | NetPhos 3.1 | 58.16 | 57.46 | 58.99 | 16.38 | 57.70 |
| PHOSFER | 56.44 | 70.90 | 53.81 | 17.84 | 63.04 | |
| iPhos-PseEn | 58.70 | 61.11 | 57.14 | 17.82 | 63.10 | |
| Our work | 73.65 | 73.31 | 74.01 | 47.31 | 75.07 | |
| N. crassa | NetPhos 3.1 | 54.79 | 53.88 | 56.23 | 9.84 | 54.36 |
| PHOSFER | 57.03 | 69.57 | 54.29 | 18.31 | 60.38 | |
| iPhos-PseEn | 69.42 | 75.00 | 65.88 | 39.85 | 69.96 | |
| Our work | 78.52 | 77.14 | 80.04 | 57.10 | 78.04 | |
| S. cerevisiae | NetPhos 3.1 | 54.39 | 54.12 | 54.70 | 8.80 | 54.71 |
| NetPhosYeast | 56.46 | 53.70 | 75.72 | 19.50 | 64.65 | |
| PHOSFER | 52.78 | 67.82 | 51.51 | 10.37 | 58.99 | |
| iPhos-PseEn | 67.45 | 71.18 | 64.83 | 35.45 | 66.81 | |
| Our work | 71.06 | 68.55 | 74.36 | 42.51 | 70.13 | |
| S. pombe | NetPhos 3.1 | 57.49 | 56.64 | 58.59 | 15.10 | 59.10 |
| NetPhosYeast | 56.83 | 53.85 | 80.39 | 21.62 | 67.58 | |
| PHOSFER | 56.39 | 76.36 | 53.63 | 19.58 | 64.69 | |
| iPhos-PseEn | 65.43 | 72.73 | 61.68 | 32.59 | 64.11 | |
| Our work | 77.75 | 77.63 | 77.88 | 55.51 | 78.38 | |
The following reasons may account for such a big difference. First, with the large-scale identification of fungi phosphorylation sites using MS, the number of fungi phosphorylation sites has increased apparently. The data may cause a bias classification of the training model. For example, the NetPhosYeast only considered a total of 953 phosphoserine sites and 192 phosphothreonine sites from 675 yeast proteins. However, PreSSFP integrated all experimental fungi phosphorylation sites from FPD. Second, different organisms may significantly differ in sequences or structural patterns around the phosphorylation sites. For instance, comparative analysis of serine phosphorylation event between different species of eukaryotes performed by Frades et al. revealed that the animal-specific motifs are mainly basic amino acids and the plant-specific top discriminative n-grams contain many acidic amino acids [93]. The general tool NetPhos 3.1, yeast-specific predictor NetPhosYeast, soybean-specific predictor PHOSFER and human-specific predictor iPhos-PseEn are not suitable for predicting all species. The comparison results of PreSSFP with other tools just highlighted the necessity for developing systematic species-specific model to improve the prediction performance of phosphorylation sites. Third, the NetPhos 3.1 and NetPhosYeast only concentrated on the sequence information, and PHOSFER merely combined several amino acid indices to encode protein sequences and iPhos-PseEn just considered the evolutionary information, which could not extract fully features information. Nevertheless, PreSSFP integrated five feature strategies to ensure the complete extraction of sequence-derived information, evolutionary information and physical chemistry properties information.
Conclusions
In this study, on the basis of the primary protein sequences, an online tool named PreSSFP that used a two-step feature optimization method was developed for identifying potential fungi phosphorylation sites. The corresponding analyses and comparison with the existing tools demonstrated that PreSSFP was stabilized and satisfied in the prediction performance and considerably improved the prediction results of fungi phosphorylation sites. Feature analysis showed that the different fungi-species phosphorylation sites have some significant differences in sequenced-derived information, indicating that distinguishing different species was important for fungi phosphorylation sites prediction in order to improve prediction quality. Meanwhile, feature optimization exhibited that KNN feature was significant and exerted a great influence on predicting fungi phosphorylation sites. For the future prediction of fungi phosphorylation sites, newly identified fungi phosphorylation sites will be continuously collected and integrated into computational models, for a better prediction if available. In conclusion, we anticipate that PreSSFP can exert a complementary effect on existing approaches in fungi phosphorylation sites identification. Additionally, the combination of computational analyses with experimental verification could afford useful information for the understanding of the modified mechanism.
There have some significant differences among different species in fungi phosphorylation.
It is necessary for the classification of fungi phosphorylation sites into different species to predict.
We provide a tool of computational prediction of fungi phosphorylation in seven species.
Through two-step feature optimization to extract important feature is efficient, which can considerably improve the prediction performance of PreSSFP.
Funding
This work was supported by the National Natural Science Foundation of China (21665016 and 21305062) and the Natural Science Foundation of Jiangxi Province (20151BAB203022).
Cao Man is a graduate student at School of Sciences, Nanchang University. Her research focuses on integrative tyrosine post-translational modifications data for analysis and validation.
Guodong Chen is a graduate student at School of Sciences, Nanchang University. His current research focuses on developing novel data analysis algorithms and software of prokaryotes lysine acetylation.
Jialin Yu is a graduate student at School of Sciences, Nanchang University. His research focuses on deep learning and prediction of protein structure and function.
Shaoping Shi is an associate professor at School of Sciences, Nanchang University. Her research focuses on the development of novel data analysis algorithms and bioinformatics tools for prediction of protein structure and function.
