


Abstract
The roles of proteolytic cleavage have been intensively investigated and discussed during the past two decades. This irreversible chemical process has been frequently reported to influence a number of crucial biological processes (BPs), such as cell cycle, protein regulation and inflammation. A number of advanced studies have been published aiming at deciphering the mechanisms of proteolytic cleavage. Given its significance and the large number of functionally enriched substrates targeted by specific proteases, many computational approaches have been established for accurate prediction of protease-specific substrates and their cleavage sites. Consequently, there is an urgent need to systematically assess the state-of-the-art computational approaches for protease-specific cleavage site prediction to further advance the existing methodologies and to improve the prediction performance. With this goal in mind, in this article, we carefully evaluated a total of 19 computational methods (including 8 scoring function-based methods and 11 machine learning-based methods) in terms of their underlying algorithm, calculated features, performance evaluation and software usability. Then, extensive independent tests were performed to assess the robustness and scalability of the reviewed methods using our carefully prepared independent test data sets with 3641 cleavage sites (specific to 10 proteases). The comparative experimental results demonstrate that PROSPERous is the most accurate generic method for predicting eight protease-specific cleavage sites, while GPS-CCD and LabCaS outperformed other predictors for calpain-specific cleavage sites. Based on our review, we then outlined some potential ways to improve the prediction performance and ease the computational burden by applying ensemble learning, deep learning, positive unlabeled learning and parallel and distributed computing techniques. We anticipate that our study will serve as a practical and useful guide for interested readers to further advance next-generation bioinformatics tools for protease-specific cleavage site prediction.
Introduction
Proteolysis, mediated by a variety of proteases, is a ubiquitous and irreversible biological process (BP) in cells, which breaks down proteins to peptides by cleaving the bonds between amino acids [1]. Moreover, proteases also play a major role in enzyme activation by releasing propeptides and targeting signals [2]. It has been increasingly recognised that proteolysis plays crucial roles in the cell cycle [3], cell death [4], pathway regulation [5, 6], protein degradation [7–9] and the inflammation response [10–13]. Dysregulated proteolysis is involved in a number of human diseases, especially in cancers [14–21]. To date, hundreds of proteases have been identified based on systematic profiling using mammalian tissues and samples [22, 23]. Many proteases are highly specific to substrates that have appropriate structural and sequence features [24–27]. Therefore, a better understanding of protease specificity not only contributes to our knowledge of proteolysis mechanisms but also benefits the computational characterisation of novel protease-specific cleavage sites. Current experimental techniques for characterising the substrate specificity of proteases mainly include the N-terminal peptide identification method [28], one- and two-dimensional gel-based methods [28] and high-throughput mass spectrometry [29], and a number of attempts have been made to explore the sequence and structural differences between cleavage and non-cleavage sites. Kazanov et al. [30] studied the structural preferences of cleavage sites by mapping 200 proteolytic events to the CutDB database [31]. The extracted cleavage sites were found to be more exposed than non-cleavage sites, and a considerable proportion of such cleavage sites were located in alpha-helices or beta-sheets, indicating substrate specificity at the secondary structure (SS) level. Previous studies show that at least for certain proteases (e.g. caspase-3 and GluC) [32, 33], there exists SS preference of the substrate specificity. Taken together, these findings suggest that, to better distinguish cleavage sites from non-cleavage sites, a wide range of features should be integrated to build reliable protease-specific computational models.
The success of experimental identification of protease cleavage sites has led to widespread availability of protease-specific cleavage repertoires. Among these online resources, MEROPS is a very valuable knowledge database containing detailed biological annotation of protease-specific cleavage sites collected from a huge amount of research literature and large-scale proteomic studies. Another database, named ‘Degradome’, contains the approximately 600 mammalian proteases discovered to date [22]. CutDB [31] is a well-established online portal for annotating proteolytic machinery and events. Given the advances of data curation, the past two decades have witnessed a proliferation of computational tools developed to accurately identify protease substrates and cleavage sites, thereby complementing and guiding experimental studies, which are usually time-consuming and labour intensive. We roughly categorised these approaches into two types according to their methodologies: (i) methods based on sequence-scoring functions, including PeptideCutter [34], PEPS [35], PoPS [36], GraBCas [37], CaSPredictor [38], SitePrediction [39], GPS-CCD [40] and CAT3 [41]; and (ii) methods based on machine learning techniques, including CASVM [42], PCSS [43], Pripper [44], Cascleave [45], CaMPDB [46], LabCaS [47], PROSPER [48], Cascleave 2.0 [49], ScreenCap3 [50], Transfer-learner [51], PROSPERous [52] and iProt-Sub [53]. Generally, approaches based on sequence-scoring functions are able to deliver the prediction outcomes promptly, while machine learning-based frameworks often achieve better prediction performance.
Given the growing number of studies on computational characterisation of protease-specific cleavage sites, several reviews have been published to investigate these methods, in terms of model development [54–56]. However, the limitations of these reviews are mainly 2-fold: (i) most of the existing reviews are relatively out-of-date as current state-of-the-art computational methods have not been covered and (ii) except for a most recent review, which exclusively focused on caspase cleavage site prediction [57], none of these reviews systematically evaluated the prediction performance of surveyed predictors for protease-specific cleavage site prediction. To overcome these issues, in this article, we provide a comprehensive survey of the most up-to-date progress of large-scale computational studies on protease-specific cleavage site prediction. In total, 19 computational methods published to date (including 8 scoring function-based methods and 11 machine learning-based methods) were critically assessed, systematically benchmarked and thoroughly discussed in terms of algorithm construction, heterogeneous features extracted, performance evaluation strategy and software utility. Most importantly, we performed extensive independent tests to objectively assess the prediction performance of reviewed computational approaches based on a newly constructed independent test data set with cleavage sites specific to 10 proteases. Based on our review, we then point out the limitations of current methods, followed by some suggestions to further improve the prediction performance. We anticipate that our review will aid future development of computational methods for efficient and accurate protease-specific cleavage site predictions.
Materials and Methods
Construction of independent test data sets
In order to evaluate the prediction performance objectively, we constructed an independent test data set minimising overlaps with the training data sets. Note that in this survey analysis, we are more interested in predicted cleavage sites in proteins (not synthetic substrates) and that predictive methods are mainly aimed at identifying substrates for endopeptidases and not exopeptidases or omega peptidases. The detailed procedures of constructing the independent test data sets are as follows. First, we extracted all the protease-specific protein substrates and their cleavage sites from the latest version of MEROPS database (release 12.0) [58]. It should be noted that we excluded synthetic substrates and peptidase derived from phage displays and the like. Subsequently, the CD-HIT program was employed to remove sequence redundancy with an identity threshold of 70% between any two protein sequences. We then removed all the sequences that existed in all versions of 9.9 and lower, which were used to train most of the reviewed predictors, including the recently published PROSPERous [52] and iProt-Sub [53] methods. As a result, the final independent test data set contains 2536 substrates and 3641 cleavage sites, specific to 10 proteases. These cleavage sites were used as positive samples, while the negative samples were set to be sites in substrate proteins, which are not known to function as cleavage sites. Consequently, the numbers of the negative samples and positive samples were highly imbalanced. To evaluate the existing methods using relatively balanced data sets, we randomly selected the same number of negative sites as there were positive samples. A statistical summary of the curated data sets in this study is shown in the supplementary file (Table S1 in the Supplementary file).
Existing approaches for protease cleavage site prediction
Table 1 summarises the two types of existing methods used to predict cleavage sites, covering a wide range of aspects, including algorithm employed, calculated features, evaluation strategy and software availability. Figure 1 visualises the methodologies of these two types of approaches to provide a better understanding of their implemented workflows.
A comprehensive list of the reviewed methods/tools for prediction of cleavage sites
| Method classification | Toola | Year | Software availability | Webserver availabilityb | Features | Scoring function/algorithmc | Evaluation strategy | Protease specificity |
|---|---|---|---|---|---|---|---|---|
| Scoring function-based | PeptideCutter [34] | 1999 | No | Yes | AAO | - | 38 proteases | |
| PEPS [35] | 2003 | Decommissioned | Decommissioned | CSSM | - | caspase-3; cathepsin-B; cathepsin-L | ||
| PoPS [36] | 2005 | Yes | Yes | PSSM, SS, SA, 'PEST' region | - | 36 proteases | ||
| GraBCas [37] | 2005 | Decommissioned | Decommissioned | PSSM | - | caspases 1-9; granzyme B | ||
| CaSPredictor [38] | 2005 | Decommissioned | Decommissioned | CCSearcher | - | caspases | ||
| SitePrediction [39] | 2009 | No | Yes | BSI | Independent test | calpains; caspases; cathepsins; lysins; MMPs | ||
| GPS-CCD [40] | 2011 | No | Yes | BSI | 4, 6, 8, 10-fold CV and leave-one-out | calpains | ||
| CAT3 [41] | 2012 | Yes | No | PSSM | 10-fold CV and independent test | caspase-3 | ||
| Machine learning-based | CASVM [42, 59] | 2007 | Decommissioned | Decommissioned | Binary | SVM | 10-fold CV and independent test | caspases |
| PCSS [43] | 2010 | No | Yes | Binary, AAF, SS, PSS | SVM | leave-one-out | caspases; granzyme B | |
| Pripper [44] | 2010 | Yes | No | Binary, SP | SVM, RF, C4.5 | leave-one-out | caspases | |
| Cascleave [45] | 2010 | No | Yes | Binary, SP, PSA, BPB, PSS | SVR | 5-fold CV and independent test | caspases | |
| CaMPDB [46] | 2011 | No | Yes | Binary, PSS, PSA | SVM | 10-fold CV | calpains | |
| PROSPER [48] | 2012 | No | Yes | Binary, SP, PSS, PSA, PND | SVR | 5-fold CV and independent test | 24 proteases | |
| LabCaS [47] | 2013 | No | Yes | AAF, PSA, BSI, PSS | CRF | leave-one-out | calpains | |
| Cascleave 2.0 [49] | 2014 | Decommissioned | Decommissioned | Binary, PND, AAP, PFF, PP, PSA, PSSM, RCS | SVR | 5-fold CV and independent test | caspases; granzyme B | |
| ScreenCap3 [50] | 2014 | No | Yes | Binary, PSSM | SVM | 5-fold CV and independent test | caspase-3 | |
| PROSPERous [52] | 2017 | No | Yes | NNS, AAF, WLS, BSI | LR | 5-fold CV and independent test | 90 proteases | |
| iProt-Sub [53] | 2018 | No | Yes | Binary, CKSAAP, PSSM, BSI, KNN, PP, PSS, PSA | SVR | 5-fold CV and independent test | 38 proteases |
aThe URL addresses for the listed tools are as follows:
PeptideCutter, http://web.expasy.org/peptide_cutter/;
SitePrediction, http://www.dmbr.ugent.be/prx/bioit2-public/SitePrediction/;
Pripper, http://users.utu.fi/mijopi/Pripper/;
GPS-CCD, http://ccd.biocuckoo.org/;
PROSPER, https://prosper.erc.monash.edu.au;
Cascleave 2.0, http://www.structbioinfor.org/cascleave2/index.html;
ScreenCap3, http://scap.cbrc.jp/ScreenCap3/index.php;
PROSPERous, http://prosperous.erc.monash.edu/;
iProt-Sub, http://iProt-Sub.erc.monash.edu.au/.
bYes: The publication is accompanied with a webserver/tool and it is still functional; Decommissioned: The webserver/tool is no longer available; No: The publication has no webserver or tool.
cAbbreviations: AAO, amino acid occurrence; CSSM, cleavage site scoring matrices; PSSM, position-specific scoring matrices; CCSearcher, caspase cleavage site searcher; BSI, BLOSUM62 substitution index; CV, cross validation; MMPs, matrix metallopeptidases; Binary, binary features; SVM, support vector machine; AAF, amino acid frequency; SS, secondary structure; PSS, predicted secondary structure; SP, sequence profile; RF, Random Forest; PSA, predicted solvent accessibility; BPB, bi-profile Bayesian signatures; SVR, support vector regression; CRF, conditional random fields; PND, predicted natively disorder; AAP, amino acid properties; PFF, protein functional features; PP, physicochemical properties; RCS, residue conservation score; NNS, nearest neighbour similarity; WLS, WebLogo-based sequence conservation; LR, logistic regression; CKSAAP, composition of k-spaced amino acid pairs; KNN, k-nearest neighbours features.
Scoring function-based methods are built based on the assumption that similar sequences share similar biological functions [34]. The scoring function-based methods are constructed using a data set of experimentally verified cleavage sites. These methods perform cleavage site prediction by measuring sequence similarities between the query segment/protein and all the segments/proteins with known cleavage sites, using different sequence scoring functions. The calculated similarity scores are subsequently ranked, and the predicted cleavage site will be one of the segment/protein most similar to the query segment/sequence.
To construct a reliable and accurate predictive model for machine learning-based methods, well-assembled training data sets and appropriate selection of the core algorithm are required. In general, four main steps need to be considered to train a machine learning-based cleavage site prediction model: (i) construction of training data sets containing well-curated experimental cleavage sites, (ii) feature encoding using protein sequences from the training set, (iii) machine learning model selection and construction and (iv) model evaluation and performance optimisation.
According to the nomenclature of protease substrate specificity proposed in [59], amino acid residues in the substrate sequence are numbered as ‘…-P4-P3-P2-P1-P1|$ ^{\prime} $|-P2|$ ^{\prime} $|-P3|$ ^{\prime} $|-P4|$ ^{\prime} $|-…’, where the cleavage site is located between the P1 and P1|$ ^{\prime} $| positions.
Scoring function-based approaches
These methods differ in the employed sequence scoring functions. Among these methods, PeptideCutter [34] is the most straightforward and simplest tool for cleavage site prediction, which is in this case solely based on the occurrence of amino acids of consensus cleavage sites in the sequences. Except for PeptideCutter, all other methods listed in Table 1 employ more sophisticated statistics to determine potential cleavage sites at the corresponding positions.
PEPS [35] uses individual rule-based endopeptidase Cleavage Site Scoring Matrices (CSSMs) for predicting caspase-3 cleavage sites. In [35], a CSSM was constructed based on the theory that a cleavage position with high amino acid variability should receive a lower score, thus indicating the sequence conservation of cleavage site. The position-specific score for an amino acid |$A$| is defined as |$\textrm{Score}={f}_{A,i}/{n}_{dif \, A}$|, where |${f}_{A,i}$| is the observed relative frequency of amino acid |$A$|(|$\,{f}_{A,i}={n}_{A,i}/N$|, where |${n}_{A,i}$| is the observed incidence of amino acid A at position i; and N is the number of input sequences), while |${n}_{difA}$| is the number of variable amino acids occur at position i.
PoPS [36] applies a ‘specificity profile’ to each position in the cleavage region, which assigns a value to each individual amino acid. The value represents the relative contribution of the amino acid at the specific position to the overall substrate specificity of the protease. The ‘specificity profile’ is represented by a |$20\times N$| position-specific scoring matrices (PSSM), each entry |${p}_{i,j}$| illustrates the relative contribution of amino acid i to position j, while N is the length of ‘sequence profile’ (SP). In addition, PoPS also assigns a weight vector |$\left({w}_1,\dots, {w}_N\right)$| to represent the weights of each position in the cleavage region. For a sequence segment SS with N amino acids, let |${A}_k$| and |${A}_{k+1}\ \left(1\le k\le N-1\right)$| represent the P1 and P1|$ ^{\prime} $|, respectively, then the cleavage probability score at position |${A}_k,{A}_{k+1}$| is calculated as |${\Sigma}_i^N{w}_i{p}_{i,{A}_i}$|. The higher the score is, the more favourable the cleavage.
where |${Score}_{\textrm{P}4}\left({\textrm{A}}_4\right)$|, |${Score}_{\textrm{P}3}\left({\textrm{A}}_3\right)$| and |${Score}_{\textrm{P}2}\left({\textrm{A}}_2\right)$| denote the corresponding matrix entries of |${\textrm{A}}_4$| at P4, |${\textrm{A}}_3$| at P3 and |${\textrm{A}}_2$| at P2, respectively.
Similar to CaSPredictor, SitePrediction [39] adopts the BLOSUM 62 matrix to calculate the similarity between the potential cleavage sites and the known cleavage sites. Some extra features were also integrated into SitePrediction, such as PEST sequence occurrence, solvent accessibility and SS prediction information.
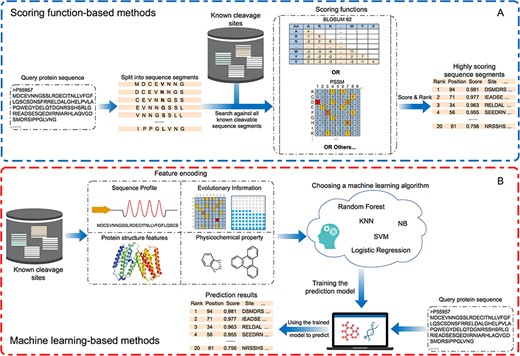
Flow charts of (A) scoring function-based methods and (B) machine learning-based methods. For each type of method, the key steps are summarised and visualised. Scoring function-based methods predict potential cleavage sites. The statistical scoring functions are based on the sequence alignments containing known cleavable sequence segments. Machine learning-based methods generate the prediction outcomes using trained models based on a variety of heterogeneous features.
Machine learning-based approaches
Sequence scoring function-based methods are fairly straightforward due to the fact that they usually employ simplified statistical methods based on a variety of scoring functions, such as sequence similarity, sequence patterns and PSSMs. However, such functions generally do not perform well for cleavage site prediction. Compared to scoring function methods, machine learning-based methods generally achieve superior prediction performance, as a result of using more sophisticated algorithms and calculating descriptive sequences and structural features. Among the machine learning-based approaches, support vector machine (SVM) and support vector regression (SVR) are the most widely applied machine learning algorithms (Table 1). In the rest of this section, we introduce these and more machine learning techniques employed in protein cleavage site prediction, together with their usage in the corresponding approaches.
Sequence-based features
Machine learning-based methods usually need to calculate sequence/sequence-based features for model training. A variety of sequence features and sequence-based features have been used in the reviewed cleavage site prediction methods, including binary features, sequence features (AAF, SP, amino acid properties, composition of k-spaced amino acid pairs, among others), PSSMs, predicted structural features (PSS, predicted solvent accessibility (PSA), predicted disorder, among others), protein functional features and physicochemical properties. Note that the majority of these features can be calculated and extracted using the recently developed iFeature toolkit [63].
Binary features are among the most widely used feature types in machine learning-based methods. Eight such methods include CASVM, PCSS, Pripper, Cascleave, CaMPDB, PROSPER, Cascleave 2.0, ScreenCap3 and iProt-Sub, which were built incorporating binary features. PSS is another frequently used feature, which was used in six methods, including PCSS, Cascleave, CaMPDB, PROSPER, LabCaS and iProt-Sub. PSA is another feature encoding scheme for the cleavage substrate sequences, and has been used in Cascleave, CaMPDB, PROSPER, LabCaS, Cascleave 2.0 and iProt-Sub.
Feature selection methods
From the reviewed methods shown in Table 1, one can observe that the number of features employed for model training has increased in time and with it are the feature sets’ dimensionalities. Further, the initial feature sets usually contained redundant and noisy features. For this reason, three methods (PROSPER, Cascleave 2.0 and iProt-Sub) applied feature selection algorithms to characterise feature importance and subsequently used the optimal feature sets for training the ultimate machine learning models. In this section, we will briefly discuss the feature selection strategies used by these three methods.
The initial feature sets of Cascleave 2.0 and iProt-Sub both contain over 4000 features. However, and generally, machine learning algorithms cannot learn a high-quality prediction model from such a high-dimensional feature set. These two methods therefore applied a two-step feature selection strategy, which combined the minimum Redundancy Maximum Relevance (mRMR) algorithm [64] with forward feature selection (FFS), to evaluate feature importance. The 1st step of this strategy is to use the mRMR algorithm to rank all the features in the initial feature set, according to the redundancy of the features and relevance to class labels. Then, both Cascleave 2.0 and iProt-Sub used the top 100 features as the optimal feature candidates (OFCs). The 2nd step is to use the FFS algorithm to select the final optimal feature set. FFS adds 100 feature subsets by adding one feature from OFCs. This process continues until no more features can be added to improve the prediction performance.
Support vector machine
Among the machine learning-based approaches listed in Table 1, CASVM [42, 60] and CaMPDB [46] employed SVM as their core algorithm. CASVM is the 1st SVM-based method using RBF kernel and integrating the binary-encoding features for the cleavage site prediction. Another SVM-based method, CaMPDB [46], was built using a multiple kernel learning strategy and combining the binary features and the Calpain cleavage prediction. In addition, SVM is one of the core algorithms in Pripper [44], together with RF, and C4.5. Pripper uses the RFB kernel as the core kernel of the SVM. The benchmarking test showed that the SVM model of Pripper outperformed the RF and C4.5 models, in terms of prediction accuracy.
Support vector regression
C4.5
Random forest
Conditional random fields
where K is the number of class labels; K = 2 for two-class classification. |${\lambda}_k$| is the weight vector of features, and |${f}_k$| is the function of features for |$\left\{{y}_i,{y}_{i-1},{x}_i\right\}$|.
Logistic regression
Webserver/Software functionality
Two types of computational products, including online server and local executables, are usually available along with each method publication, thereby facilitating high-throughput prediction. Based on our survey, most predictors for cleavage site prediction have been made publicly available in form of a webserver. These include PeptideCutter, PoPS, SitePrediction, PCSS, Cascleave, CaMPDB, LabCaS, PROSPER, ScreenCap 3 and iProt-Sub. It is also worth noting that the webservers of some predictors in Table 1 have been discontinued or decommissioned.
On the webservers for protease-specific cleavage site prediction, users generally need to select the protease of interest and provide the protein sequence(s). When providing the protein sequences for prediction, the servers of PoPS, PCSS, Pripper, SitePrediction, GPS-CCD, LabCaS, PROSPERous and iProt-Sub enable users to upload a file with multiple protein sequences in FASTA format. It is worth noting that GPS-CCD, LabCaS, PROSPERous and iProt-Sub have limitations to the maximum number of sequences allowed (i.e. ≤2000 sequences for GPS-CCD, ≤3 sequences for LabCaS, ≤1000 sequences for PROSPERous and ≤50 sequences for iProt-Sub). On the other hand, other tools such as PeptideCutter, Cascleave, CaMPDB, PROSPER and ScreenCap 3 can only process one protein sequence in FASTA format at a time and a submission of multiple sequences is prohibited. Another important point to note is the selection of the specific protease, given the fact that most of the predictors were built using the data set of cleavage sites regulated by the specific proteases (Table 1). Specially, PoPS and PCSS allow users to build new models based on their provided data sets, which is a customisable and useful function, especially for non-expert users.
A well-designed output format is important for users to easily interpret the prediction results. Among the surveyed predictors with available webservers, PoPS, SitePrediction, PCSS, Cascleave, CaMPDB, PROSPER and iProt-Sub send notification emails and prediction results to users with job IDs, which is convenient for users and allows revisits to the prediction results in the future. Most available servers display the prediction results on their webpages. While most tools show the results in plain text, PROSPER, LabCaS, SitePrediction and iProt-Sub use a residue score distribution figure to visualise the prediction results, enhancing the interpretability. Besides, the possibility to download prediction results strengthens the usability of the webservers. SitePrediction and LabCaS allow users to download their prediction results in text format; while PROSPERous allows users to download results in CSV, Excel and PDF, facilitating further investigation and easy comparison of prediction results.
Computational works including PoPS, Pripper and GPS-CCD also have provided locally runnable software, for biologists and interested users to run on their local machines. The detailed instructions of these tools, with detailed descriptions of corresponding installation procedure, dependencies and processes of prediction, are also available.
Performance evaluation measurements and strategies
Based on our review (Table 1), k-fold cross validation (CV) and independent testing are two widely applied strategies for prediction performance assessment. In k-fold CV, the data set is randomly split into k equally sized subsets, |${D}_1,{D}_2,\dots, {D}_k$|. Each of the subsets is used once to evaluate the trained model while the remaining subsets have been combined to train the model. Therefore, the training and testing procedure is conducted k times and average performance of the k times is usually reported. For independent test, an independent test data set is usually assembled ensuring that there is no overlap with the training data set. The independent test is therefore an effective and objective way to assess the robustness and scalability of constructed models.
The prediction performance of most of the reviewed methods was evaluated by both k-fold cross-validation and independent tests, including CAT3, CASVM, Cascleave, PROSPER, Cascleave 2.0, ScreenCap3, PROSPERous and iProt-Sub. The performance of GPS-CCD was evaluated by 4-, 6-, 8-, 10-fold CV and the leave-one-out CV test (a special case of k-fold CV, where k is set to the number of samples in the data set, and only one sample is used as the test set at a time). However, SitePrediction only performed an independent test for performance evaluation, and CaMPDB only performed 10-fold CV to evaluate prediction performance. Also, the performance of PCSS, Pripper and LabCaS was only evaluated by leave-one-out CV test.
Enrichment analysis on Gene Ontology terms
Results and Discussion
Conservation analysis of motifs with protease-specific cleavage sites
Based on an independent test data set, we analysed the distribution of amino acid preferences surrounding the cleavage sites of 10 proteases. The sequence logos resulting from using pLogo [80] are provided in Figure 2. It is obvious that for both caspases (caspase-1, -3 and -6) and granzyme B (human and mouse), Asp is always the cleavage site residue at the P1 position. However, a closer look revealed that there are subtle differences between the cleavage sites of these proteases, with caspase-6 and granzyme B (human) having complex amino acid preferences at surrounding positions. For instance, caspase-6 requires Glu residue at the P3 position, and Ala, Ser, Gly at the P1|$ ^{\prime} $| position. The substrate cleavage site of thrombin exhibits Arg at the P1 position, while in contrast to caspases and granzyme B, matrix metallopeptidases and calpains have distinctive amino acid preferences (Figure 2GHIJ). For calpains, LXSXPP and LXAXPP are the common patterns observed at positions P2 to P4|$ ^{\prime} $|.
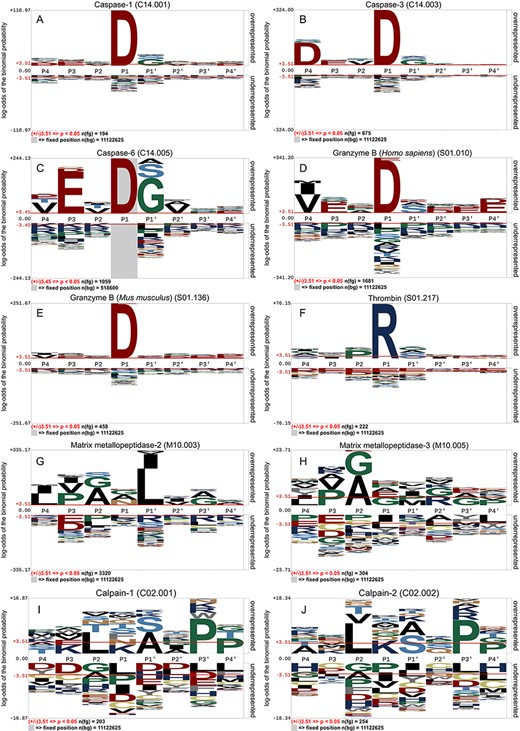
Residue specificity and enrichment of sequons of 10 protease-specific substrates, including (A) caspase-1, (B) caspase-3, (C) caspase-6, (D) granzyme B (Homo sapiens), (E) granzyme B (Mus musculus), (F) thrombin, (G) matrix metallopeptidase-2, (H) matrix metallopeptidase-3, (I) calpain-1 and ( J) calpain-2.
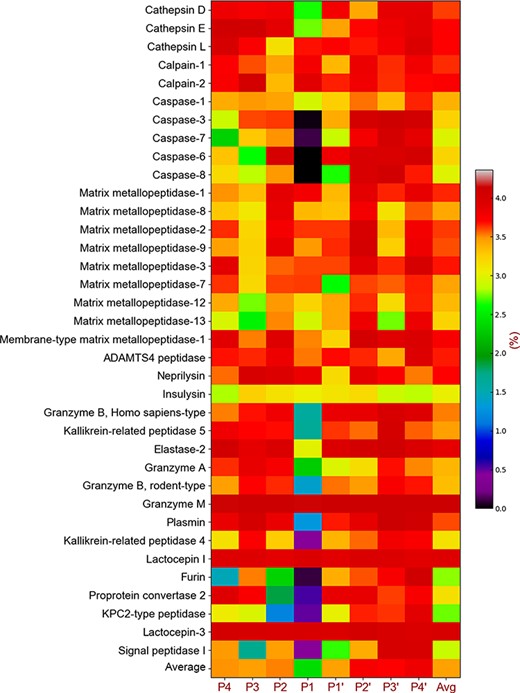
Cleavage entropy heatmap of 36 proteases.
Motif-based analysis of sequence preferences around different types of protease substrate cleavage sites
Previous studies [81] have shown that the cleavage entropy of proteins is an effective quantitative measure of their conservation. Cleavage entropy is calculated by counting the frequency of amino acids at a specific position on a specific protein sequence data set and, the smaller the entropy value, the stronger the conservation of the amino acids at this position. To better understand the conservation of the motif flanking a cleavage site, we calculated the cleavage entropy of 38 proteases using a motif with eight amino acids (P4-P4|$ ^{\prime} $|). As shown in Figure 3 and Table S2 in the Supplementary file (apart from the last column and the last row in the files), each row represents the entropy value of a specific protease cleavage site from the upstream P4 to the downstream P4|$ ^{\prime} $| positions. The column ‘Avg’ represents the average of the eight entropy values, and the last line (i.e. the row ‘Overall’) in the heatmap denotes the average entropy of the 38 protease cleavage sites. In general, the cleavage entropy of different protease substrates varies greatly. Some proteases show strong conservation (e.g. caspase-3, caspase-7, caspase-6and caspase-8). On the other hand, the motifs contained in the cleavage sites of some proteases are non-conserved (e.g. cathepsin L, calpain-1, calpain-2, neprilysin, granzyme M, lactocepin I and lactocepin-3). In addition, the same protease catalytic type shares similar degrees of sequence conservation. For the cysteine and most of serine protease catalytic types, the P1 locus was highly conserved, while the conservation of the aspartic and MMP catalytic types, to a lesser extent, was mainly reflected in the P3 locus.
Performance assessment of different tools based on the independent test data sets
We used the independent test data sets generated in this study to conduct a performance comparison among the predictors listed in Table 1. We do note that, because of the limited availability of the training data sets for the prediction methods in Table 1, it is challenging to ensure that our independent testing data sets have no overlap with their training data sets. In addition, some predictors regularly update their models using more up-to-date data sets. Despite these difficulties, we assembled the independent test data sets by removing all the cleavage sites from earlier versions of the MEROP database, thereby minimising the overlap between our data sets and the training data sets of compared predictors. We then submitted the protein sequences in FASTA format from our independent test data sets to the webservers/local tools of methods listed in Table 1 to obtain corresponding prediction results. In terms of parameter configuration, we adopted recommended parameters following the instructions in the publication associated with each method or left them at default values if no instructions were available. To present the evaluation results, we plotted Receiver Operating Characteristic (ROC) curves and reported AUC values for each method, as shown in Figure 4 and Figure S1 and Table S3 in the Supplementary file.
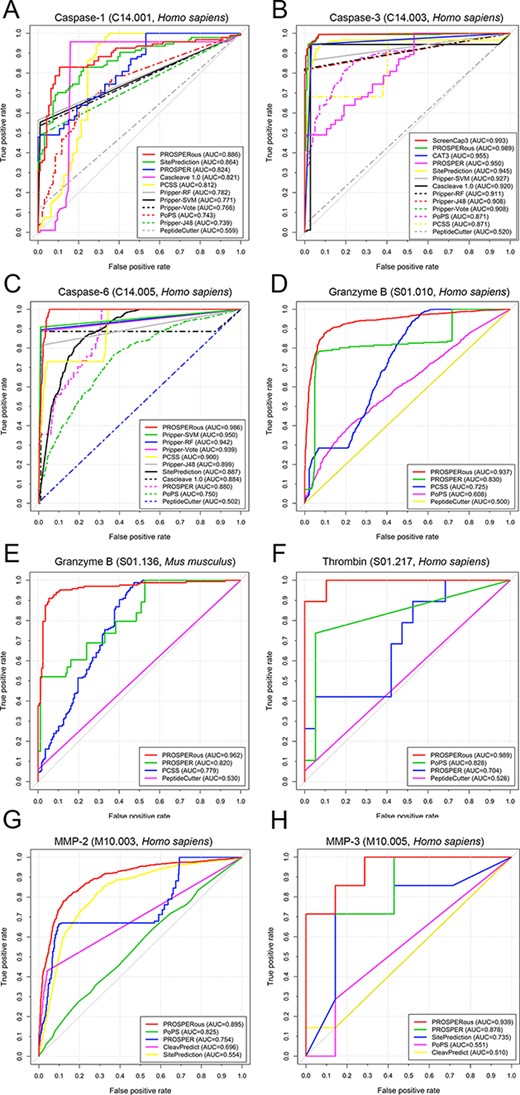
ROC curves and the corresponding AUC values of reviewed predictors for cleavage site prediction specific to (A) caspase-1, (B) caspase-3, (C) caspase-6, (D) granzyme B (Homo sapiens), (E) granzyme B (Mus musculus), (F) thrombin, (G) matrix metallopeptidase-2 and (H) matrix metallopeptidase-3.
Among all the proteases, machine learning-based methods in general achieved better prediction performance than sequence scoring function-based methods. However, we did not find one best predictor for all the proteases. Among the machine learning-based predictors, PROSPERous performed best for cleavage sites of seven proteases, i.e. caspase-1, caspase-6, granzyme B (Homo sapiens), granzyme B (Mus musculus), thrombin, MMP-2 and MMP-3. We assume that one reason why PROSPERous performed best is because it was developed using newer, more comprehensive data sets, which covered a substantially larger set of experimental verified cleavage sites than previous methods. Moreover, PROSPERous is based on a two-level prediction framework, in which the 1st level is the sequence-scoring function while the 2nd level is the LR model. This robust two-level prediction system resulted in PROSPERous’ improved predictive power.
From the scoring function based methods, SitePrediction achieved the overall best performance for proteases caspase-1, caspase-6 and MMP-3. It is worth mentioning that some predictors have achieved outstanding prediction performances for the cleavage sites specific to the proteases they were particularly designed for. For instance, the two methods designed specifically to predict cleavage sites of caspase-3 are ScreenCap 3 and CAT3: ScreenCap3 outperformed all the other machine learning and scoring function based methods (AUC = 0.993; Figure 4B), while CAT3 was the best scoring function-based method (AUC = 0.955; Figure 4B). Similarly, for calpain-1 and calpain-2 specific approaches, GPS-CCD and LabCaS outperformed all the other tools for calpain cleavage site prediction (refer to Figure S1 in the Supplementary file). In terms of the selected machine learning algorithms, our results indicate that SVM and SVR are the most powerful algorithms based on the ROCs. The hybrid machine learning-based and caspase-specific approach, Pripper, integrates four different classification algorithms, including J48 [65], RF, SVM and Vote [82]. Based on Figure 4, SVM (Pripper-SVM) achieved best performance for caspase-3 and caspase-6; while for caspase-1, Pripper-RF outperformed the other three algorithms. This suggests that there is no universal machine learning algorithm suitable for all proteases. The algorithm selection is therefore at the designers’ discretion and should be tested extensively prior to the final model construction. Additionally, the performance comparison among existing methods clearly demonstrates that the accuracy of protease-specific cleavage site prediction varies between different proteases. Based on the independent tests, the cleavage sites regulated by MMP-2, MMP-3, calpain-1, calpain-2 and thrombin are most difficult to predict, posing a challenge to the research community. Almost all the tested methods achieved relatively unsatisfactory prediction performances for these proteases. In comparison, the prediction performance for caspases and granzyme B is better. These conclusions are consistent with previously published studies [46, 48, 51–53] for protease-specific cleavage site prediction.
Improvement of prediction performance and outlook
Despite outstanding progress in computational studies and tools for cleavage site prediction, we believe there is still wide room for further improvement, especially in terms of algorithm learning strategies and prediction performance. To this effect, we provide several insights and suggestions.
Our 1st suggestion is to employ ensemble learning techniques in protease-specific cleavage site prediction. Ensemble methods, first introduced in [83], have been massively applied in algorithm development and ‘real-world’/bioinformatics applications [84–89]. The past three decades have witnessed the power of ensemble methods in significantly improving the prediction performance. For this reason, ensemble methods have become the ‘method-of-choice’ for performance improvement. To date, a variety of ensemble techniques have been developed, but the basic principle remains the same: the final prediction output for a test sample is determined jointly by all the algorithms generated in the ensemble committee. For example, the ‘majority voting’ is the most straightforward ensemble strategy, where the final prediction output for a test sample is determined by the class that obtains the most votes [84]. By applying the ensemble techniques, not only can performance can be improved but, other common issues, such as overfitting, can also be significantly reduced [90]. In addition, ensemble techniques can help improve the robustness and scalability of developed algorithms when testing with other independent test data sets [91].
Deep learning [92] is another promising technique for further improving the prediction performance of cleavage site prediction by generating internal feature representations of the cleavage sites, from protein sequences, within the hidden layers. To date, deep learning algorithms have been applied to a variety of bioinformatics applications, such as drug target interaction prediction [93], protein subcellular localisation prediction [94], phosphorylation sites prediction [95], protein solubility prediction [96] and protein homology detection [97]. Some representative deep learning techniques involved in these studies include Deep Neural Networks [98], Deep Belief Networks [99], Long Short-Term Memory [100] and Convolutional Neural Networks [92]. Compared to the conventional artificial neural networks, deep learning techniques have overcome some key issues, such as overfitting and slow convergence [92]. Current machine learning studies have demonstrated that deep learning algorithms achieved competitive prediction results when compared with other state-of-the-art machine learning algorithms, such as SVM and RF. In spite of the time-consuming training process, the classification process of deep learning is generally faster than traditional machine learning-based methods, as deep learning techniques do not need to extract features from protein sequences or convert them to feature vectors for prediction. Thus, deep learning techniques are attractive and especially suitable for high-throughput prediction tasks and competitive prediction performance.
Other than supervised data mining techniques, such as deep learning techniques aforementioned, semi-supervised methods have also been applied in bioinformatics applications, because of the limited data availability and/or the reliability of sample labelling. One of the semi-supervised techniques, named Positive and Unlabelled (PU) learning, has attracted significant attention recently and has been readily used in disease gene identification [101], kinase substrate prediction [102], glycosylation sites prediction [103] and drug interactions inferring [104]. PU learning is a machine learning scheme that distinguishes itself from others due to its strong ability to learn from only PU data [105, 106]. As such, PU learning only requires some high-quality positive samples and a number of unlabelled data to build reliable predictive models, which is a significant advantage in many areas, such as protein posttranslational modification prediction, drug-target interaction prediction and cleavage site prediction, whereby some negative samples might be falsely labelled because of the limitations of experimental techniques. Taking cleavage site prediction as an example, most of machine learning-based studies built their predictive models using the experimentally verified cleavage sites (i.e. positive samples) and non-cleavage sites (i.e. negative samples). However, some negative samples (i.e. the non-cleavage sites) might be incorrectly labelled and are subject to updates with advanced experimental techniques. Built on such data sets, the predictive models would be problematic and unreliable, and the performance of the models would be impacted, while PU learning can obviously avoid such problems.
Regarding feature selection techniques, in addition to the ones introduced in Feature selection methods section, additional novel feature selection techniques have been published. These, such as F-score and binominal distribution based feature selection techniques [107, 108], may greatly help improve the prediction performance. It is therefore suggested that users should apply different feature selection approaches in order to determine the optimal feature set prior to model construction.
Last but not least, because of the advances of high-throughput sequencing [109, 110], the fast accumulation of biological data has become a significant computational burden, which could exceed the process capacity of local machines. The same issue also applies to the data accumulation of protein cleavage sites. Cloud computing techniques have been frequently applied to deal with such ‘Big Data’ problems, and commonly used solutions are distributed and parallel computing techniques, including Hadoop [111–113], MapReduce [114] and Spark [115, 116]. We anticipate that by applying these techniques and frameworks, the large-scale prediction of a variety of biological data, including protein cleavage site prediction, can be facilitated in the future.
Conclusion
Proteolysis is an important and irreversible post-translational modification and plays important roles in many physiological processes. Accurate prediction of protease-specific cleavage sites can short-list reliable candidates for experimental validation, in order to better understand the functions and mechanisms of proteolysis. Given the wide availability of experimentally verified protease-specific cleavage sites, a number of computational methods (including machine learning-based methods and sequence scoring function-based methods) have been developed during the past two decades. Based on the significant achievement in this area, in this article, we revisited and evaluated 19 state-of-the-art computational approaches for predicting protease-specific cleavage substrates and sites. We summarised a wide range of aspects in detail, including methodology, algorithm, calculated features, evaluation strategy and software usability. Using our independent testing data sets, we performed extensive benchmarking evaluation and demonstrated that machine learning-based methods generally outperform sequence scoring function-based methods for predicting cleavage sites specific to all ten types of proteases. Among the evaluated 14 machine learning-based methods, PROSPERous is the most accurate generic tool for predicting cleavage sites of eight proteases while GPS-CCD and LabCaS achieved overall best performance for predicting calpain-specific cleavage sites. Following the independent tests, we provided some insights into further performance improvement, including applications of ensemble learning, deep learning and positive unlabelled learning techniques. We also suggested several computational frameworks for parallel and distributed computing, with the goal of tackling fast-accumulating data of protease-specific cleavage sites. We believe this review, together with our suggestions, will inform and guide future developments of computational methods for protease-specific cleavage site prediction, in turn advancing our understanding of biological functions and mechanisms of proteolysis.
We provide a comprehensive survey of 19 computational methods (including 8 scoring function-based and 11 machine learning-based methods) developed for predicting protease-specific substrates and cleavage sites in the past two decades. Our survey analyzes these 19 computational methods in terms of underlying algorithms, extracted heterogeneous features, predictive capability, high-throughput capacity and practical utility.
Based on the cleavage entropy measure, we delineate the substrate specificity profiles of 36 different proteases with >50 experimentally validated substrate cleavage sites and provide functional insights into the specificity of these proteases.
We perform comprehensive independent tests to assess the performance of existing tools for predicting protease-specific cleavage sites across 10 different proteases, using up-to-date independent data sets.
Extensive independent tests show that PROSPERous is the most accurate generic tool for predicting cleavage sites of multiple proteases; on the other hand, GPS-CCD and LabCaS achieved an overall best performance for predicting calpain cleavage sites.
This review will serve as a practically useful guide for interested readers to develop next-generation bioinformatics tools for protease-specific cleavage site prediction.
Funding
This work was supported by grants from the National Health and Medical Research Council of Australia (NHMRC; 1092262), the Australian Research Council (ARC; LP110200333 and DP120104460), the National Institute of Allergy and Infectious Diseases of the National Institutes of Health (R01 AI111965), a Major Inter-Disciplinary Research (IDR) project awarded by Monash University, the Collaborative Research Program of Institute for Chemical Research, Kyoto University (2018-28), NHMRC CJ Martin Early Career Research Fellowship (1143366 to C.L.), ARC Discovery Outstanding Research Award (DORA; to G.I.W) and partially (for T.T.M.L. and A.L.) by the Informatics Institute of the School of Medicine at University of Alabama at Birmingham.
Fuyi Li received his BEng and DEng degrees in Software Engineering from Northwest A&F University, China. He is currently a PhD candidate in the Department of Biochemistry and Molecular Biology and the Infection and Immunity Program, Biomedicine Discovery Institute, Monash University, Australia. His research interests are bioinformatics, computational biology, machine learning and data mining.
Yanan Wang received his MEng degree from Shanghai Jiao Tong University, China. He will commence his PhD study in microbial bioinformatics, later in 2018, in the Biomedicine Discovery Institute, Monash University. His research interests are bioinformatics, machine learning, data mining and pattern recognition.
Chen Li received his PhD degree in Bioinformatics from Monash University, Australia. He is currently an NHMRC CJ Martin Early Career Research Fellow at the Institute of Molecular Systems Biology, ETH Zürich, Switzerland, and the Monash Biomedicine Discovery Institute, Monash University, Australia. His research interests include systems immunology, proteomics, immunopeptidomics, bioinformatics and data mining.
Tatiana T. Marquez-Lago is an associate professor in the Department of Genetics and the Department of Cell, Developmental and Integrative Biology, University of Alabama at Birmingham School of Medicine, USA. Her research interests include multiscale modelling and simulations, artificial intelligence, bioengineering and systems biomedicine. Her interdisciplinary laboratory studies stochastic gene expression, chromatin organisation, antibiotic resistance in bacteria and host-microbiota interactions in complex diseases.
André Leier is currently an assistant professor in the Department of Genetics, University of Alabama at Birmingham School of Medicine, USA. He is also an associate scientist in the UAB Comprehensive Cancer Center. He received his PhD in Computer Science (Dr. rer. nat.), University of Dortmund, Germany. He conducted postdoctoral research at Memorial University of Newfoundland, Canada, The University of Queensland, Australia and ETH Zürich, Switzerland. His research interests are in biomedical informatics and computational and systems biomedicine.
Neil D. Rawlings received his bachelor degree in Biological Sciences from Aston University, Birmingham, UK and his PhD from the Open University, Milton Keynes, UK. Since 1996, he and Alan J. Barrett have been the originators, developers and curators of the MEROPS database for proteolytic enzymes, their inhibitors and substrates, with the goal to provide the globally accepted classification of proteolytic enzymes and their inhibitors. He is one of the editors of the Handbook of Proteolytic Enzymes (Elsevier, 2013) and is currently a curator for the InterPro database at the European Bioinformatics Institute, Cambridge, UK.
Gholamreza Haffari received his PhD in Computer Science in 2010 from Simon Fraser University, Canada. He is a senior lecturer in the Faculty of Information Technology, Monash University. His research interests are natural language processing, machine learning and bioinformatics.
Jerico Revote received his bachelor degree in Computer Science from RMIT University, Melbourne, Australia. He is working as a research engineer in the Monash eResearch Centre at Monash University, Australia. He is also currently a part-time PhD student in the Department of Biochemistry and Molecular Biology and Biomedicine Discovery Institute, Monash University. His research interests are machine learning, data mining, artificial intelligence, software development and scalable applications.
Tatsuya Akutsu received his DEng degree in Information Engineering in 1989 from University of Tokyo, Japan. Since 2001, he has been a professor in the Bioinformatics Center, Institute for Chemical Research, Kyoto University, Japan. His research interests include bioinformatics and discrete algorithms.
Kuo-Chen Chou received his D.Sc. degree in 1984 from Kyoto University, Japan. He is the founder and chief scientist of Gordon Life Science Institute. He is also a Distinguished High Impact Professor and advisory professor of several universities. His research interests are computational biology and biomedicine, protein structure prediction, low-frequency internal motion of protein/DNA molecules and its biological functions, diffusion-controlled reactions of enzymes, as well as graphic rules in enzyme kinetics and other biological systems.
Anthony W. Purcell is a professor in the Biomedicine Discovery Institute and Department of Biochemistry and Molecular Biology, Monash University, Australia. He specialises in targeted and global quantitative proteomics of complex biological samples, with a specific focus on identifying targets of the immune response and host-pathogen interactions.
Robert N. Pike obtained his PhD in Biochemistry from the University of Natal in South Africa in 1991. He conducted post-doctoral fellowship work at the University of Georgia, USA, and the University of Cambridge, UK. He is currently the director of La Trobe Institute of Molecular Science and the Head of School of Molecular Science, La Trobe University, Australia. His research focuses on the study of enzymes involved in innate immunity and host defense against bacteria and other pathogens. He is also strongly interested in the enzymes used by pathogens to attack the host.
Geoffrey I. Webb received his PhD degree in 1987 from La Trobe University. He is the director of the Monash Centre for Data Science and Professor in Faculty of Information Technology at Monash University, Australia. He is a leading data scientist and has been the Program Committee Chair of two leading data mining conferences, ACM SIGKDD and IEEE ICDM. His research interests include machine learning, data mining, computational biology and user modelling.
A. Ian Smith completed his PhD at Prince Henrys Institute Melbourne and Monash University, Australia. He is currently the Vice-Provost (Research & Research Infrastructure) at Monash University. He is also a Professorial Fellow in the Department of Biochemistry and Molecular Biology at Monash University, where he runs his research group. His research applies proteomic technologies to study the proteases involved in the generation and metabolism of peptide regulators involved in both brain and cardiovascular function.
Trevor Lithgow received his PhD degree in 1992 from La Trobe University, Australia. He is an ARC Australian Laureate Fellow (FL130100038) in the Biomedicine Discovery Institute and the Department of Microbiology at Monash University, Australia. His research interests particularly focus on molecular biology, cellular microbiology and bioinformatics. His laboratory develops and deploys multidisciplinary approaches to identify new protein transport machines in bacteria, understand the assembly of protein transport machines, and their role in secretion of hydrolases, including proteases, as host-targeted effectors.
Roger J. Daly obtained his PhD from the University of Liverpool, UK. He is the Head of the Department of Biochemistry and Molecular Biology and the Cancer Program within the Biomedicine Discovery Institute at Monash University. His research applies cutting-edge technology platforms in mass spectrometry-based proteomics and kinomics to inform and refine the sub classification of particular cancers, identify novel therapeutic targets and new applications for existing therapies, and also identify companion biomarkers that help stratify patients for appropriate therapy.
James C. Whisstock is a professor in the Monash Biomedicine Discovery Institute and Department of Biochemistry and Molecular Biology, Monash University, Australia. He is an NHMRC Senior Principal Research Fellow and the director of the ARC Centre of Excellence for Advanced Molecular Imaging. He studied for his bachelor degree and D.Phil. at The University of Cambridge, UK. His research interests include structural biology and drug development around immune-related complexes, including proteases and protease inhibitors and pore forming proteins such as perforin.
Jiangning Song is currently a Senior Research Fellow and group leader in the Monash Biomedicine Discovery Institute, Monash University, Melbourne, Australia. He is also affiliated with the Monash Centre for Data Science, Faculty of Information Technology, Monash University. His research interests include bioinformatics, computational biology, machine learning, data mining and pattern recognition.
References
auf dem
A du
Author notes
These authors contributed equally to this work.
