


Abstract
Genes originate at different evolutionary time scales and possess different ages, accordingly presenting diverse functional characteristics and reflecting distinct adaptive evolutionary innovations. In the past decades, progresses have been made in gene age identification by a variety of methods that are principally based on comparative genomics. Here we summarize methods for computational determination of gene age and evaluate the effectiveness of different computational methods for age identification. Our results show that improved age determination can be achieved by combining homolog clustering with phylogeny inference, which enables more accurate age identification in human genes. Accordingly, we characterize evolutionary dynamics of human genes based on an extremely long evolutionary time scale spanning ~4,000 million years from archaea/bacteria to human, revealing that young genes are clustered on certain chromosomes and that Mendelian disease genes (including monogenic disease and polygenic disease genes) and cancer genes exhibit divergent evolutionary origins. Taken together, deciphering genes’ ages as well as their evolutionary dynamics is of fundamental significance in unveiling the underlying mechanisms during evolution and better understanding how young or new genes become indispensable integrants coupled with novel phenotypes and biological diversity.
Introduction
It is well documented that genes could be birthed by many mechanisms including gene duplication [1–3], horizontal gene transfer [4–6], gene fusion/fission [7] and de novo creation from noncoding regions [8, 9] at divergent evolutionary time scales [10, 11]. A given evolutionary time, when a gene is birthed in a species along with the corresponding evolutionary events, is usually referred as the gene age. Genes with different ages have specific functional characteristics, leading to biological diversity during evolution [2, 12, 13]. It was recently found that genes with different ages play distinct roles during human early embryogenesis [14]. Therefore, determination of gene age is of great significance in unveiling evolutionary mechanisms and better understanding how genes contribute to biological diversity with novel phenotypes and relate to a variety of human diseases and cancers [12, 15].
Computational methods enable in silico identification of gene age across a wide range of organisms from unicellular species to human [15–17]. In this study, we provide a brief up-to-date summary on computational methods for gene age identification, evaluate their effectiveness and demonstrate empirical evidence by investigating important evolutionary events. As genes with different ages possess multiple evolutionary signatures, we also provide recent progresses on what signatures associate dominantly with gene age. Furthermore, we investigate the age distribution of human genes across all chromosomes and explore evolutionary characteristics of cancer genes (CGs) and Mendelian disease genes (DGs).
Computational methods for gene age identification
In the past two decades, a variety of computational methods has been proposed for gene age identification (Table 1). For any given human gene, in general, its age is usually determined based on the presence of homolog sequences in a wide range of species. Therefore, the phylogenetic hierarchy of the involved species restricts the range of gene age. Albeit computational methods for gene age identification are basically highly dependent on sequence similarity, they roughly fall into two groups in terms of the adopted strategy: SSO (similarity searching only) and SSP (similarity searching with priori information).
Summary of computational methods for gene age identification
| Method | Strategy | Criteria | Phylogenetic framework | Hierarchy | Focal species | Duplication inference |
|---|---|---|---|---|---|---|
| Domazet-Loso et al. [16, 18] | SSOa | BLASTP (E-value < 10−3) | From Archaea/Bacteria to Homo sapiens | 19 | Homo sapiens | No |
| Wolf et al. [17] | SSOa | BLASTP (E-value < 10−1 or 10−6) | From Archaea/Bacteria to Homo sapiens | 7, 7 and 7 | Homo sapiens; Drosophila melanogaster; Aspergillus fumigatus | No |
| Cai & Petrov [19] | SSOa | Phylogenetic profiles from PhyloPat; BLASTP (E-value < 10−3) | From Saccharomyces cerevisiae to Homo sapiens | 11 and 9 | Homo sapiens | No |
| Capra JA et al. [75] | SSOa | Searching orthology from the Princeton Protein Orthology Database and PANTHER Database | From Archaea/Bacteria to Homo sapiens | Determined by the uploaded phylogenetic relationships | Multi-species | No |
| Zhou et al. [20] | SSPb | BLASTN (E-value < 10−5; length > 200 bp or coverage > 0.7; identity > 0.8) | Drosophila | 4 | Drosophila melanogaster | Yes |
| Zhang et al. [21] | SSPb | BLASTP (E-value < 10−6); BLASTN (E-value < 10–16) coverage > 0.7; identity > 0.5) | From Danio rerio to Homo sapiens | 14 | Homo sapiens | Yes |
| Yin et al. [22] | SSPb | BLASTP (E-value < 10−3); MCL (I = 1.5) | From Archaea/Bacteria to Homo sapiens | 26 | Homo sapiens | Yes |
a) Similarity Searching Only; b) Similarity Searching with priori information.
In the SSO group, sequence similarity is detected merely by basic local alignment search tool (BLAST) or other similar algorithms, so that gene age can be inferred in a free evolutionary scale. The typical method in this group is ‘phylostratigraphy’, that is, reconstruction of macroevolutionary trends based on the principle of founder gene formation and punctuated emergence of protein families based on protein BLAST (BLASTP) [16, 18]. Ultimately, evolutionary origins of human genes were ascertained within 19 phylogenetic classes ranging from archaea/bacteria to Homo sapiens in [16, 18]. Based on this idea, several similar methods were lately proposed by categorizing human genes into seven age classes in [17] and 11 age classes in [19]. However, the reliability of the SSO strategy on homolog clustering is highly debated, simply because it is ineffective in differentiating paralogs and thus unable to accurately capture duplication events.
Contrastingly, the SSP group requires priori information (such as, phylogeny, gene order in the chromosomes and flanking region) to effectively infer the divergence of homologs and accurately determine the genes’ ages. For example, based on comparisons of flanking genes and gene orders in the chromosomes, evolutionary ages of genes were determined in Drosophila spanning ~40 million years [20] and identified in human by grouping into 14 age classes [21]. However, because of the fact that chromosomal information highly depends on chromosomal structure consistency, the SSP group is unable to define the gene age in a free evolutionary framework.
In our recent study, we combined homology clustering with phylogeny inference to assign the gene age at a more elaborate evolutionary time scale and categorized human genes into 26 evolutionary age classes ranging from archaea/bacteria to Homo sapiens [22]. Strikingly, in our procedure, homolog clustering and phylogeny inference were collectively used for gene age identification; BLASTP and Markov Cluster algorithm [23], termed as ‘BLAST+MCL’, were utilized for homolog clustering, and both horizontal and vertical evolution [24–27] were considered in phylogeny inference. As a consequence, parent and child genes can be discriminated and duplication events could be well traced back to the corresponding evolutionary time [22].
Effectiveness of homolog clustering
Homolog clustering is of critical significance on gene age identification. As it is highly disputed that BLAST-induced errors on age identification could create possible biological artifacts [28–32], we evaluate the effectiveness of homolog clustering by comparing two popular methods, viz., BLAST and BLAST+MCL (as mentioned above). Following a similar simulation procedure in [30], we simulate 6695 protein sequences at 11 different taxonomic levels (Supplementary Figure S1) using TreePuzzle [33] and ROSE [34] (with evolutionary rates in Gamma distributions [35]). Accordingly, we adopt BLAST and BLAST+MCL to perform homolog clustering on these simulated sequences. If a homolog could not be detected in a given distant taxa, then it is counted as an error. We estimate the error rates of BLAST and BLAST+MCL by considering three different E-value thresholds (Table 2). Strikingly, the error rates of homolog detection using BLAST and BLAST+MCL are 12.22% and 0.074% for E-value < 10−1, 14.78% and 0.089% for E-value < 10−3 and 17.49% and 0.104% for E-value < 10−6, respectively, clearly showing that BLAST+MCL achieves higher accuracy in homolog clustering.
Comparison of error rates of detecting homologs in most distant taxa between two methods on detection of simulated proteins
| Method | Error rates based on different E-values | ||
|---|---|---|---|
| E < 10−1 | E < 10−3 | E < 10−6 | |
| BLAST | 12.22% | 14.78% | 17.49% |
| BLAST+MCL | 0.074% | 0.089% | 0.104% |
| Method | Error rates based on different E-values | ||
|---|---|---|---|
| E < 10−1 | E < 10−3 | E < 10−6 | |
| BLAST | 12.22% | 14.78% | 17.49% |
| BLAST+MCL | 0.074% | 0.089% | 0.104% |
As reported in [31], an accurate method for gene age determination should be the one that is less affected by gene properties and accordingly presents no or less correlation between gene age and gene property. Therefore, it has been argued that the trends of evolutionary rate and protein length when a gene ages may be caused by BLAST errors [30, 31]. Here we plot gene age against protein length and evolutionary rate by considering BLAST and BLAST+MCL (Figure 1), respectively. It is consistently found that biased gene ages determined by BLAST do present an artifact correlation with protein length (rho = 0.107) or evolutionary rate (rho = −0.590), whereas BLAST+MCL does not present such correlation (rho = 0.048 for protein length and rho = −0.038 for evolutionary rate; Figure 1A and1B). Additionally, it has been also debated whether sequence conservation may influence gene age determination [30]. Thus, we further confirm that BLAST is sensitive to sequence conservation as testified by the increasing error rate, whereas BLAST+MCL yields very low error rates across a variety of sequence conservation (Figure 1C). Collectively, these results demonstrate the robustness of BLAST+MCL, as testified by that gene properties have no or little influence on gene age estimation.
![Evaluation of gene age estimation by BLAST and BLAST+MCL, considering (A) protein length, (B) evolutionary rate and (C) length of conserved sequence. Sequences were simulated by the method detailed in [30].](https://oup.silverchair-cdn.com/oup/backfile/Content_public/Journal/bib/20/6/10.1093_bib_bby074/3/m_bby074f1.jpeg?Expires=1749367609&Signature=5Es7NleoV3yVwMcMN5QOrtzIoILYspsEba~3smAdwv7BAHotkurmP~oHhztbvFcZNHKSdFmL2PAbHIPspeCjOb-SWF~~bqBlfjh~x1L--cVnfhrqQ20fQi7hfOOcXJjlB572vLuJTXvnEkro5BfiQmc2Hr7xB8tM8D0c4wySlsiEXVIxkZq1fGkLC6-cqi-z~1rO6FhmHHvTE~NMW3u73cIpCEhaps28XWw6OiUaqNwbQKdPl0QVCoB0G6xl-tvGbqNPcnfarZFs39znIY459fawXlrJ17qbn5VQBPCaRH22GnLHa7i0EcxWDl-PCAfXkBCV~hsjJxCFDH8v9C~rfA__&Key-Pair-Id=APKAIE5G5CRDK6RD3PGA)
Evaluation of gene age estimation by BLAST and BLAST+MCL, considering (A) protein length, (B) evolutionary rate and (C) length of conserved sequence. Sequences were simulated by the method detailed in [30].
Capturing important evolutionary events
Under a large-scale refined evolutionary framework, genes possessing different evolutionary ages are potentially informative to capture important evolutionary events. As reported in our recent study [22], genes are explosively birthed at the origin time of multicellularity, and importantly, the birth of specific genes could be refined at a more accurate evolutionary scale. For instance, MYEOV has been previously reported to de novo arise in human-specific lineage [36], whereas our age estimation [27] based on an extremely refined evolutionary time scale clearly shows that it is occurred more specifically at the origin of hominoidea [22]. Remarkably, previous studies based on a rough evolutionary scale for gene age identification [16, 18] are unable to accurately trace the exact evolutionary time points of gene loss event, accordingly yielding an imprecise finding that 96% of duplicate genes share the same age. In contrast, our age estimation [27] based on a long phylogenetic framework spanning~∼4,000 million years from archaea/bacteria to Homo sapiens spanning (Figure 2) clearly reveals that genes are heavily lost at the origination time of scandentia (age class 8) and primates (age class 7) and that 11% of duplication events can be traced back to the origin of metazoans (age class 21) and 16% of duplication events are assigned to the origin of chordates (age class 17), agreeing well with previous hypotheses that the origin of multicellularity species greatly increases the hierarchical complexity [37, 38] and that duplication events probably promote the shaping of vertebrate genomes [39].
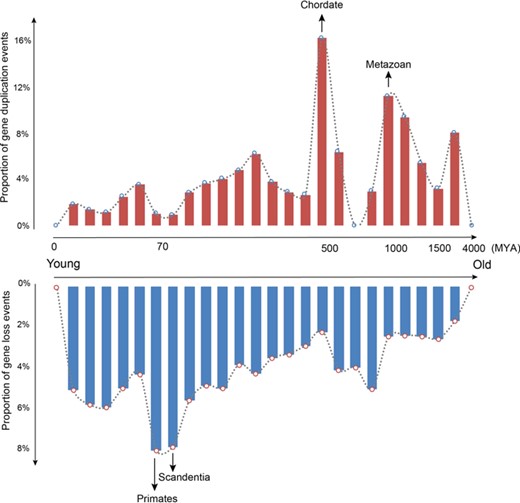
Gene loss and duplication events across a range of age classes.
Dominant evolutionary signatures related to gene age
Evidences have accumulated that multiple signatures from different omics levels are related to gene age, involving sequence structure, evolutionary rate, expression level, functional essentiality, etc., which, collectively, are summarized in Table 3. Basically, genes with different ages present heterogeneity in multiple evolutionary signatures; young genes, by comparison with old genes, tend to encode shorter proteins, possess less introns [17], harbor more premature termination codon mutations [36, 40], are less connected in the protein–protein interaction network (PPIN) [41, 42], evolve more rapidly [17, 19, 28] and experience more variable selection pressure [43]. Albeit it is believed that young genes play less essential functional roles [44], it has been also reported that young genes could quickly become essential as observed in Drosophila [45].
Signatures associated with gene age by comparing young genes against old genes
| Signature | Young genes | Old genes | Reference |
|---|---|---|---|
| Sequence length | Shorter | Longer | [17] |
| Intron number | Less | More | [17] |
| Premature termination codon mutation | More | Less | [36, 40] |
| Evolution rate | More rapidly | More slowly | [17, 19, 28] |
| Variable selection pressure | More | Less | [43] |
| Connections in the interaction network | Less | More | [41, 42] |
| Essentiality | Less essential | More essential | [44] [45] |
| Expression | Likely to be lowly expressed | Likely to be highly expressed | [19, 46, 47] |
| Tissue-specificity | More likely | Less likely | [48] |
| cis-protein QTLs | More | Less | [49] |
Abbreviation: QTLs, quantitative trait locis.
Additionally, young human genes are likely to be lowly expressed [19, 46, 47] and present distinct temporal and spatial expression patterns, so that young genes are more likely to be tissue-specific genes, whereas old genes tend to be housekeeping genes [48]. Also, it has been identified that young primate-specific genes possess more cis-protein quantitative trait locis (QTLs) and cis-expression QTLs with higher effect sizes and locate closer to the transcription start site [49]. Additionally, young and old duplicates differ strikingly in DNA methylation patterns [50].
Although multiple signatures are associated with gene age, they are highly interdependent, [51, 52], making it difficult to decipher which signature(s) is/are dominantly associated with gene age. In our recent study, it has been identified that guanine-cytosine (GC) content and connectivity in PPIN act as dominant signatures when a gene ages [22]. Consistently, it has been recently reported that de novo genes in primates originated from long noncoding RNAs possess GC-rich property [36] and de novo genes in yeast emerge from GC-rich intergenic regions [53], presumably enabling stable open reading frames (ORFs) with lower chance of nonsense mutations, and that the driving role for new genes evolving essential functions and participating in development is the connectivity in PPIN [42, 45]. Specially, considering the dominance of PPIN, more investigations could be carried out on the interactions between de novo genes from noncoding RNAs and coding genes and on the potential origination of genes from noncoding genes in testis, given the hypertranscription status of chromatin and rapid positive selection on genes in testis [54, 55]. Taken together, GC content and connectivity in PPIN, albeit there are still multiple omics-level signatures left in the genome during evolution, are dominant signatures associated closely with gene age.
The age landscape of human genes across chromosomes
Regarding the age distribution of human genes across chromosomes, notably, it has been revealed that many new retrogenes (genes from RNA-based duplication) come from X chromosome (known as ‘out of X’) [21, 56, 57] and are fixed on the autosomes, being shaped in the inactivation of X chromosome during and after meiosis [56]. This mechanism was first identified in Drosophila [58] and then in mammal [57, 59]. Further efforts have been made to investigate newly originated genes on X chromosome [21, 56, 57]. Moreover, it has been identified that young human genes are clustered on chromosome 14 [60].
Based on a more refined evolutionary time scale where human genes are classified into 26 age classes, here we investigate the age distribution of human genes and identify young gene clusters (YGCs) and old gene clusters (OGCs) on all chromosomes. Interestingly, we detect a total of 29 YGCs and 23 OGCs across all human chromosomes (Figure 3); YGCs are relatively scattered across sex chromosomes as well as a variety of autosomes (including chromosome 14, consistent with a previous study [60]; see Table S1 for details), whereas OGCs tend to be enriched on small autosomes (especially on chromosomes 13, 18 and 21; see Table S2 for details). Gene ontology (GO) enrichment analyses indicate that YGCs are functionally related with human immune systems, defense response and olfactory signaling pathways (Table S3). By contrast, OGCs are related with functions, such as chemical synaptic transmission and cellular response to compounds (Table S4). With the help of DEG (Database of Essential Genes) [61], we consistently find that 50.70% of genes in OGCs tend to be essential genes, whereas only 15.05% of genes in YGCs are essential. Together, such uneven distribution of YGCs and OGCs and their functional significance strongly indicate heterogeneous rates of gene emergence and divergent evolutionary pressures acting on different human chromosomes, which can be explained by previous findings that chromosomal instability may contribute to gene birth and gene order change [62, 63].
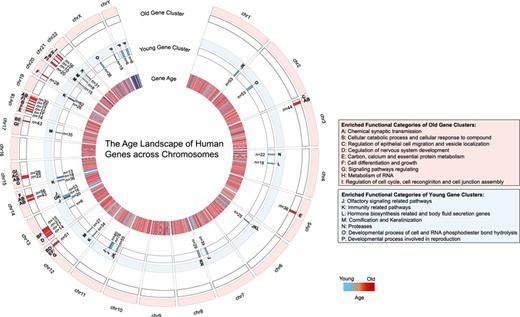
The age landscape of human genes across chromosomes. On any given chromosome, a YGC is defined as a region that contains a set of genes accounting for >3% of total genes, where >80% of genes are born after the origin of mammalia. An OGC is defined as a region on a chromosome that contains a set of genes accounting for >5% of total genes, where >85% of genes are born before the origin of metazoan. Furthermore, any individual YGC or OGC should possess more than five genes (n > 5). Gene lists of YGCs and OGCs are summarized in Table S1 and Table S2, respectively. Gene Ontology enrichment analyses are conducted by http://metascape.org.
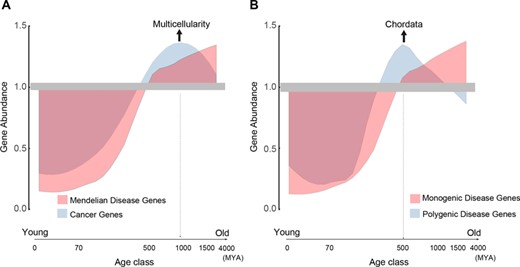
Relative abundance of human cancer and disease genes across a long phylogenetic time scale spanning ∼4000 million years. (A) CGs versus DGs. (B) MDGs versus PDGs. Suppose that pi is the percentage of cancer (disease) genes at age class i and p is the percentage of entire cancer (disease) genes across all age classes, gene abundance is formulated as the ratio of pi to p, indicating the relative abundance of cancer (disease) genes for any given age class, where gene abundance >1 means over-representation and gene abundance <1 means under-representation.
Evolutionary origins of DGs and CGs
Under this more refined evolutionary time scale framework, human genes can be traced back to different evolutionary origins [11], making it possible to elucidate the evolutionary age of CGs and DGs, which may be helpful to provide evolutionary insights for better understanding of human disease and CGs [64–67]. CGs and DGs have been found to arise early in the evolution [18, 38, 68]. Based on our gene age classification with more refined evolutionary time scale, we accordingly estimate the ages of CGs (obtained from COSMIC at http://cancer.sanger.ac.uk/cosmic) and DGs (obtained from DG-CST at http://dgcst.ceinge.unina.it/) and compare their evolutionary origins (Figure 4A). Detailed gene lists of CGs and DGs are summarized in Table S5.
It has been reported that the majority of DGs arise before the speciation of bilateria [18, 68] about 600 million years ago (MYA). However, our results show that DGs are abundantly present before 1500–4000 MYA. Additionally, we find that CGs tend to be younger than DGs, enriching at 500–1500 MYA, especially at the origin of metazoan, which is consistent with a previous report that CGs are over-originated at the evolutionary time point for transitions to multicellularity [38]. Albeit most CGs could be traced to ancient evolutionary times, it has been recently found that newly birthed genes are likely to be involved in tumorigenesis [69–71]. As DGs can be further classified into monogenic disease genes (MDGs) and polygenic disease genes (PDGs), we further reveal that PDGs, which are especially enriched at the origin of chordata, tend to be younger than MDGs (Figure 4B). Considering the association of gene age with evolutionary signatures as discussed above, this result is in agreement with previous findings that PDGs, compared with MDGs, have weaker selection pressure, have more disordered residues and lower expression levels [64], are partially recessive [72] and evolve faster [73]. Taken together, evolutionary tracing of disease genes and CGs is helpful for in-depth investigation of underlying complex mechanisms associated with human Mendelian diseases and cancer.
Conclusions and Perspectives
Facilitated by revolutionary high-throughput sequencing technologies, progresses have been made in investigating the evolutionary origins of human genes. Here we summarize existing computational methods for gene age identification, evaluate the effectiveness in accurate age determination by combining homolog clustering with phylogenetic inference, detect important evolutionary dynamics during human evolution, investigate the age landscape of human genes across all chromosomes and characterize evolutionary features of human disease and CGs. Given that deciphering the evolutionary dynamics of genes with different ages helps to uncover complex mechanisms governing biological diversity, continued efforts are further needed for precision determination of gene age at a more refined evolutionary time scale. Undoubtedly, challenges are ahead, especially considering the evidence that de novo genes originate from noncoding regions [74] and that CGs and disease genes present heterogeneity in their evolutionary origins, which, in return, could provide opportunities for better understanding the complex mechanisms coupled with novel phenotypes and biological diversity during human evolution.
Gene age can be accurately determined by combining homolog clustering with phylogeny inference.
Accurate identification of gene age aids in capturing important evolutionary events.
GC content and protein–protein interaction connectivity are dominant signatures associated closely with gene age.
A total of 29 YGCs and 23 OGCs are identified across human chromosomes.
CGs and DGs exhibit divergent evolutionary origins.
Acknowledgements
We sincerely thank three anonymous reviewers for their valuable comments on this work.
Funding
This study was supported by grants from The Strategic Priority Research Program of the Chinese Academy of Sciences (XDB13040500; XDA08020102), National Key Research Program of China (2017YFC0907502), National Programs for High Technology Research and Development (863 Program; 2015AA020108 and 2012AA020409), National Natural Science Foundation of China (31200978), the 13th Five-year Informatization Plan of Chinese Academy of Sciences (XXH13505–05), International Partnership Program of the Chinese Academy of Sciences (153F11KYSB20160008) and the ‘100-Talent Program’ of Chinese Academy of Sciences.
Hongyan Yin is a postdoctoral associate at Hainan Key Laboratory for Sustainable Utilization of Tropical Bioresources, Institute of Tropical Agriculture and Forestry, Hainan University, China. Her research interests lie in computational evolutionary biology and mechanisms of plant disease resistance.
Mengwei Li is a PhD student at CAS Key Laboratory of Genome Sciences and Information, Beijing Institute of Genomics, Chinese Academy of Sciences. His research focuses on cancer bioinformatics and DNA methylation.
Lin Xia is a PhD student at CAS Key Laboratory of Genome Sciences and Information, Beijing Institute of Genomics, Chinese Academy of Sciences. Her research focuses on big data integration and RNA editing.
Chaozu He is a professor at Hainan Key Laboratory for Sustainable Utilization of Tropical Bioresources, Institute of Tropical Agriculture and Forestry, Hainan University, China. His research interests include molecular genetics in plant development and disease resistance.
Zhang Zhang is a professor at BIG Data Center & CAS Key Laboratory of Genome Sciences and Information, Beijing Institute of Genomics, Chinese Academy of Sciences. His research interests are big data integration and computational evolutionary & health genomics.
References
Author notes
These authors contribute equally to this study.
