


Abstract
Integrative analysis aims to identify the driving factors of a biological process by the joint exploration of data from multiple cellular levels. The volume of omics data produced is constantly increasing, and so too does the collection of tools for its analysis. Comparative studies assessing performance and the biological value of results, however, are rare but in great demand. We present a comprehensive comparison of three integrative analysis approaches, sparse canonical correlation analysis (sCCA), non-negative matrix factorization (NMF) and logic data mining MicroArray Logic Analyzer (MALA), by applying them to simulated and experimental omics data. We find that sCCA and NMF are able to identify differential features in simulated data, while the Logic Data Mining method, MALA, falls short. Applied to experimental data, we show that MALA performs best in terms of sample classification accuracy, and in general, the classification power of prioritized feature sets is high (97.1–99.5% accuracy). The proportion of features identified by at least one of the other methods, however, is approximately 60% for sCCA and NMF and nearly 30% for MALA, and the proportion of features jointly identified by all methods is only around 16%. Similarly, the congruence on functional levels (Gene Ontology, Reactome) is low. Furthermore, the agreement of identified feature sets with curated gene signatures relevant to the investigated disease is modest. We discuss possible reasons for the moderate overlap of identified feature sets with each other and with curated cancer signatures. The R code to create simulated data, results and figures is provided at https://github.com/ThallingerLab/IamComparison.
Introduction
Life sciences focus on the characterization and deep understanding of living systems. The identification of processes causing function or dysfunction motivates comprehensive measurement of molecular profiles on multiple cellular levels in biological samples. The collection of such material, referred to as omics data, is facilitated with high-throughput technologies. In the majority of cases, a single omics data set is analysed at a time, but the joint exploration of multiple data sets, referred to as integrative analysis, is emerging. Integrative analysis aims to capture biological processes driving all analysed molecular levels by taking advantage of relations between data sets obtained from the same sample. Thereby, it is intended to reveal inherent common structures and characteristic differences between phenotypes and discovering key players and drivers of a specific biological condition.
Distinct mathematical concepts have been presented for the integrative analysis of two or multiple omics data sets. An overview and attempt to categorize integrative analysis approaches in regard to different aspects is given in [1]. Dimension reduction techniques used for integrative omics analysis have been comprehensively reviewed in [2]. Another class of approaches is the grouping of objects according to some similarity measure, referred to as clustering [3], which has been used for tumour subtype discovery [4–6] and variable selection [7]. Methods based on machine learning have also been used in an integrative context. The Random Forest (RF) approach [8], as a representative of these, builds a classification tree and ranks features. RF has been applied in an integrative setting to derive complex disease models [9].
Despite the remarkable number of integrative approaches published, only few reviews compare different algorithms: sparse partial least squares (sPLS; [10]) algorithm, canonical correlation analysis, CCA, with Elastic Net penalization (CCA-EN; [11]) and co-inertia analysis (CIA; [12–14]) have been compared in [15]. The three algorithms have been applied to gene expression (GE) data sets of human cancer cell lines obtained on two different platforms. Additionally, CIA, general singular value decomposition (GSVD; [16, 17]) and integrative biclustering (IBC; [18]), applied to gene and protein abundance data measured in different life cycle stages of Plasmodiumfalciparum, have been compared [19]. The study assesses method-specific and common results in terms of Gene Ontology (GO) biological processes (BP).
Conceptual differences in integrative data analysis algorithms become evident when they are applied to the same data sets, as different method will yield relatively incongruent results. Software tools are usually applied to biological data without prior investigation of underlying structure of the data. Hence, comprehensive simulation studies with realistic sample sizes are required to predict the biological soundness of results and the sensitivity and robustness of algorithms in response to different inherent structures. However, these are not always provided together with novel methods.
To address the need for comparative studies, we present a comprehensive and systematic evaluation of three approaches suitable for the integration of data covering different omics levels: (i) sparse canonical correlation analysis (sCCA; [20]), (ii) non-negative matrix factorization (NMF; [21]) and (iii) logic data mining MicroArray Logic Analyzer (MALA; [22]). sCCA reveals inherent structures by identifying correlated patterns across all measured omics levels. Decomposition methods generally derive a new variable space in which the problem is easier to understand through identification of feature sets that define the condition under study; to this end, we choose NMF as our second method in this comparison. Finally, the third method we include, MALA, is able to detect features with corresponding expression thresholds that are key to sample classification.
We apply the selected algorithms to simulated and experimental data sets, investigate congruences and differences and assess the prognostic value of results in terms of overlap with curated gene signatures. We illustrate the comparison on the basic level of commonly identified variables; however, interpretation of extensive variable lists is challenging, and thus, we also assess the level of overrepresented GO [23] terms and perturbed pathways from the Reactome knowledgebase [24, 25]. Finally, we explore advantages and drawbacks of algorithms and corresponding software implementations.
Methods
Algorithms
Algorithms in the context of research questions
Assuming that a feature is relevant for a biological process and given it is changed across different states of the process, this biological relevance is emphasized by the fact that functionally related features at different molecular levels correlate. For example, the correlation of DNA methylation (MET) levels in the promoter region of a gene and the mRNA expression level of the gene in different biological conditions might indicate a relevance for the biological process under study [26]. The goal of sCCA is to identify features that are correlated in the different data sets, for example to identify regions with copy number gains/losses or regions with high/low levels of DNA MET that are correlated with the mRNA expression level for a set of genes. Applied to multi-omics data sets, sCCA identifies features, which are correlated across multiple omics levels and largely contribute to the correlation of the transformed data sets. Similarly, NMF aims to unravel coordinative patterns in multi-omics data sets by finding correlative modules in all or a subset of samples comprising features from different data sets. In this way, associations among different molecular levels are captured and the modules can be used to stratify sample groups by clinically relevant attributes, based on strong or weak association of a module and the respective sample. MALA is proposed for the accurate discrimination of samples of one or multiple classes. It discovers feature sets whose combined expression profiles characterize the model of a biological process.
General set-up
The methods described herein are well known in their canonical form. Recently, they have been extended towards the application to (multiple) omics data sets. We recall the general concepts of the methods we apply on two data matrices: X1 () and X2 () where n denotes the number of samples, and m1 and m2 denote the number of features. These matrices contain in our case m1 mRNA-sequencing (RNA-seq) GE profiles and DNA MET levels of m2 CpG sites obtained from the same n individuals. The features in each data set do not necessarily match one another, and thus, in general, m1 and m2 are different.
Sparse canonical correlation analysis
CCA [27] aims to find the projections of two data matrices X1 and X2, which maximally correlate, whereat the projection of a matrix is represented by the linear combination(s) of its features. As in the case of omics data sets where , there is no unambiguous solution for the weights in the linear combination. To cope with this limitation, a sparse version of CCA (sCCA) was introduced [11, 28, 29]. sCCA is reformulated as a penalized matrix decomposition (PMD; [29]) problem: a data matrix X is represented as UDVT known as the singular value decomposition (SVD) of X where the singular vectors are subjected to numerical constraints. The PMD of the product , with L1-norm of the singular vectors in the rank-1 PMD restricted to appropriate constants c1 and c2, corresponds to a penalized CCA, which results in unambiguous and sparse weight vectors. The elements of the sparse canonical weight vectors are determined iteratively based on a biconvex optimization criterion depending on c1 and c2. This framework can be generalized to multiple data matrices [20]. The non-zero weighted variables represent sets of correlated features across data sets, and these are of special biological interest.
Non-negative matrix factorization
NMF has been described earlier in a non-biological context: the non-negativity constraint allows only additive combinations, and thus, NMF suggests a parts-based representation of objects, such as the features of faces [30]. In an omics framework, NMF is used to discover similar profiles in all or a subset of samples across multiple data sets, referred to as multidimensional modules (md-modules; [21]). The algorithm described in [21] decomposes the data matrices into building blocks with shared attributes and data set-specific weights. Conceptually, NMF is used to decompose a data matrix X into non-negative factor matrices: a matrix W, which contains the basis vectors, and a matrix H, which comprises the data set-specific weights of the basis vectors. The number of basis vectors K must be specified in advance. In the original paper, the selection of K is stated to be problem-dependent and is based on empirical factors. We are interested in the md-modules of two biological conditions (healthy versus diseased), and we set K = 2 to capture the major disease-related structures. The matrices W and H are chosen as to minimize the reconstruction error of X measured in terms of the squared Frobenius norm. NMF can be applied to multiple data matrices simultaneously. The weights in Hi encode for strong or weak presence of the building blocks in the columns (features) of Xi. The features corresponding to highly ranked weights in row of Hi are pooled into an md-module. The members of md-modules are of special interest, as they represent an important additive part in the reconstruction of the data object.
Logic data mining
The term logic data mining describes a class of algorithms used for classifying samples based on selected features in binary or logic form, which has been applied to biomedical data before [31]. In the context of omics profiles, logic data mining is a multistep procedure comprising: (i) feature binarization, (ii) feature selection (FS) and (iii) extraction of logic formulas representing the classification model. Logic data mining has been used for the identification of new potential GE biomarkers for Alzheimer’s disease [32], and steps (i)–(iii) are implemented in the software tool MALA [22]. MALA has originally been proposed for the analysis of large microarray data sets; however, it is also applicable to adequately preprocessed RNA-seq data [33]. MALA represents a machine learning approach used to derive a small number of logic formulas (rules in the form if-then, for example if A1BG < 0.23, then the sample is TUMOUR) comprising the selected features, which allow discrimination between the samples of different biological states. A detailed description of feature binarization [31, 34], the FS procedure [35] and the algorithms used to build the logic formulas [36, 37] can be found elsewhere. The logic data mining approach can be extended to multiple (I) omics data sets Xi by concatenating the standardized mi features of n experimental samples to a single data matrix of dimension n × m with and .
Technical comparison
Integrative analysis methods are used to answer a myriad of research questions, including the identification of omics features that are driving disease phenotypes; omics features that are able to distinguish between healthy and disease samples; or omics features that can separate disease subtypes. Approaches based on different mathematical concepts can be used to answer the same research question. sCCA and NMF will identify correlated patterns across multiple data sets by data decomposition, while MALA identifies relevant features through a three-step, logic data mining approach: feature binarization, FS and extraction of logic formulas. sCCA includes a -norm penalization resulting in non-zero weights for the features of interest. NMF decomposes the data into non-negative building blocks with highly ranked weights representing relevant features. MALA uses a random FS step from which the logic formulas, containing the features of interest, are derived. While the methods apply different approaches, they all provide a step where relevant features are selected. The set of selected features represents the variables that account for the inherent structure of the data and may be biologically relevant.
Software implementation and parameter settings
An implementation of sCCA on multiple data sets is provided in the R [38] package PMA [39]. The number of iterations on the objective function is set to 50 and 100 for synthetic and experimental data respectively. A Matlab® implementation of NMF for three data sets is available as a supplement to [21]. We implement NMF for multiple data sets in R and set the number of random initializations of W and Hi to 50 and 100 for synthetic and experimental data respectively and the number of iterations on the objective function to 1000. MALA is available for download at http://dmb.iasi.cnr.it/mala-downloads.php. As the original MALA implementation runs out of memory for our experimental data, we replace the file implementing the FS with a modified version supplied by the authors of MALA. The source code and the compiled version for 64-bit Ubuntu Linux are provided in the Supplementary Data. We set the parameters of MALA to skip clustering, to perform random percentage split of samples in each run, to select a maximum number of 50 features (maximum) in one run and to include a maximum number of literals and clauses into the logic formulas. The time dedicated to the FS step is limited to 960 s (maximum). Additional parameters, such as the number of iterations in the FS step (100), are left at the settings suggested by the authors in the user manual (http://dmb.iasi.cnr.it/Downloads/MALA/GUI/MALA-GUI-MANUAL.pdf). We embed sCCA, NMF and MALA in an R framework, which comprises preprocessing of experimental data, synthetic data generation, the application of methods to the data sets, performance evaluation and comparison of results. We provide the environment and R code to reproduce results and figures presented in this study on GitHub (https://github.com/ThallingerLab/IamComparison).
Data sets
We apply sCCA, NMF and MALA to both simulated and experimentally derived data sets. The simulated data sets provide a ‘ground truth’ to which the results can be directly compared, while the experimental data set gives an indication of the real-world performance of the methods. To demonstrate the integrative analysis capabilities of methods, data from two directly related omics levels are used: we use normalized GE levels and β-values representing CpG site MET levels of two biological conditions. Preprocessing comprises log2-transformation of GE values in the experimental data and transformation of MET levels from β- to M-values [40].
Experimental data
We use publicly available Breast Cancer data (BRCA; [43]) from The Cancer Genome Atlas project (TCGA). The download has been performed using TCGA Assembler tool [41, 42]. For the comparison, we use a subset comprising data obtained on two platforms: RSEM normalized RNA-seq GE levels (subtype gene, Level 3, RNA-seq version 2), and MET levels (array based, Level 3). DNA MET data were obtained on Illumina 27k arrays and 450k arrays, respectively. In a merging step, implemented in TCGA Assembler, only those probes were kept that have been measured with both array types. We reduce this subset to GE and MET levels of patients from whom paired samples of tumour and adjacent normal tissue are available (104 complete samples). Features with >10% missing values across samples are removed from both data sets. The remaining missing values in each feature are imputed with half of the lowest measured value in that feature. To better generalize the results of the three methods on experimental data, we downloaded three additional data sets from TCGA and preprocessed them in the same way as the breast cancer data sets: lung adenocarcinoma (LUAD, 20 complete samples), kidney renal clear cell carcinoma (KIRC, 24 complete samples), and colon adenocarcinoma (COAD, 15 complete samples). The number of features and samples in each dataset before and after filtering are given in Supplementary Table S1.
Simulated data
Combinations of different values for parameters δ and pDE result in a total number of nine parameter sets, and with each set, we run the simulation 100 times (Table 1). The data simulation is based on the procedure described in [46].
Parameters for data simulation
| Abberation level | DE features % | ||||
|---|---|---|---|---|---|
| Effect | δ | SD | ppath | prand | pDE |
| Weak | 0.2 | 0.1 | 10.0 | 1.0 | 3.5 |
| Medium | 0.4 | 20.0 | 13.5 | ||
| Strong | 0.8 | 50.0 | 26.0 | ||
| Abberation level | DE features % | ||||
|---|---|---|---|---|---|
| Effect | δ | SD | ppath | prand | pDE |
| Weak | 0.2 | 0.1 | 10.0 | 1.0 | 3.5 |
| Medium | 0.4 | 20.0 | 13.5 | ||
| Strong | 0.8 | 50.0 | 26.0 | ||
Note: Aberration level of DE features in terms of relative effect size δ and relative SD; proportion of features ppath simulated as DE in each of 5 of 20 pathways; random prand and total pDE proportion of DE features in a data set. Combinations of parameters δ and pDE result in a total number of nine parameter sets and in 18 simulated data sets (9 GE and 9 MET).
Comparison
Variable sets
To achieve comparable sizes of feature sets for the different methods, we predefine the number of variables to be selected by sCCA and NMF in the GE and the MET data set, respectively, and accumulate the features selected in multiple (maximum 100) runs of MALA. For synthetic data, we set the number of variables to be equal to . For experimental data, we calculate log2-fold-changes of GE and difference in means of MET M-values between groups for each feature and derive an empirical density function for each data set. We set a density-dependent threshold of ±3.5 in GE and ±2.2 in MET and estimate the number of interesting features as those located in lower and upper tails of the empirical density function.
Discrimination power
We assess the power of each method for detecting DE features in synthetic data sets by calculating the Matthews correlation coefficient (MCC, [47]), a performance metric for imbalanced data, taking values in the range of −1 to 1. In the experimental data, the truly DE features are unknown, and thus, the accuracy of sample classification is used as performance measure. We split the experimental data sets 10 times and apply each method to 80% of tumour and normal samples (training set). For each split, the resulting feature set is evaluated as follows: we construct two matrices containing the resulting feature set, one matrix comprising the samples in the training set and one matrix comprising the remaining 20% of samples (test set). On these matrices, we perform hierarchical clustering on samples using R functions dist and hclust with Euclidean distance measure and ward.D2 agglomeration method (data not shown). The resulting dendrogram is cut with the R function cutree so as to obtain two groups. The degree of consensus between the two main clusters and the biological conditions (classification accuracy) is derived. This represents the discriminating power of the feature set and is used as a performance measure.
Comparison on the feature and the annotation level
We examine the congruence of feature sets resulting from the different methods. To yet unravel biological redundancies of results, we compare them on different annotation levels. Features selected in the synthetic data are mapped to simulated pathways and pathway over-representation is assessed with one-sided Fisher’s exact test (R function fisher.test). The capability of methods to identify perturbed pathways in simulated data is measured in terms of the MCC. Features resulting from experimental data are mapped to genes and additionally to over-represented GO terms in an unconditional test, and to perturbed Reactome pathways (RP). For this, the functions hyperGTest and runSPIA from Bioconductor [48] packages GOstats [49] with annotation database packages org.Hs.eg.db (v. 3.4.1) [50] and GO.db (v. 3.4.1) [51], and graphite (v. 1.22.0) [52], which serves as an interface to the R package SPIA [53] and to Reactome, were used. For each gene, we call the function runSPIA with the log2-fold-change of the corresponding feature in the GE data set and the largest difference in means of M-values of the corresponding features in the MET data set. The results of the comparison are visualized as Venn diagrams created with R package VennDiagram [54]. The false discovery rate of overrepre- sentation analysis is controlled at a level of 5% in synthetic data and at a level of 20% for experimental data with Benjamini–Hochberg’s [55] method.
Comparison with cancer signatures
We assess the biological relevance of results on experimental data investigating the overlap of feature sets with known cancer signatures. Signatures under consideration include a set of genes and gene products generally involved in different types of cancer (Kyoto Encyclopedia of Genes and Genomes, KEGG, Pathways in cancer; [56]), targets of cancer therapy (Tumour Alterations Relevant for GEnomics-driven Therapy (TARGET); http://archive.broadinstitute.org/cancer/cga/target, v3 14 February 2015), three gene sets for breast cancer subtype stratification: PAM (Prediction Analysis of Microarray; [57]), Sorlie [58] and Hu [59] and a collection of genes of the immune system identified in different transcriptomic studies to bear prognostic and predictive roles in breast cancer (Immune; [60] and related publications). Statistical significance of overlaps is assessed, after removal of genes not present in our data set, with one-sided Fisher’s exact test (R function fisher.test).
Computational environment
Computation of sCCA and NMF was conducted on Windows 7 64-bit Intel Core i7-4770 CPU and 16 GB RAM. Processing of the experimental datasets with TCGA Assembler and computation of MALA was accomplished on a cluster running CentOS Linux 7 with four Intel Xeon E7-4830 CPUs and 500 GB RAM. Further computations were conducted in R [38] version 3.4.1.
Results
Performance evaluation
We applied sCCA, NMF and MALA to synthetic data generated with nine sets of simulation parameters combining different aberration levels and proportions of DE features. Larger proportions of DE features and stronger DE signals result in a better agreement of simulated and predicted DE features for all methods (Figure 1). When the DE signal is weak (δ = 0.2) and the proportion of DE features is small (3.5%), all methods fail to identify DE features. When the DE signal is moderate, the correlation of simulated and predicted DE features for sCCA and NMF largely depends on the proportion of DE features. At larger proportions of DE features, sCCA and NMF are able to predict the majority of features simulated as DE correctly, and the performance of MALA starts to increase. If the DE signal is strong, sCCA and NMF are almost perfectly capable to identify DE features, and the proportion of DE features correctly identified by MALA further increases. Across all simulated data sets, sCCA performs best, NMF is almost as good as sCCA and the ability of MALA to identify DE features is modest (Figure 1).
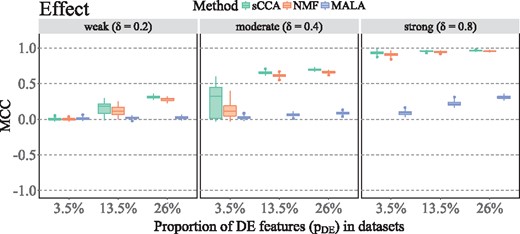
MCC for methods applied to 100 synthetic data sets. Combinations of parameters listed in Table 1 result in a total number of nine parameter sets, and MCC is visualized for different DE signals (weak, moderate, strong) and proportions of DE features (3.5, 13.5 and 26%).
On experimental data, the performance of methods is represented by the classification accuracy (ACC), true positive rate (TPR) and specificity (SP) achieved with the resulting feature sets. The average ACC on test data is 97.1, 98.6 and 99.5% for sCCA, NMF and MALA, respectively, and is higher in the test set than in the training set for sCCA and NMF. Average TPR ranges from 94.3% (sCCA) to 99% (MALA), and average SP ranges from 99.5% (NMF) to 100% (sCCA, MALA) on the test data (Figure 2). All methods displayed similar performance across the three additional data sets (Supplementary Figure S1), with one exception: we note that the TPR dropped below 80% in the COAD data set.
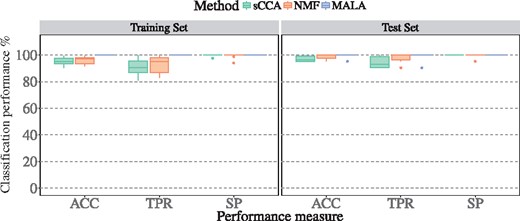
Performance evaluation of methods on experimental data in terms of classification ACC, TPR and SP of methods in n = 10 random splits. Methods are applied on 80% of samples (training set), and performance of selected features is assessed on the training set and on the remaining 20% of samples (test set).
Downstream analysis of variable sets
In synthetic data, the ability of methods to identify perturbed pathways depends largely on the proportion and the aberration level of DE features. sCCA and NMF are able to correctly identify all perturbed pathways at proportions of DE features of 13.5 and 26%, if the DE signal is moderate or strong, and at a proportion of 3.5%, if the DE signal is strong. At weak DE signals, sCCA and NMF identify all perturbed pathways, as the proportion of DE features is large (26%). MALA does not reveal (reliably) the perturbed pathways in simulated data sets, except when the DE signal is strong and the proportion of DE features in perturbed pathways is large. Perturbed pathways may or may not be identified by sCCA and NMF at a weak DE signal and a medium proportion of DE features. At a moderate DE signal, sCCA is capable to identify a subset of perturbed pathways at small proportions of DE features. MALA identifies a subset of perturbed pathways at moderate DE signals and a large proportion of DE features (Supplementary Figure S2).
We quantitatively compare method results for the experimental data set and visualize overlaps on different annotation levels as Venn diagrams. Each method results in an approximate number of 500 features or 1.3% of the total number of features under study (39 553), and 78 or approximately 16% of these are identified by all three methods (Figure 3A). If features are mapped to genes, the percentage increases to almost 3% (sCCA: 2.63%, NMF: 2.68%, MALA: 2.78%) of total genes (18 216), and the overlap of all methods is with 77 or approximately 16% of genes the same as on the features level (Figure 3B). The pair-wise overlap of feature/gene sets is considerably higher. The proportion of features/genes detected by at least one of the other methods is 310/305, 305/299 and 149/149 or approximately 60% for sCCA and NMF and 30% for MALA, respectively.
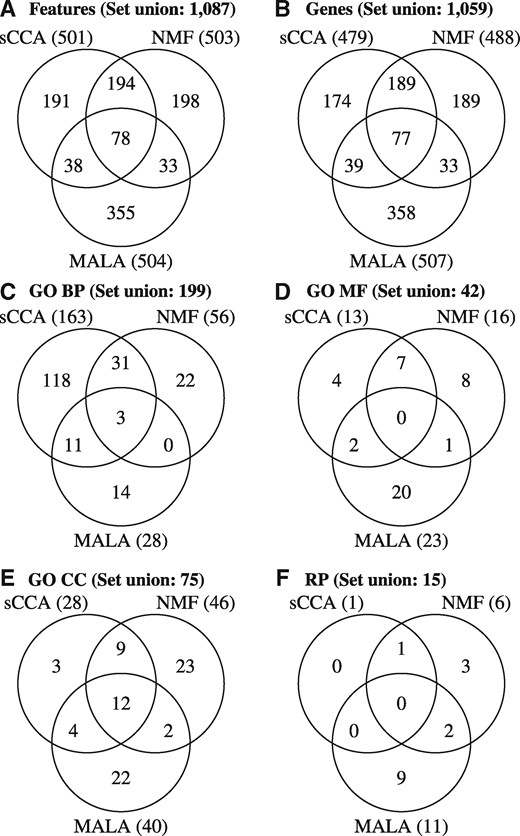
Overlap of method results is shown on (A) feature (genes, CpG sites) and (B) on gene level and in terms of over-represented GO (C) BP, (D) MF, (E) CC and (F) perturbed RP.
Comparison of biological information in terms of over-represented GO terms for BP, molecular functions (MF) and cellular components (CC) (Figure 3C–E) reflects well the situation on feature/gene level in that terms over-represented in the results of sCCA and NMF produce in general more overlap than with those over-represented in the results of MALA. Regarding GO BP, the set of over-represented terms in the results of NMF and MALA is relatively small as compared with the set of terms over-represented in the result of sCCA, while the number of over-represented terms is more balanced in the remaining annotation categories MF and CC. Over-representation analysis of RP results in few pathways associated to each feature set (Figure 3F), and the overlap of RP produced by MALA with sCCA and NMF is particularly small.
We applied sCCA, NMF and MALA to three additional biological data sets (KIRC, LUAD and COAD) and assessed the overlap of features, genes and perturbed pathways (Figure 4 and Supplementary Figures S3–S5). Similar patterns emerge across all analysed data sets. On the feature and gene level, we observe that MALA selects the most unique features/genes followed by sCCA and NMF, which select a similar proportion of unique features/genes. When comparing the overlap between two methods, sCCA and NMF show the highest overlap followed by sCCA and MALA, and NMF and MALA that select similar proportions of overlapping features/genes in most cases. The overlap between all three methods is low in all four data sets. Comparable patterns can be observed in terms of perturbed pathways. MALA identifies most unique perturbed pathways, except RP, which were not overrepresented in the data sets with low sample size (KIRC, LUAD and COAD). The proportion of identified unique pathways is less similar among sCCA and NMF compared with the feature and gene level. We observe that the overlap between sCCA and NMF selected pathways is higher than sCCA and MALA, and NMF and MALA. The overlap between all three methods is low, with instances in which no overlap was observed. The overlap of RP is particularly low compared with the overlap on the GO level. An overview of the number of unique features/genes identified with each method in the GE, the MET and in both data sets as well as the number of GO terms and RP resulting from the over-representation analysis of these sets is given in Supplementary Tables S2–S4, S22–S24, S42–S44 and S62–S64, respectively. A list of features and mapped genes resulting from sCCA, NMF and MALA in each dataset is given in Supplementary Tables S5–S10, S25–S30, S45–S49 and S65–S69; over-represented GO terms are enlisted in Supplementary Tables S11–S19, S31–S38, S50–S58 and S70–S78; and a list of over-represented pathways is given in Supplementary Tables S20–S21, S39–S41, S59–S61 and S79–S81, respectively.
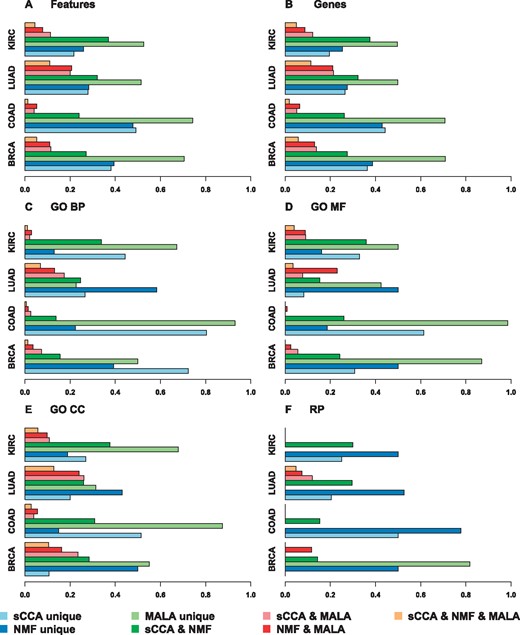
Overlap on the feature, gene and perturbed pathway levels between sCCA, NMF and MALA, across four data sets (KIRC, 24 complete samples; LUAD, 20 complete samples; COAD, 15 complete samples; and BRCA with 104 complete samples). Unique features were defined as the proportion of features uniquely identified by one method, relative the total number of features identified by that method. The overlap between two methods was defined as the proportion of features identified by both methods, relative the total number of features identified by the two methods together. The overlap between all three methods was defined relative the total number of features identified by all three methods.
To assess their biological relevance, we compare the results of sCCA, NMF and MALA to curated cancer signatures (Table 2). One-sided Fisher’s exact test shows significant (*0.04 < P-value < 0.05; P-value = ) overlap of method results with gene sets PAM (sCCA, NMF, MALA), KEGG and Hu (MALA). The overlap of PAM, KEGG and Hu gene signatures with method results on the BRCA data set is visualized in Supplementary Figure S6. The overlap of results on the LUAD, the KIRC and the COAD data sets with the KEGG and TARGET gene signatures is visualized in Supplementary Figures S7 and S8, respectively.
Overlap of method results on experimental data with curated cancer signatures
| KEGG (307) | PAM (50) | Sorlie (433) | Hu (219) | Immune (110) | TARGET (135) | |
|---|---|---|---|---|---|---|
| sCCA | 10 | 4* | 11 | 5 | 5 | 4 |
| NMF | 12 | 8** | 9 | 7 | 5 | 3 |
| MALA | 14* | 5* | 11 | 11* | 4 | 5 |
| KEGG (307) | PAM (50) | Sorlie (433) | Hu (219) | Immune (110) | TARGET (135) | |
|---|---|---|---|---|---|---|
| sCCA | 10 | 4* | 11 | 5 | 5 | 4 |
| NMF | 12 | 8** | 9 | 7 | 5 | 3 |
| MALA | 14* | 5* | 11 | 11* | 4 | 5 |
Note: The number in parenthesis indicates the number of genes in the signature included in the experimental data set. Significant overlap following a one-sided Fisher’s exact test is indicated by *0.04 < P-value < 0.05) and **P-value = ).
Computational runtime
The computing time is mainly a consequence of the parameter settings and the dimensionality of data matrices and is shortest for sCCA. The analysis of a single data set with sCCA is completed in the order of seconds. Effectively, completion time of sCCA is extended, as multiple sCCA runs are required to find constants c1 and c2 resulting in a desired level of sparseness. The NMF run time accumulates to several seconds on simulated and to several hours for the experimental data. A single MALA run takes 1–2 min on the simulated data and approximately 40 min on the experimental data. We perform up to 100 MALA runs on each data set and accumulate the results (Table 3).
Computational runtime in minutes
| Synthetic data | Experimental data (BRCA) | |||
|---|---|---|---|---|
| 1 run | Total | 1 run | Total | |
| sCCA | <1 | 900 | <1 | 8250 |
| NMF | 8 | 2000 | 230 | 6860 |
| MALA | 2 | 5700a | 40 | 14 970a |
| Synthetic data | Experimental data (BRCA) | |||
|---|---|---|---|---|
| 1 run | Total | 1 run | Total | |
| sCCA | <1 | 900 | <1 | 8250 |
| NMF | 8 | 2000 | 230 | 6860 |
| MALA | 2 | 5700a | 40 | 14 970a |
Note: Computing time of a single analysis run performed on a single synthetic or experimental data set; and accumulated computing time of analysis runs performed on 100 synthetic data sets and on experimental data and on 10 training data sets, respectively.
aMultiple runs have been performed in parallel.
Discussion
The analysis of omics data aims to identify subsets of variables capable of explaining different phenotypes and to uncover functional relationships between these variables. Recently, integrative analysis approaches have emerged, combining multiple information levels provided by multiple omics technologies. The growing use of integrative methods imposes a number of fundamental questions on the validity and comparability of analysis results. However, comparisons are rare and in great demand.
In the presented work, we investigated the concordance of results from three integrative analysis methods published recently and coming with ready-to-use software implementations. Although the potential biological value of the results is evidenced by the substantial power provided to accurately classify samples, the set of features jointly identified by all methods is relatively small.
Conceptual differences between methods
As representatives of decomposition-based approaches, sCCA finds the projections of data matrices with maximum pair-wise correlation using a limited number of variables, and NMF derives most important additive components by minimizing the joint reconstruction error of data matrices. The goal of the third method MALA, which represents machine learning-based approaches, is to select a minimal set of variables capable of separating different phenotype samples.
Feature selection
In this study, we predefine the number of variables to be selected: the variables are represented by non-zero canonical weights in sCCA, by the members of md-modules in NMF, and by the feature-literals in the logic formulas resulting from MALA. In sCCA, we chose the constants c1 and c2 as to roughly achieve a desired level of sparseness in the canonical weight vectors; however, the R package PMA provides a function, MultiCCA.permute, to select these constants, from a supplied set of values, based on the correlation in the data. In NMF, we set the weight threshold for the incorporation of variables into an md-module, separately for the GE and the MET data set, so as to include a desired number of variables in the md-modules. However, this threshold can be set to an arbitrary constant. In MALA, the (maximum) number of features to be included in the logic formulas in one run is determined by the parameter β, and the number of variables selected in GE and the MET cannot be defined separately. Remarkably, the number of variables selected in one MALA run is relatively small. The results of MALA runs differ because of a heuristic component in FS and the fact that the classification model is derived from a random subset of samples in each run. Thus, the set of selected variables can be expanded by accumulation of results from multiple runs. In the experimental data, MALA tends to select preferentially features from the GE data set, while in the synthetic data more features from the MET data set are selected. This might indicate that the features in the GE or in the MET data set are more powerful in discriminating the samples, respectively. The unequal number of features MALA selects in the GE and the MET data set as compared with sCCA and NMF might be an important reason for the small overlap of method results at the feature/gene level as well as on the biological annotation level. Regardless of the biological question, the number of truly informative features in each data set is unknown. A major limitation of sCCA, NMF and MALA is thus that the number of variables to be selected has, in fact, to be predefined. An essential characteristic of MALA is that the number of phenotypes present and the phenotype labels of samples have to be delivered with the data.
Performance evaluation
Performance evaluation on synthetic data illustrates that all methods benefit from large proportions of DE features and stronger DE signals, and that MALA is least capable to identify DE features. In turn, the performance on experimental data of sCCA and NMF in terms of sample classification accuracy is slightly inferior to that of MALA. sCCA and NMF result in a predefined (large) number of features, which may impose conflicts on the classification of samples. In contrast to that, MALA is proposed to derive a simple classification model, comprising a small number of features, applicable for the discrimination of phenotypes. We set the number of features to build up the classification model in each MALA run to the maximum (β = 50). The large β value results in a decrease of the performance of the classification model derived in a single MALA run on the test set (overfitting). We accumulate the features selected in multiple runs to obtain a feature set specifically relevant for the analysed data set. The authors of MALA recently presented a novel method for the extraction of a rule-based classification model from RNA-seq data sets: Classifier with Alternative and MUltiple Rule-based models (CAMUR) [61]. The stated aim of CAMUR is to extract multiple equivalent classification models and therewith to identify a larger number of features related to a biological condition than is typically identified by other rule-based classifiers. The algorithm to derive the classification model used in CAMUR differs from the one used in MALA; however, CAMUR only extracted 2% of the DE genes in TCGA Breast cancer data, which is similar to the results of MALA on synthetic data in this study. This suggests that rule-based classification algorithms in general, and MALA in particular, are not designed to detect all DE features but the minimal number required for an accurate classification.
Biological findings
The feature/gene sets identified by the methods in the experimental data produce a relatively small overlap (approximately 16%). We surmised that on the GO terms and pathway level the percentage of overlap would be larger, as we expected the methods to reveal perturbed biological structures. In synthetic data, the pathway over-representation analysis demonstrates that, in some simulation scenarios, the methods are able to reveal perturbed pathways, although the MCC of identified and predicted DE features was low (Supplementary Figure S2). However, regarding experimental data, considering the differing set sizes, the overlap on the GO and pathway annotation level is in most cases even smaller as compared with the feature/gene level. This might be to some extent a consequence of the used functions HyperGTest and runSPIA delivered with the R packages GOstats and graphite, respectively, which do not take into account the feature level but are based on the mapped gene identifiers. To produce the largest possible overlap, we perform an unconditional over-representation test of GO terms where each term is assessed separately, regardless of its relation to other significant terms in the GO graph. Additionally, the purpose of over-representation analysis in this study is to reveal congruences of method results, rather than biological interpretation.
As the experimental data comprise tumour and normal samples, we expect integrative analysis to have the capability of identifying genes known to play a role in cancer. However, the results show a relatively poor overlap with generally accepted (breast) cancer signatures (Table 2 and Supplementary Figure S7). Effectively, in our experimental data set, the normal (control) condition is represented by samples from tissue adjacent to the tumour, and this may be a reason why we do not see a high overlap with known signatures.
Another reason for the poor overlap might be that gene sets PAM, Sorlie and Hu are proposed for breast cancer subtype stratification; KEGG is not specific for breast cancer but comprises general cancer pathways; Immune and TARGET comprise candidates addressed in cancer therapy and are thus not intended for the classification of samples. Notably, the overlap of NMF with PAM shows the smallest P-value. This might indicate that the md-modules, identified by NMF as important parts in the additive reconstruction of the original data sets, account for inherent structures such as tumour subtypes.
Other comparison studies
CIA, GSVD and IBC have been compared in terms of GO BP associated with experimental conditions [19]; however, no list of features to differentiate experimental conditions was provided. The proportion of commonly identified GO terms largely depends on the experimental condition, and the authors propose to take the intersection of the three results obtained for the biological interpretation. In [15], the results of CCA-EN, CIA and sPLS in terms of statistical measures and biological findings are compared. As the authors aim to discriminate more than two experimental conditions, they use the first three components of the decomposition in each method. As statistical measures, they use the amount of explained variance by each component in the decomposition of individual data sets and the correlation between the components across data set in each dimension. Additionally, they assess the overlap of genes and associated pathways corresponding to components separating the same cell lines and found the results of CCA-EN and sPLS to be congruent and rather complementary to CIA results. Both studies [15, 19] have in common the aim of discriminating subtypes of an experimental condition (life cycle stages of P. falciparum and human tumour cell lines, respectively) in contrast to the experimental data set used here where samples from breast cancer primary tumour and adjacent normal tissue, regardless of tumour subtype, stage or grade and subject age, therapeutic or prognostic status, are used. Further methods were suggested for tumour subtype discovery in multi-omics data, including ‘Group Lasso and Tight iCluster’ (GSTiC) [62] and ‘Integrative Sparse K-Means With Overlapping Group Lasso’ [63]. GSTiC is similar to sCCA and NMF, as it regularizes sparse weight vectors (like sCCA) and discovers modules corresponding to subtypes (like NMF).
Computational resources
The computing time and the required main memory resources vary enormously between methods. The quickest algorithm is sCCA. Depending on the system architecture, the computational load of sCCA is spread across multiple threads. The second fastest method is NMF. The computing time required depends largely on the dimensionality of data matrices and on the selected number of random initialisations and iterations of factor matrices. Notably, random initializations might be parallelized. The computing time of MALA is dominated by two factors: the FS step and the transposition of data matrices. MALA performs substantial numbers of read/write operations and can be significantly accelerated by operating on a solid state drive. The time dedicated to the completion of FS can be defined in the parameters of MALA. While RAM usage of sCCA and NMF is negligible, MALA requires large amounts of RAM. Multiple runs of MALA can easily be parallelized; however, the parallelization of MALA runs is limited by the amount of available RAM.
Future work
The wealth of available integrative methods calls for a systematic and comprehensive method comparison study including as many approaches as possible, representing different algorithm types. Moreover, future comparisons should aim to use well-understood experimental data sets with homogeneous biological samples under supervised clinical treatment. Additionally, data simulations with large numbers of features are needed. The potential impact of comparison studies is to provide researchers with a resource to look up the results of specific methods applied to the same simulated and experimental data sets. Furthermore, the data sets should be made available, so that new methods may be applied to them, and results can be directly compared with those of the already existing methods. Finally, extensive comparison studies will guide the researcher’s decision of which method to use for a particular study.
Conclusion
The integrative analysis of two different types of omics data with sCCA, NMF and MALA enables a direct comparison of findings and points out the main differences of these methods. sCCA and NMF are able to detect DE features in the simulated, data and the results of all three methods applied to the experimental breast cancer data from TCGA are suitable for classifying samples. The lack of extensive congruences between results suggests that the methods tend to discover different types of patterns. Ideally, the set of features characterizing a data set and accounting for the differences in experimental conditions should be small; however, the evaluation on simulated data demonstrates that the methods are not able to identify DE features when the predefined number of variables to select is small. The fact that methods might be used to extract a small set of features from large data sets in practice, while they perform best when the number of extracted variables is large, tends to be largely overlooked, but it might well explain the small overlap between the method results on experimental data. If one of the methods under comparison has to be chosen, we would recommend sCCA, as on the synthetic data, it performs best in identifying DE features, and it is most likely to reveal perturbed pathways. Additionally, sCCA is the least computational intensive method with an execution time on the order of seconds, even on large data sets.
Comparisons of integrative analysis approaches, combining multiple information levels provided by multiple omics technologies, are rare and in great demand.
We evaluate three methods for the integrative analysis of omics data sets, sCCA, NMF and MALA each of which are based on different mathematical concepts.
In a comprehensive data simulation study, we assess the ability of sCCA, NMF and MALA to identify DE features.
The feature sets resulting from the application of methods to experimental breast cancer data are suitable for classifying samples, but the overlapping proportion of features jointly identified by all methods is only 16%.
We point out differences in the methods concepts and discuss possible reasons for the moderate overlap of identified feature sets with each other and with curated cancer signatures.
Bettina Pucher is a research associate in Gerhard Thallinger’s group at the Institute of Computational Biotechnology at Graz University of Technology and has been funded by the Omics Center Graz, which is part of the BioTechMed-Graz, Austria initiative.
Oana Zeleznik is a postdoctoral research fellow in the Channing Division of Network Medicine at Brigham and Women’s Hospital and Harvard Medical School. She is a former member of Gerhard Thallinger’s group at Graz University of Technology, Austria.
Gerhard Thallinger is a principle investigator at the Institute of Computational Biotechnology at Graz University of Technology, Austria and Deputy Speaker of the Omics Center Graz, which is part of the BioTechMed-Graz, Austria initiative.
Acknowledgements
The authors wish to thank Aedín Culhane for her valuable comments on data simulation and Emanuel Weitschek and Giovanni Felici for their kind support with MALA. The results shown here are in part based on data generated by the TCGA Research Network: http://cancergenome.nih.gov/.
Funding
This work was supported by the Austrian Ministry of Science, Research and Economy (HSRSM grant Omics Center Graz, to G.G.T.), the BioTechMed-Graz Initiative (Flagship project EPIAge to G.G.T), and by Amazon Web Services Cloud Credits for Research (grant to O.A.Z.).
References
Author notes
Oana A. Zeleznik and Gerhard G. Thallinger contributed equally to this work.
