


Abstract
Elite upland rice cultivars have the advantages of less water requirement along with high yield but are usually susceptible to various diseases. Rice blast caused by Magnaporthe oryzae is the most devastating disease in rice. Identification of new sources of resistance and the introgression of major resistance genes into elite cultivars are required for sustainable rice production. In this study, an upland rice genotype UR0803 was considered an emerging source of blast resistance. An F2 mapping population was developed from a cross between UR0803 and a local susceptible cultivar Lijiang Xintuan Heigu. The individuals from the F2 population were evaluated for leaf blast resistance in three trials 7 days after inoculation. Bulked segregant analysis (BSA) by high-throughput sequencing and SNP-index algorithm was performed to map the candidate region related to disease resistance trait. A major quantitative trait locus (QTL) for leaf blast resistance was identified on chromosome 11 in an interval of 1.61-Mb genomic region. The candidate region was further shortened to a 108.9-kb genomic region by genotyping the 955 individuals with 14 SNP markers. Transcriptome analysis was further performed between the resistant and susceptible parents, yielding a total of 5044 differentially expressed genes (DEGs). There were four DEGs in the candidate QTL region, of which, two (Os11g0700900 and Os11g0704000) were upregulated and the remaining (Os11g0702400 and Os11g0703600) were downregulated in the susceptible parent after inoculation. These novel candidate genes were functionally annotated to catalytic response against disease stimulus in cellular membranes. The results were further validated by a quantitative real-time PCR analysis. The fine-mapping of a novel QTL for blast resistance by integrative BSA mapping and transcriptome sequencing enhanced the genetic understanding of the mechanism of blast resistance in upland rice. The most suitable genotypes with resistance alleles would be useful genetic resources in rice blast resistance breeding.
Introduction
Rice (Oryza sativa) is a staple and the most important food crop, feeding more than half of the world’s population (Fang et al. 2019; Kalia and Rathour 2019). It is grown in both upland and lowland areas of many countries in Asia, Europe and Africa (Fongfon et al. 2021). China is among the top producers and consumers of rice grains. Here, the upland rice has a significant contribution to total rice production and also plays an important role in crop rotation in the South to northern areas of the country (Fongfon et al. 2021). It provides various economic benefits regarding fertilizers in rotation with potato, wheat and maize in various parts of the country. The productivity of upland rice is often limited by various constraints, including biotic and abiotic stresses (Chumpol et al. 2018). Rice blast caused by Pyricularia grisea (synonymous Pyricularia oryzae; teleomorph Magnaporthe grisea) is considered one of the most devastating biotic stresses due to its destructive influences and extensive distribution in various vegetative parts of the plant throughout the crop life cycle. During the vegetative growth stage, it is typically characterized by spindle-shaped lesions on the leaf blade and necrotic lesions at leaf collar (Kalia and Rathour 2019). It spreads quickly in rainy seasons and can cause up to 80 % yield loss in favourable conditions (Chumpol et al. 2018; Wangsawang et al. 2019; Kumar et al. 2021). Therefore, searching for resistant genetic resources of rice and developing control strategies against the continuously evolving pathogens of leaf blast are key research topics in rice.
The development and use of genetically resistant rice varieties are the most economical and effective way to control the disease (Chumpol et al. 2018; Fongfon et al. 2021). Exploration and exploitation of effective sources of resistance genes and their fine-mapping in the rice genome is a basic step towards effective manipulation of these genes in resistance breeding programmes. Since the first genetic study for rice blast in 1922 (Sasaki 1922), 118 genes have been mapped and 28 genes have been cloned (Ashkani et al. 2016; Fang et al. 2019; Kalia and Rathour 2019). A significant chromosome-specific linkage for resistance genes has been reported on chromosomes 6, 11 and 12 (Ning et al. 2020). The major clusters or quantitative trait loci (QTLs) for leaf blast resistance were observed on chromosomes 6, 11 and 12 of rice harbouring 21, 27 and 27 genes, respectively, while the minimum number of resistance genes (one gene on each chromosome) was observed on chromosome 3 and 7 (Chen et al. 2016; Fang et al. 2019; Kalia and Rathour 2019; Meng et al. 2021; Mishra et al. 2021). The first successful tagging of blast resistance genes was reported for Pi-b (Miyamoto et al. 1996). The Pi2 cluster on chromosome 6 has been reported for the four successfully cloned genes (Pi2, Pi9, Pi-gm and Piz-t) (Fang et al. 2019; Kalia and Rathour 2019; Meng et al. 2021; Mishra et al. 2021). Among the 27 mapped genes on chromosome 11, six genes (Pik, Pik-h, Pik-m, Pik-p, Pi1 and Pi-ke) were located in Pik cluster (Wu et al. 2012; Chen et al. 2015; Zhang et al. 2016; Fang et al. 2019; Meng et al. 2021; Mishra et al. 2021). The functional evaluation of the majority of cloned resistance genes revealed their role to encode the nucleotide-binding site–leucine rich repeat proteins (Fang et al. 2019). The Pi-d2 was reported to encode a B-lectin receptor kinase (Kouzai et al. 2013), while the recessive gene pi21 encodes a proline-rich protein (Fang et al. 2019), Bsr-d1 encodes a C2H2-type transcription factor protein (Li et al. 2017), and Bsr-k1 encodes a tetratricopeptide repeats-containing protein (Zhou et al. 2018). Up till now, the most economic and effective way to control leaf blast disease is introducing and pyramiding the resistance genes into susceptible elite cultivars (Fang et al. 2019; Kalia and Rathour 2019). Various resistance genes (Pi1, Pi5, Piz-5, Pita and Pi-gm) have been introgressed into elite cultivars by the marker-assisted selection method (Deng et al. 2017; Kumar et al. 2021). However, few genes were effective in the control of leaf blast resistance specifically in upland rice. Hence, the identification of novel QTL/gene(s) is required for broader spectrum blast resistance in rice.
Bulked segregant analysis (BSA) (Liang et al. 2014) is a cluster separation analysis which refer to the use of two parents with contrasting target traits to construct families and the selection of offspring with parental phenotypes. Bulked segregant analysis has been used as an alternative approach to genome-wide association analysis for complex traits in segregating populations (Ehrenreich et al. 2010). It has been proven an easy and efficient technique to reveal large-effect QTLs and/or genes for quantitative traits (Liu et al. 2012).
Transcriptome sequencing includes the entire repertoire of transcripts in a species, representing functionally expressed biological information in the genome with respect to target traits (Rani and Sharma 2017). With the rapid development of massively parallel sequencing or next-generation sequencing and the maturation of analytical tools during the last few years, the whole-transcriptome analyses to reveal the differentially expressed genes (DEGs) have become a significant tool to evaluate the contrasting traits (Wolf 2013; Chase et al. 2021; Ghimire et al. 2021). It is an important tool to pinpoint candidate genes involved in important agronomic traits.
The objective of this study was to detect new QTLs and candidate genes for blast resistance using the upland rice genotype UR0803 as a novel source of blast resistance. We mapped the leaf blast resistance QTL and candidate genes in UR0803, and further fine-mapped using the BSA approach and characterized the candidate genes by transcriptome analysis. The study will be helpful and will be a reference for the utilization of this genotype and the candidate genes in rice breeding for blast resistance.
Materials and Methods
Plant materials and growth
An upland rice blast-resistant cultivar UR0803 and -susceptible rice variety Lijiang Xintuan Heigu (LTH) (Singh et al. 2014) were acquired from Guizhou Institute of plant protection, China. Lijiang Xintuan Heigu is a very popular rice genotype in China (Singh et al. 2014) while UR0803 is a local farm rice variety resource collected in Youmai Village, Youmai Township, Wangmo County, Qianxinan Prefecture, Guizhou Province in 2008 (longitude 105.59.879ʹ, latitude 25.03.353ʹ, altitude 738 m). It is locally called precocious dry waxy. To explore the resistance potential and the QTL/gene(s) related to blast resistance in UR0803, the F1, F2 and BC1F1 segregating populations were designed from the cross of UR0803 and LTH. The F2 population was subjected to QTL mapping for blast resistance. The parental genotypes, F1 and BC1F1 hybrids, and the F2 mapping population were grown at Guizhou Institute of plant protection experiment station (Jinzhu Town, Xiaohe District, Guiyang City, Guizhou Province, China) in 2019, 2020 and 2021. Each time, the experiment was laid out in the randomized complete block design (RCBD) with three replications. The plants were grown in two rows per plot. The parent genotypes were grown adjacent to the plots, as resistant and susceptible controls, respectively. At the three leaves stage, the leaves of these plants were inoculated with Magnaporthe oryzae for evaluation of blast resistance.
Inoculation and resistance evaluation
The Guizhou M. grisea compulsory strain 07-91-1 from Guizhou, China was used for inoculation in this study, which was provided by Guizhou Institute of plant protection, China. The F2 individuals and two parents were inoculated with the pathogen by a spray method as previously described (Fang et al. 2019). Three leaves per plant and five plants for each line were inoculated with conidial suspension (3 × 10⁴ conidia per mL). Disease severity rate (for leaf blast) was evaluated based on a visual assessment of disease severity employing the standards of the International Rice Research Institute (score from 0 to 9, where 0 = no lesion; 1 = small brown specks; 3 = small necrotic brown spots, about 1–2 mm; 5 = infection of 4–10 % of the leaf area; 7 = infection of 26–50 % of the leaf area; and 9 = infection of greater than 51 % of the leaf area, in which many leaves are dead) (Chumpol et al. 2018).
Statistical analysis
The analyses of genotypic and environmental variances in accordance with RCBD were performed in SPSS v19. Three years were considered to evaluate the environmental effect. The frequency distribution among the resistant and susceptible plants was estimated and drawn in Microsoft Excel 2010. The observed and expected Mendelian ratio for frequency distribution was validated by chi-square test at the threshold of 0.99 confidence of interval.
BSA for QTL mapping
The DNA pools of 30 disease-resistant and 30 -susceptible individuals of the F2 generation [seeSupporting Information—Table S1] were constructed, respectively. In order to further locate the rice blast resistance genes, a high-throughput BSA sequencing was performed and the SNP-index algorithm (Üstünkar et al. 2012) was used to obtain the candidate region related to disease resistance in upland rice (Fig. 1).
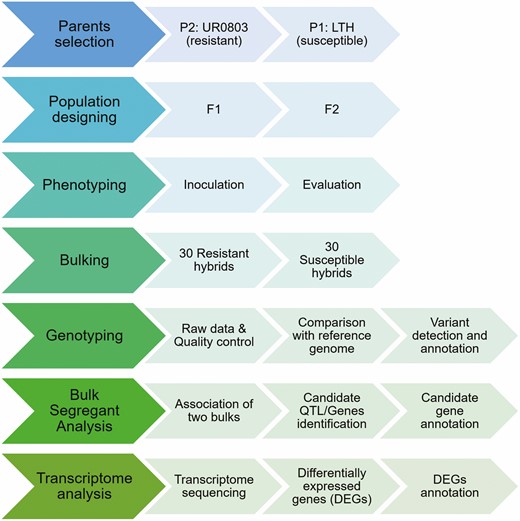
Flow chart diagram of scheme for bulk sergeant analysis to explore the upland rice UR0803 as a resistance source for rice blast.
Bulked DNA sequencing and evaluation.
Sample detection.
In order to ensure the quality of the DNA library, the genomic DNA was detected and evaluated with three threshold criteria. (i) Agarose gel electrophoresis detection showed the complete and clear main band of genomic DNA, and there was no degradation and RNA contamination. (ii) The ratio of optical density (OD) 260/280 detected by Nanodrop ranged from 1.8 to 2.2, and there was no contamination of protein and visible impurities. (iii) The detection concentration of Qubit 3.0 was greater than 20 ng μL−1, and the total amount was more than 2 μg.
Library construction.
The purified genomic DNA of the samples was used to construct the library as per the protocol developed for the high-throughput SNP typing method. It was performed in the four major steps; (i) designing the target site-specific primers, and mixing the primers according to the site information for mapping; (ii) taking genomic DNA as a template, and using KAPA2G Fast Multiplex Mix to amplify the target site; (iii) adding the sequencing adapters by secondary PCR; and finally (iv) pooling all the PCR products and purified them with AMPure XP Beads.
Library quality control and on-machine sequencing.
The constructed libraries were further used for the quality assessment and sequencing. The quality standards were obtained by: (i) using Qubit3.0 for preliminary quantification; (ii) using Agilent 2100 to detect the insert size of the library with no linker contamination; (iii) using the German ANALYTIKJENA (Jena) QTOWER real-time fluorescent quantitative PCR instrument to accurately quantify the effective concentration of the library, the effective concentration threshold was maintained for >2 nM. The library was pooled according to the target offline data volume, and paired-end 150-bp (PE150) sequencing was performed on the Illumina HiSeq platform.
Genotyping, sequencing data and bulk segregant analyses.
Cleaning raw data and extraction of SNP and InDel markers.
Raw sequencing data were subjected to quality enhancement by script-based (using C Script) analysis. The reads with (i) more than 10 % of N bases (undetermined bases), (ii) base quality value less than 5 in a read that accounts for more than 50 % of the bases, (iii) more than 10 linker sequence bases, allowing base mismatch rate to be within 10 % and/or (iv) redundant sequences caused by PCR in the process of library construction were removed to get the clean reads for further analyses. The BWA software (Li and Durbin 2010) was used to compare for mapping and alignment of the sequencing data with the reference genome, and SAMTOOL (Danecek et al. 2021) was used to convert the comparison results into a BAM file. The mutation (InDels) and variants (SNPs) detection and markers filtration from all samples were performed by GATK (version 4.1.4) software (McKenna ,et al. 2010). The ANNOVAR software (Wang et al. 2010) was used to analyse the SNP according to the ‘gff’ file of the reference genome, and InDel to get the VCF file. The polymorphic markers among two parental genotypes were then identified, and their index value of paternal alleles in the two mixed (BSA) pools was calculated. The sliding window processing on the markers of the whole gene was performed by default strategy of 1 Mb to 10 kb to exclude individual false-positive points. The average index value of the selected markers was estimated and used to calculate the ΔSNP index between the two mixed pools to locate the candidate QTL.
Fine-mapping and prediction of candidate genes.
A high-throughput SNP typing technique was performed for fine-mapping of disease resistance genes in the candidate QTL region. Eighteen SNP sites evenly distributed in the candidate region were selected, and their amplification primers were designed by Primer3 software using standard parameters (Table 1). Meanwhile, the ePCR program (Iacumin et al. 2020) was used to detect the amplification specificity of these primers to ensure that each pair of primers only amplifies the target site. Fourteen selected SNP markers were used to genotype and screen all of the 955 individual plants in the F2 population for identification of recombinant events. The genotypic data and the recombinant genotypes were further evaluated for exact estimation of the candidate gene region. The selected region was mapped against the Rice Annotation Project Database (https://rapdb.dna.affrc.go.jp/) to find the candidate genes and their annotations.
The SNP markers and their primers used to shorten the candidate QTL region on chromosome 11 for rice blast resistance.
| Name | Position | Reference allele | Alternate allele | Forward primer | Reverse primer | Product size | ePCR product details | |
|---|---|---|---|---|---|---|---|---|
| 1 | V000652 | 27 594 376 | A | G | TGAAGCAGTTCAATCCCCTTGT | GCAGTAGATGTCACAACAACTCA | 76 | Chr11_+_27594353_27594428_0_0_76 |
| 2 | V000943 | 27 643 915 | G | A | CTGAGTCCTAAATGATTCCTCC | TCCAGTGTGTGTTTGCTATT | 90 | Chr11_+_27643893_27643982_0_0_90 |
| 3 | V001248 | 27 671 082 | G | A | TCCGCTATCATCAACAGC | AGGATGCCATGAAGTACCT | 80 | Chr11_+_27671064_27671143_0_0_80 |
| 4 | V001856 | 27 705 656 | A | G | AGCAGCTCAGAGTATAGCCA | GGCCATTACAGCTTTGCACA | 79 | Chr11_+_27705625_27705703_0_0_79 |
| 5 | V003234 | 27 823 925 | G | A | TCATGGCCTCGAAAGGTTGA | TCCTCTTCTCTGTCTTAAGATGT | 70 | Chr11_+_27823884_27823953_0_0_70 |
| 6 | V004520 | 27 996 638 | T | C | ATGGCACTCAAAAAGGCCTC | TGACACAAGGTTATCGATTT | 76 | Chr11_+_27996609_27996684_0_0_76 |
| 7 | V008885 | 28 485 963 | G | A | TACATCTACCAGCTGCCCAT | TTGTATGTCCTTCCAGGGTAGC | 77 | Chr11_+_28485918_28485994_0_0_77 |
| 8 | V009560 | 28 640 344 | T | C | TGCCAACTACGGTATAGGTTGC | CGCAAGGAAGGGTATAAAATCCT | 76 | Chr11_+_28640298_28640373_0_0_76 |
| 9 | V010425 | 28 715 509 | T | G | AGCAACATCCACTGGAAGCT | TCTCATCATGTCTCAACCTCACA | 75 | Chr11_+_28715458_28715532_0_0_75 |
| 10 | V010563 | 28 743 785 | C | T | TTTAGTAAAGTGCCCGCGCA | GCATGTCCACTAAATAGTCATCA | 80 | Chr11_+_28743761_28743840_0_0_80 |
| 11 | V011893 | 28 824 438 | A | C | CATCTGTAGATGTTGGCAAAC | TGCCTATTCATTGTGAAGTCA | 79 | Chr11_+_28824417_28824495_0_0_79 |
| 12 | V012072 | 28 847 850 | G | A | AATTCAAGAGCAATTCTACA | ACCTCATGGTACCTAGGTACTGT | 108 | Chr11_+_28847822_28847929_0_0_108 |
| 13 | V012234 | 28 867 805 | T | C | ATGACTGTCTTGCGATTCAA | CACGCATCGAATTCAGGTTCA | 74 | Chr11_+_28867768_28867841_0_0_74 |
| 14 | V012491 | 28 894 574 | G | A | TGCGCGACGATTCAGTGATA | TCCCCAAAAATATCTGAGATG | 72 | Chr11_+_28894524_28894595_0_0_72 |
| 15 | V012708 | 28 936 971 | G | A | TTCTCCTAGCTAGCTTGTCCCT | ACTCGACCTTACAAGTGTCGT | 78 | Chr11_+_28936918_28936995_0_0_78 |
| 16 | V012878 | 28 980 529 | G | T | ACACATAAACTTTCAACGTTTTC | GTGTATTTAGTTCACACCAA | 78 | Chr11_+_28980498_28980575_0_0_78 |
| 17 | V013013 | 29 000 230 | A | G | AGCCCTGCACAATGACAA | CTCGTTTTTAAGGCAGTGGGT | 71 | Chr11_+_29000209_29000279_0_0_71 |
| 18 | V013232 | 29 011 816 | A | G | TGCACGTAACTTGTGACTGGA | AAGTGACGACATGCATGGCT | 70 | Chr11_+_29011772_29011841_0_0_70 |
Transcriptome analysis
The RNA samples from blast-resistant genotype UR0803 and -susceptible genotype LTH were collected at different growth stages after inoculation and the expression analysis was performed to identify the DEGs.
RNA extraction and transcriptome sequencing.
The leaf samples were collected from disease-resistant (UR0803) and -susceptible (LTH) parents at 0, 24, 48 and 72 h after inoculation for RNA sequencing. The total RNA was extracted by RNAsimple Total RNA Kit (Tiangene, China). The step-by-step process including, the total RNA quantification, mRNA enrichment, double-strand cDNA synthesis, end repair, splice selection, quality assessment for the PCR amplification library and sequencing was performed at MajorBio Company Limited, Shanghai, China.
Expression evaluation and identification of DEGs.
The bowtie2 v 2.3.4 program (Langmead and Salzberg 2012) with zero mismatch parameter was used to compare the reads to the assembled transcriptome. The results were compared with RSEM 2 (v 1.3.1) (Li and Dewey 2011). The number of reads counts on each gene was obtained from each sample and the gene expression level was estimated by the reads per kilobase of transcript per million mapped reads (RPKM) method. The differential gene expression was analysed by comparing read count data from the two subspecies using the DESeq2 program (Anders and Huber 2010) with the Q-value < 0.05 and log2 fold change > 1 as a threshold.
Functional annotation of DEGs.
The functional annotation of genes was performed by mapping the genes to the Kyoto Encyclopaedia of Genes and Genomes (KEGG) (Kanehisa et al. 2021), and gene ontology (GO) (Ashburner et al. 2000; Camon et al. 2004) databases. The results from DEG analysis, candidate region analysis and the functional annotation evaluation were visualized by Microsoft Office (Excel and PowerPoint) 2010 and the R-program v 4.2.0.
Expression validation by quantitative real-time PCR
The DEGs were further evaluated by qRT–PCR. Total RNAs were extracted from fresh leaf samples with the Easy Spin RNA kit (Aidlab, Beijing, China). The quality of RNA samples was assessed by 1 % agarose gel electrophoresis, while the quantity or concentration of RNA was estimated as per A260/A280 wavelength absorption ratio on the ultraviolet spectrophotometer measurement. The 1.5 μg of RNA was reverse-transcribed by Superscript III kit (Invitrogen, Carlsbad, CA, USA) for cDNA synthesis. The quantitative real-time PCR was performed using SYBR green mixture on an ABI 7500 real-time PCR detection system following the descriptions of Dossa et al. (Komivi et al. 2018). Each 20 μL reaction mixture included 10 μL of 2× SYBR qPCR Master Mix, 6 μL of nuclease-free water, 2 μL of primer (10 mM) and 2 μL of 4-fold diluted cDNA. The cDNA evaluation was triplicated. The denaturation at 95 °C for 30 s, followed by 40 cycles of 95 °C for10 s, and then annealing and synthesis at 60 °C for 30 s was set as reaction profile. The Ubiquitin gene was used as an internal control for normalization. The previously reported method developed by Livak and Schmittgen (2001) was employed for the data analysis.
Results
Characterization of resistance to leaf blast in rice
The upland rice cultivar UR0803 resistant to rice blast was used as a donor for disease resistance genes and crossed to the susceptible rice variety Lijiang Xintuan Heigu (LTH) to develop a mapping population. All the F1 individuals were resistant to blast; therefore, the F2 segregating population was generated. The characterization for blast resistance in parental genotypes, F1 hybrids and the F2 population was performed by inoculation with blast compulsory strain 07-91-1 at the three leaves stage. The UR0803 was clearly observable as a resistant genotype in all three replicates (Fig. 2); while among the 160 individuals in the F2 population 124 were resistant and 36 were susceptible indicating a clear 3:1 frequency distribution (Table 2). The frequency distribution ratio was non-significantly different from the Mendelian monohybrid F2 segregation ratio which clearly indicated the availability of a major gene contributing to the blast resistance in the mapping population.
Pathogen infestation rate and plants resistance evaluation for parental and hybrid individuals, and segregating populations for rice blast resistance.
| Population | Individuals | Resistant (R) | Infected (S) | Disease rate (%) |
|---|---|---|---|---|
| P1 (Lijiang Xintuan Heigu) | 17 | 17 | 100 | |
| P2 (UR0803) | 21 | 21 | 0 | |
| F1 | 22 | 22 | 0 | |
| BC1F1 | 20 | 16 | 4 | 20 |
| F2 | 160 | 124 | 36 | 22.5 |
| Population | Individuals | Resistant (R) | Infected (S) | Disease rate (%) |
|---|---|---|---|---|
| P1 (Lijiang Xintuan Heigu) | 17 | 17 | 100 | |
| P2 (UR0803) | 21 | 21 | 0 | |
| F1 | 22 | 22 | 0 | |
| BC1F1 | 20 | 16 | 4 | 20 |
| F2 | 160 | 124 | 36 | 22.5 |
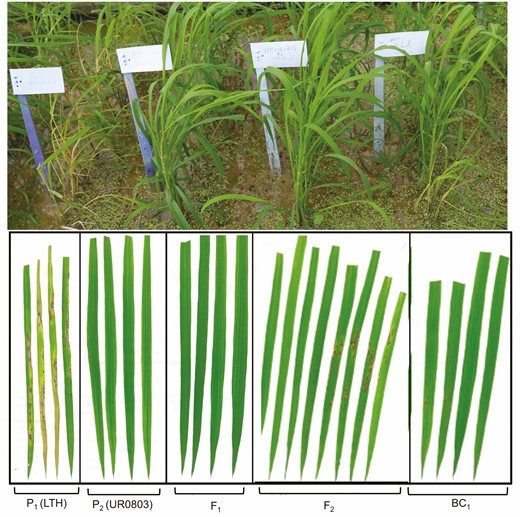
Phenotypic evaluation of susceptible Parent P1 (LTH), resistant Parent P2 (UR0803), their F1, F2 and BC1F1 populations.
BSA and fine QTL mapping of blast resistance by sequencing
A high-throughput BSA sequencing study was carried out to map the rice blast resistance gene(s). The DNA pools of 30 disease-resistant and 30 -susceptible individuals from the F2 generation were constructed [seeSupporting Information—Table S1], respectively. A total of 50.98 GB of sequencing data was obtained which was reduced to 50.38 GB of cleaned data after filtering. The sequencing depth was 13.6× for parental genotypes while 38.8× for the bulked samples. The average comparison efficiency with the reference genome was 98.52 % with 97.4 % coverage and 26.2× average coverage depth. Finally, a total 1 185 756 SNPs and 135 021 InDels were obtained [seeSupporting Information—Tables S2andS3]. A marker density of 1 SNP/363 bp and 1 InDel/3.185 kb of the rice genome was obtained. The computer simulation analysis of SNP index between two sequence pools at a confidence of 0.99 revealed the candidate region in 1.61 Mb ranging from 26 796 502 bp to 28 410 281 bp position on chromosome 11 (Fig. 3; seeSupporting Information—Fig. S1). High-throughput BSA sequencing along with SNP-index algorithm yielded a candidate region related to disease resistance within the interval of 27 670 000–29 018 559 bp on chromosome 11, which was right- and left-flanked by the SNP markers RM2136 and RM244, respectively (Fig. 3A). The candidate region contains 110 genes. The region was characterized by 1393 non-synonymous mutant SNPs and 124 InDel sites.
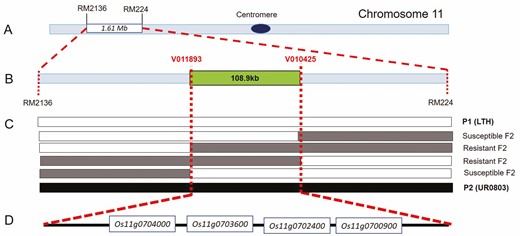
Bulked segregant analysis revealed a blast resistance QTL in upland rice; (A) primary BSA showed a QTL on long arm of the chromosome 11 (the flanking markers are RM2136 and RM224); (B) fine-mapping of candidate QTL by SNP typing (the flanking SNP markers are V011893 and V010425); (C) overlapped mapping analysis of candidate QTL with key recombinants indicating the locus. Empty, lightly filled and dark filled bars represent homozygous fragment from P1 (LTH), heterozygous fragment and homozygous chromosomal fragment from P2 (UR0803), respectively; (D) the four DEGs between two parental genotypes in the QTL region, revealed by transcriptome analysis.
In order to further shorten the candidate genomic interval, a high-throughput SNP genotyping technique based on fine-mapping of disease resistance genes was carried out for all the 955 plants of the F2 population. Fourteen SNP markers (Fig. 3B) were developed and used to genotype the mapping population. Finally, the target region was determined between the markers V010425 and V011893 from recombinant individuals (Fig. 3C). The total candidate interval was shortened to 108.9 kb, containing 39 candidate genes [seeSupporting Information—Table S4].
Transcriptome evaluation, DEGs and their functional annotation
Transcriptome sequencing.
The leaf tissue samples (three biological replicates) from resistant and susceptible parental genotypes were collected for the whole-transcriptome sequencing. The DEG analysis was performed to find the candidate gene(s) in the QTL region. A total of 64.76 million raw reads were obtained with 61.67 million clean reads (Table 3; seeSupporting Information—Table S2).
Data summary for transcriptome assembly of RNA samples collected after 0, 24, 48 and 72 h of inoculation from the upland rice blast-resistant and -susceptible parents.
| Samples | Repeat | Q30 (%) | Unique reads (%) | GC (%) | Raw reads | Clean reads | Clean and raw reads ratio (%) | Raw base (Gb) | Clean base (Gb) | Clean and raw base ratio (%) |
|---|---|---|---|---|---|---|---|---|---|---|
| 0-h LTH | 1 | 98.95 | 47.55 | 49.5 | 49 240 246 | 46 712 896 | 94.87 | 7.39 | 6.85 | 92.69 |
| 2 | 99.05 | 48.05 | 49 | 48 281 596 | 45 769 318 | 94.8 | 7.24 | 6.71 | 92.68 | |
| 3 | 99.05 | 45 | 49.5 | 56 395 208 | 53 535 626 | 94.93 | 8.46 | 7.85 | 92.79 | |
| 0-h UR0803 | 1 | 99.05 | 49.95 | 49.5 | 48 955 216 | 46 643 676 | 95.28 | 7.34 | 6.82 | 92.92 |
| 2 | 99.05 | 47.65 | 49.5 | 52 714 584 | 50 204 548 | 95.24 | 7.91 | 7.34 | 92.79 | |
| 3 | 98.95 | 47.7 | 49.5 | 53 531 286 | 50 672 832 | 94.66 | 8.03 | 7.4 | 92.15 | |
| 24-h LTH | 1 | 99 | 48 | 50 | 58 199 992 | 55 455 778 | 95.28 | 8.73 | 8.11 | 92.9 |
| 2 | 99.05 | 47.1 | 50 | 50 672 010 | 47 919 584 | 94.57 | 7.6 | 7.03 | 92.5 | |
| 3 | 99.05 | 45.65 | 49.5 | 60 282 596 | 56 914 450 | 94.41 | 9.04 | 8.34 | 92.26 | |
| 24-h UR0803 | 1 | 99.05 | 51.55 | 49 | 56 410 656 | 53 713 286 | 95.22 | 8.46 | 7.83 | 92.55 |
| 2 | 98.85 | 53.25 | 49.5 | 45 682 162 | 43 303 802 | 94.79 | 6.85 | 6.32 | 92.26 | |
| 3 | 99 | 51.5 | 49.5 | 49 045 986 | 46 535 696 | 94.88 | 7.36 | 6.79 | 92.26 | |
| 48-h LTH | 1 | 99.05 | 54.15 | 49.5 | 48 229 216 | 45 820 738 | 95.01 | 7.23 | 6.7 | 92.67 |
| 2 | 99.05 | 51.7 | 49.5 | 61 317 586 | 58 218 536 | 94.95 | 9.2 | 8.5 | 92.39 | |
| 3 | 99.1 | 53.45 | 49.5 | 53 459 344 | 51 166 006 | 95.71 | 8.02 | 7.49 | 93.39 | |
| 48-h UR0803 | 1 | 99 | 51.05 | 49 | 44 124 690 | 41 990 836 | 95.16 | 6.62 | 6.17 | 93.2 |
| 2 | 99.05 | 50.05 | 49.5 | 50 339 648 | 48 082 746 | 95.52 | 7.55 | 7.04 | 93.25 | |
| 3 | 99 | 48.75 | 49.5 | 53 975 892 | 51 390 380 | 95.21 | 8.1 | 7.53 | 92.96 | |
| 72-h LTH | 1 | 99.05 | 50.55 | 49 | 55 903 836 | 53 525 032 | 95.74 | 8.39 | 7.85 | 93.56 |
| 2 | 99 | 49.7 | 49 | 58 985 338 | 56 305 662 | 95.46 | 8.85 | 8.24 | 93.11 | |
| 3 | 98.95 | 52.1 | 49.5 | 50 968 700 | 48 660 396 | 95.47 | 7.65 | 7.12 | 93.07 | |
| 72-h UR0803 | 1 | 99.1 | 46.3 | 49.5 | 64 759 242 | 61 668 734 | 95.23 | 9.71 | 9.05 | 93.2 |
| 2 | 99.1 | 46.7 | 49.5 | 63 239 318 | 60 252 470 | 95.28 | 9.49 | 8.82 | 92.94 | |
| 3 | 99.1 | 50.25 | 49.5 | 54 466 208 | 52 034 410 | 95.54 | 8.17 | 7.63 | 93.39 |
Differential expression and functional enrichment analyses of genes.
A non-standard normal distribution was observed for RPKM values-based gene expression level among the samples. There was a total of 5044 genes observed to be differentially expressed in the resistant parent (UR0803) and susceptible parent (LTH) at 72 h after inoculation. Among these DEGs, 423 were on chromosome 11 (Fig. 4; Table 4), out of which four DEGs including two upregulated (Os11g0700900, Os11g0704000) and two downregulated (Os11g0702400, Os11g0703600) genes detected as candidate genes in this study. All candidate DEGs showed a signification expression variation with −log (P) values ranging from 7.02 to 25.20 (seeSupporting Information—Table S5; Fig. 5).
Differentially expressed genes between susceptible (LTH) and resistant (UR0803) under various treatments including 0, 24, 48 and 72 h after inoculation.
| Treatment* | Expression regulation | DEGs in chromosome | ||||||||||||
|---|---|---|---|---|---|---|---|---|---|---|---|---|---|---|
| 1 | 2 | 3 | 4 | 5 | 6 | 7 | 8 | 9 | 10 | 11 | 12 | Total | ||
| L0 vs. U0 | Up | 279 | 172 | 163 | 151 | 101 | 123 | 117 | 118 | 99 | 115 | 174 | 97 | 1709 |
| Down | 509 | 379 | 444 | 350 | 312 | 294 | 257 | 217 | 158 | 207 | 251 | 190 | 3568 | |
| Total | 788 | 551 | 607 | 501 | 413 | 417 | 374 | 335 | 257 | 322 | 425 | 287 | 5277 | |
| L24 vs. U24 | Up | 440 | 310 | 275 | 264 | 182 | 229 | 219 | 181 | 165 | 171 | 212 | 131 | 2779 |
| Down | 493 | 359 | 382 | 371 | 276 | 280 | 257 | 230 | 164 | 195 | 246 | 184 | 3437 | |
| Total | 933 | 669 | 657 | 635 | 458 | 509 | 476 | 411 | 329 | 366 | 458 | 315 | 6216 | |
| L48 vs. U48 | Up | 587 | 493 | 477 | 357 | 330 | 345 | 316 | 283 | 197 | 228 | 332 | 235 | 4180 |
| Down | 412 | 309 | 308 | 299 | 199 | 225 | 208 | 174 | 156 | 139 | 214 | 153 | 2796 | |
| Total | 999 | 802 | 785 | 656 | 529 | 570 | 524 | 457 | 353 | 367 | 546 | 388 | 6976 | |
| L72 vs. U72 | Up | 279 | 213 | 180 | 155 | 124 | 170 | 141 | 164 | 94 | 130 | 201 | 119 | 1970 |
| Down | 467 | 313 | 361 | 296 | 249 | 241 | 242 | 186 | 148 | 159 | 219 | 193 | 3074 | |
| Total | 746 | 526 | 541 | 451 | 373 | 411 | 383 | 350 | 242 | 289 | 420 | 312 | 5044 | |
| U0 vs. U24 | Up | 141 | 83 | 105 | 123 | 72 | 70 | 72 | 44 | 60 | 70 | 88 | 51 | 979 |
| Down | 236 | 156 | 155 | 152 | 96 | 100 | 119 | 94 | 93 | 87 | 122 | 87 | 1497 | |
| Total | 377 | 239 | 260 | 275 | 168 | 170 | 191 | 138 | 153 | 157 | 210 | 138 | 2476 | |
| U0 vs. U48 | Up | 617 | 404 | 474 | 420 | 285 | 338 | 287 | 253 | 237 | 223 | 309 | 210 | 4057 |
| Down | 851 | 671 | 793 | 548 | 484 | 454 | 441 | 388 | 306 | 296 | 326 | 332 | 5890 | |
| Total | 1468 | 1075 | 1267 | 968 | 769 | 792 | 728 | 641 | 543 | 519 | 635 | 542 | 9947 | |
| U0 vs. U72 | Up | 477 | 315 | 344 | 298 | 223 | 269 | 237 | 200 | 161 | 166 | 243 | 204 | 3137 |
| Down | 580 | 445 | 524 | 369 | 358 | 313 | 283 | 284 | 188 | 217 | 239 | 220 | 4020 | |
| Total | 1057 | 760 | 868 | 667 | 581 | 582 | 520 | 484 | 349 | 383 | 482 | 424 | 7157 | |
*In treatments ‘L’ stands for LTH, and ‘U’ stands for UR0803; 0, 24, 48 and 72 indicate that the RNA samples collected after 0, 24, 48 and 72 h after inoculation of Magnaporthe oryzae.
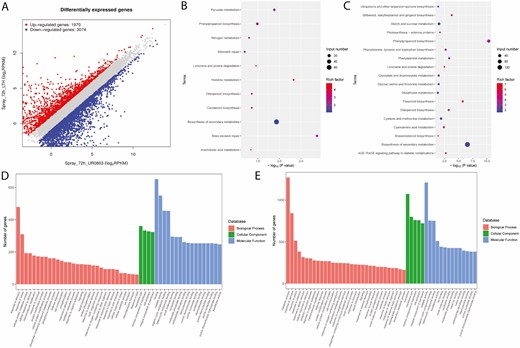
Transcriptome analysis for the samples collected form resistant and susceptible parents at 72 h after inoculation; (A) plotting the DEGs; (B) top enriched KEGG pathways for upregulated and (C) downregulated DEGs; (D) top enriched gene ontological (GO) terms for upregulated and (E) downregulated DEGs.
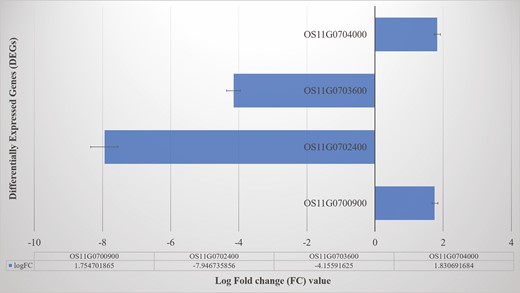
Differentially expressed genes and their log fold change (logFC) values between susceptible (LTH) and resistant (UR0803) rice genotypes.
Candidate genes in fine-mapped region and their functional annotation.
Among the identified DEGs, four were located in the mapped QTL region in this study: (i) Os11g0702400 was downregulated in the sensitive parent after inoculation and annotated for zinc finger, C2H2-type domain-containing protein involved in response to stimulus, nucleic acid bind, regulation of gene expression and metabolic processes like ontological processes; (ii) Os11g0703600 was also downregulated in the sensitive parent after inoculation and annotated for conserved hypothetical protein in membrane and membrane-bounded organelles; (iii) Os11g0700900 was upregulated in the sensitive parent after inoculation and annotated for glycoside hydrolase, catalytic core domain-containing protein functional for responses to various stresses and environmental factors; and (iv) Os11g0704000 was upregulated in the sensitive parent after inoculation and annotated for seleno-protein (SelT/SelW/SelH) family protein to be expressed in intracellular membrane-bounded organelles [seeSupporting Information—Tables S4–S7].
Validation of RNA analysis by qRT–PCR
To validate the expression of identified DEGs for blast resistance in the mapped QTL region, all four up-, and downregulated genes were selected and used for qRT–PCR expression profiling. The qRT–PCR results of the selected genes were consistent with that of RNA-Seq analysis (Pearson correlation = 95 %) (Fig. 6). This result supports the DEG analysis and subsequent interpretations.
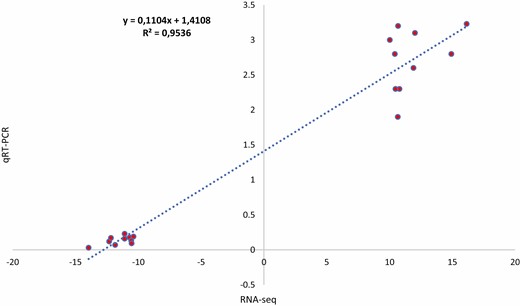
Pearson correlation analysis of the expression profile of the four candidate genes between qRT–PCR and RNA-Seq.
Discussion
The development of resistant varieties is one of the most adopted ways to protect crops from biotic stresses. Nevertheless, it is not a durable method as the resistance in elite varieties often diminishes within a few years of being released (Mishra et al. 2021). The causal fungus for rice blast M. oryzae is continuously evolving due to environmental changes, resulting in natural mutations with a significantly high mutation rate (Mishra et al. 2021). Therefore, the induction of blast resistance in rice remains challenging. Although the trait is not durable, the resistance caused by a single major gene may remain effective for many years (Mishra et al. 2021). Therefore, it is imperative to understand the regulation of plant defence mechanisms, identification of novel sources of durable resistance as well as determine the functional genes and controlling elements responsible for the effectiveness and breakdown of resistance.
Resistance to blast disease is also known to be host-specific and the identified resistance genes have been reported to be effective against specific strains of M. oryzae (Mishra et al. 2021). Hence, the traditional rice varieties are known to possess one or two dominant genes (Mishra et al. 2021). Historically, the rice genotype PS2 containing at least two dominant genes Pi-b and Pi54 (Rahim et al. 2013; Tanweer et al. 2015) and IR64 containing Pi genes (Windarsih and Utami 2017) have been widely used as a source for blast resistance in the development of high-yielding rice cultivars (Mishra et al. 2021). Nonetheless, the genetic resources for blast resistance in upland strains are still less reported. In this study, a blast-resistant upland rice genotype was evaluated. It was used as a donor parent of rice blast resistance allele to develop the mapping population. Thereby, it resulted in the mapping of a major QTL on chromosome 11 followed by fine-mapping of four candidate genes.
Previously, different populations of diverse rice germplasm have been screened with various molecular markers such as SSR, InDel, SNP and gene-specific markers that have been reported for most of the mapped and cloned blast resistance genes. It has been shown that the diverse germplasm had resistant marker alleles (Mishra et al. 2021). However, it has been observed that many of these markers are non-functional for blast resistance breeding in rice. It may be due to the lack of tightly linked markers to the candidate genes. To overcome this shortcoming, SNP markers were obtained from the high-throughput sequencing of DNA pools of resistant and susceptible genotypes in this study. The BSA and SNP marker-based genotyping resulted in the identification of a very short QTL region (108 kb) as compared to previous reports on QTL mapping in rice (Wang et al. 2016).
The high-throughput sequencing of cDNA obtained from extracted RNA of plant tissues has become an important technique to explore gene expression and the DEGs among various treatments and genotypes (Zhang et al. 2021). In this study, the expression analysis revealed four DEGs located in the fine-mapped candidate region. Two of them were upregulated and the other two were downregulated in the susceptible plant after inoculation. None of these genes has been reported previously, indicating the novelty of candidate QTL for leaf blast resistance. The locus is situated close to the previously reported R-gene cluster that has been mapped on the telomeric end of rice chromosome 11 containing at least nine resistance genes of which seven genes were the alleles of a single gene Pi-k locus (Hua et al. 2012; Singh et al. 2015; Fang et al. 2019; Fongfon et al. 2021; Mishra et al. 2021). A similar report has also been found in which a QTL qPbh-11-1 was mapped in the Pi-k gene cluster (Wu et al. 2013). A major leaf blast resistance gene Pi-hk1(t) has also been identified from the donor genotype Heikezijing (Wu et al. 2013). Another gene Pi-jnw1 conferring the panicle and leaf blast resistance has been identified from a japonica landrace Jiangnanwan on chromosome 11 between markers RM27273 and RM27381 (Wang et al. 2016).
Among the downregulated candidate genes, Os11g0702400 was annotated for zinc finger, C2H2-type domain-containing protein involved in various gene ontological processes including the response to stimulus, nucleic acid bind, regulation of gene expression and metabolic processes. Previously, a gene Bsr-d1 encoding C2H2-type transcription factor protein has also been reported to confer broad-spectrum blast resistance in rice (Li et al. 2017). Its downregulation could inhibit the degradation of H2O2 resulting in the enhanced blast resistance in rice (Fang et al. 2019). Hence, the available upland germplasm and the resistant hybrid individuals from the F2 population used in this study for the QTL/gene mapping may a useful genetic resource for durable blast resistance in upland rice.
Conclusions
The study aimed at mining QTLs for blast resistance in the upland rice UR0803 as a novel source of blast resistance. Using an integrative approach of BSA, SNP genotyping and transcriptome analysis, we successfully identified a novel candidate QTL and four candidate genes linked to blast resistance in rice. The novel QTL region will be useful for the development of durable resistance to rice blast. The functions of its underlying genes should be analysed to better understand the varying levels of resistance exhibited against the blast isolates. The identification of blast resistance genes in this study contributes to the genetic understanding of disease resistance and will help for marker-assisted breeding against blast resistance in upland rice.
Supporting Information
The following additional information is available in the online version of this article—
Table S1. List of parental genotypes along with 30 most resistant and 30 most susceptible individuals from F2 mapping population for bulked segregant analysis.
Table S2. Summary of sequencing data for bulked segreant analysis (BSA) from the blast-resistant and -susceptible DNA pools obtained from upland rice mapping populations.
Table S3. Characterization descriptive in candidate region of quantitative trait locus (QTL) mapping by comparison of sequences from resistant and susceptible parents.
Table S4. List of 39 candidate genes and their functional annotations in mapped quantitative trait locus (QTL) region.
Table S5. List of 423 differentially expressed genes between resistant and susceptible parents on chromosome 11.
Table S6. Functional annotation of four candidate genes in gene ontology and Kyoto Encyclopaedia of Genes and Genomes (KEGG) databases.
Table S7. The genomic variants, their alternate alleles, and physical position in candidate genes.
Figure S1. Chromosome-wide SNP index estimated by two sequence pools; index1 indicates susceptible pool; index2 indicates resistant pool; while Delta indicates the variation of SNP index between two pools.
Phenome, Genome & Environment. Chief Editor: Colleen Doherty
Sources of Funding
This work was financially supported by the National Natural Science Foundation of China (31672057) and the Natural Science Foundation of Guizhou Province (qian[2018]1156).
Conflict of Interest
None declared.
Acknowledgements
Not applicable.
Contributions by the Authors
Q.T., H.H., and X.Y. designed the experiments. Q.T., H.H., and W.C., L.H., and D.Z. performed the experiments. Q.T., H.H., X.C., and J.L. analyzed the data. X.Y. supervised the study. Q.T. wrote the manuscript. X.Y. revised the manuscript. All authors read and approved the final manuscript.
Data Availability
The raw sequencing data have been submitted to NCBI SRA under the project numbers: PRJNA754205 (transcriptome) and PRJNA795286 (BSA).
Literature Cited
Author notes
These authors contributed equally to this work.

Comments