


Abstract
Nutrient resorption from senescing tissue is a key mechanism for plants to conserve nutrients, and can affect the nutrient dynamics of ecosystems. Yet, our limited knowledge of nitrogen (N) resorption and release from mosses hampers our understanding of the role of mosses as N sources and, thereby, N cycling in moss-dominated ecosystems. The aims of this study were to estimate N resorption efficiency (NRE) of two moss species, identify the pathways of N release from the mosses and to provide a better understanding of N cycling and budgeting strategies of mosses.
The dynamics of N allocation along annual moss segments of two dominant moss species (Actinothuidium hookeri and Hylocomium splendens) were assessed in old-growth fir forests using an in situ15N tracer experiment.
The NRE of A. hookeri and H. splendens was 61 and 52 %, respectively. While the mosses lost 23 and 33 % N from live tissues via leaching, 15 and 14 % of N remained in senesced tissues (>3 years old) in A. hookeri and H. splendens, respectively.
Both mosses resorbed the majority of their tissue N, but a considerable amount of N was lost from live segments. Our results highlight the crucial role mosses play as N sinks in ecosystems, since N retention (resorbed and sequestered in senescent tissue) outweighed N loss via leaching. However, the sink strength depends on temperature and precipitation, which will change in a future climate. The values for NRE, leaching, etc. estimated here can help improve biogeochemical models aiming to complete N budgets for moss-abundant ecosystems.
Introduction
Nitrogen (N) translocation from mature or senescing plant tissues to other living parts, i.e. resorption, is a key mechanism for plants to conserve N and affects N release to the soil (Aerts, 1996; Killingbeck, 1996). Consequently, resorption influences plant growth, soil N availability and, thereby, ecosystem nutrient cycling (Killingbeck, 1996; Yuan and Chen, 2009). Previous studies found that >50 % of plant leaf N is recycled via resorption (Aerts, 1996; Vergutz et al., 2012). However, our understanding of resorption comes primarily from studies focusing on vascular plants. To what extent non-vascular plants such as mosses recycle N via resorption remains largely unknown, despite their large contribution to biomass and ground cover in many managed and pristine ecosystems. This knowledge gap limits our understanding of how mosses affect nutrient cycling in ecosystems where they are the dominant understorey functional group. For instance, mosses comprise most of the understorey in sub-alpine and boreal coniferous forests (Zackrisson et al., 2004; Liu and Bao, 2014; Liu et al., 2015), where net primary productivity is limited by the availability of N (Vitousek and Howarth, 1991). With an uptake rate of up to 90 % (Aldous, 2002), the dense moss carpet is efficient in capturing atmospheric deposited N (Turetsky, 2003). In addition, most mosses are colonized by N2-fixing bacteria, contributing up to 50 % to N input in these pristine ecosystems (DeLuca et al., 2002; Rousk and Michelsen, 2017). Thus, mosses play a crucial role in the N budgets of N-limited ecosystems where N input via deposition is low (Gundale et al., 2011). However, it is not known how efficient mosses are in their N use characteristics, such as N resorption and release, although this significantly impacts N cycling in forest ecosystems.
Similar to the well-described N resorption of vascular plant leaves, several pieces of evidence show that N resorption is important for mosses in terms of N retention. Internal nutrient transport over short distances is found via conducting cells in the common boreal forest moss Hylocomium splendens (Sokolowska et al., 2017). Eckstein and Karlsson (1999) found significant translocation of N from 3-year-old segments to current-year segments in H. splendens, and Aldous (2002) found that N translocation contributes up to 11 % of the annual N requirements of Sphagnum mosses. Eckstein (2000) found that H. splendens resorbed about 78 % of N from senescing segments in a 2 year experiment. These studies suggest that mosses are efficient in nutrient recycling and share a similar nutrient use strategy with woody evergreen vascular plants (Eckstein, 2000). However, Lang et al. (2014) found that <20 % of N was resorbed into living moss parts in several sub-arctic mosses. The large span of moss resorption estimates between studies hints at species-specific N resorption efficiencies (NREs; percentage of the N pool resorbed) and at different pathways of N loss in different moss species. It has been suggested that slow-growing species are more conservative in terms of nutrient use than their counterparts (Reich, 2014; Rea et al., 2018), which could be reflected in differences in NREs.
As plants are senescing, besides resorbed N, a certain quantity of internal N remains in the senesced tissue. Mosses produce decay-resistant litter with low N concentration (Britton et al., 2018). The poor litter quality results in slow decomposition rates, which affect N release and ecosystem N turnover (Hobbie, 2015). On the other hand, mosses typically have simple one cell thick leaves and lack cuticles. As a result, they are sensitive to microclimate changes, such as wet–dry and freeze–thaw cycles (Melick and Seppelt, 1992). During these transitions, tissue nutrient pools are prone to leaching (Gupta, 1977; Brown and Buck, 1979; Wilson and Coxson, 1999). Coxson (1991) suggested that nutrient loss via leaching from epiphytic bryophytes is greater than nutrient loss from tree litter and detrital release in a tropical cloud forest for elements such as potassium. Melick and Seppelt (1992) found that up to 65 % of the total sugar pool was lost during repeated freeze–thaw cycle treatments due to membrane damage. Moss leachates contain readily soluble nutrients, e.g. amino acids (Coxson et al., 1992; Gupta, 1977) and other forms of N (Rousk and Michelsen, 2016). The release of N via leaching from live moss as a result of freeze–thaw cycles can be particularly important in early spring to support growth of neighbouring plants, and thus potentially has a major impact on a variety of ecosystem processes (Coxson, 1991). Yet, N leaching from live moss has been mostly overlooked.
Taken together, as moss tissue senesces, the acquired N (from deposition, N2 fixation, etc.) has three main fates (Fig. 1): (1) to be resorbed into new tissue; (2) to remain in the senesced tissues, but being lost by (slow) decomposition or by leaching from dead tissues; or (3) to be lost via leaching from live tissues and released to the environment. Despite the critical role of understorey mosses in forest ecosystems in terms of N cycling, no attempt has been made to separate and evaluate the three possible fates of acquired N, although this may control primary productivity in moss-dominated and N-limited ecosystems.
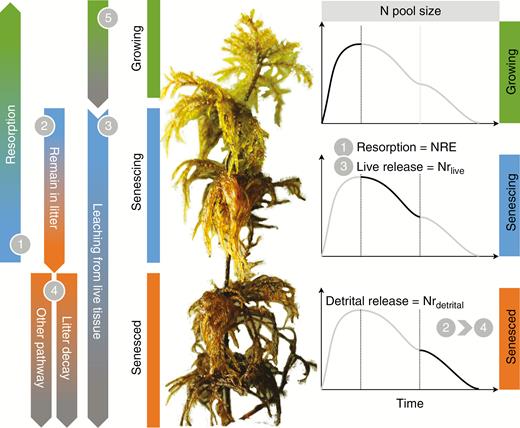
Conceptual framework depicting the fates of tissue nitrogen (N) of understorey mosses during tissue senescence. A perennial moss shoot is comprised of a number of interconnected segments of different ages. These sections could be classified into three types according to their living status: growing sections (indicated with a green bar), mature and senescing sections (indicated with a blue bar) and senesced sections (indicated with an orange bar). The line chart to the right of each type shows the changes in terms of N pool size with time. There are three possible fates or pathways (pathways 1, 2 and 3) of tissue N in the mature and senescing sections, which are indicated with a blue bar. A portion of N will be resorbed to younger sections (pathway 1), and the percentage of resorbed N to the total N pool size is the N resorption efficiency (NRE). A portion of N will remain in the tissue (pathway 2), and will be released by subsequent decomposition or other detrital processes (pathway 4). The percentage of N remaining in senesced tissue is indicated as Nrdetrital. A portion of N will be released via leaching from live mature tissue (pathway 3). The percentage of this portion of N is defined as Nrlive. Similar to pathway 3, a portion of N will be released from growing tissue (pathway 5). Overlooking this portion of N results in an underestimation of NRE.
To fill this knowledge gap, we performed an in situ15N labelling experiment and traced the 15N allocation across years in two dominant moss species, Actinothuidium hookeri (Mitt.) Broth. and Hylocomium splendens (Hedw.) B. S. G. (Supplementary data Fig. S1) in an old-growth fir forest, eastern Tibetan Plateau. The studied species are weft pleurocarpous mosses and dominant in the ground layer of the forest. Actinothuidium hookeri is endemic to eastern Asia, whereas H. splendens is one of the most abundant and extensively studied mosses in the boreal forest and sub-alpine forest across North America, north Europe and the northern part of Asia. Although they are similar in life form, A. hookeri has a lower photosynthetic rate (0.017 vs. 0.031 μmol CO2 g–1 s–1) and a lower growth rate (0.07 vs. 0.14 mm d–1) than H. splendens (Wang et al., 2007; Liu et al., 2015), suggesting differences in NRE. Here, we address the questions (1) to what extent is tissue N resorbed; (2) to what extent is N lost from live moss tissue; and (3) do the two moss species differ in their N resorption and retention? In order to disentangle the main fates of N in moss tissue, we measured 15N pools in each annual segment of moss tissue and examined 15N allocation among years. We hypothesize that (H1) the largest portion of tissue N will be resorbed, i.e. more than is lost from live tissue or remains in senesced tissue; (H2) a larger portion of N would be released from live tissue than remained in the senesced tissue; and (H3) due to a slower growth rate, A. hookeri will resorb more N than H. splendens.
MATERIALS AND METHODS
Study area
The experiment was performed in an old-growth fir forest in the Dagu Nature Reserve, Heishui County in Sichuan Province, China (32°14'N, 102°47'E, approx. 3700 m a.s.l.). The study area has a sub-alpine cold-temperate climate, which is characterized by wet, short summers and cold, dry winters, with an annual average temperature of 4.4 °C and precipitation of 620 mm. The minimum air temperature in winter (from November 1 to April 1) is –15.6 °C, and the mean diurnal range of air temperature in winter is 12.3 °C (Supplementary data Fig. S2). The forest is dominated by Abies fargesii var. faxoniana (Rehd. & E.H.Wilson) T.S.Liu and the canopy cover is approx. 49 %. Bryophytes are abundant and account for >60 % of the ground cover (Supplementary data Fig. S3).
Experimental design, sampling and chemical analysis
Five study patches, at least 30 m apart, were selected in August 2012. In each patch, two plots (50 × 50 cm), where A. hookeri and H. splendens were dominant, respectively, were selected. On 10 August 2012, each plot was wetted with 50 mL of water. After 1 h, 50 mL containing 5 mL of pre-dissolved 15NH415NO3 solution (containing 34.02 mg of 15NH415NO3, equivalent to 49.80 mg 15N m–2) was sprayed onto each plot using a hand sprayer, which is equivalent to 0.2 mm precipitation. The amount of 15N tracer was calculated according to Fry (2006) for a 5000 ‰ enrichment. The amount of added water was kept low to minimize changes in water availability within the moss layer.
All plots were harvested on three occasions to be able to follow the fate of N over time. We harvested 8 d (18 August 2012), 1 year (14 September 2013) and 3 years (14 September 2015) after the labelling. There was only light rain or drizzle during the period from labelling to the first harvest, and the first heavy rain after labelling occurred on 21 August. The plots were harvested by cutting 10 × 10 cm squares to a depth of 10–20 cm with underlying substrate. The harvested samples were transported to the laboratory in sealed plastic bags.
In the laboratory, other moss species and liverworts were carefully removed. The samples were rinsed with deionized water to remove possible nutrients adhering on the moss surface. Unbranched, intact shoots with both growing tips and senesced segments were selected. The numbers of selected shoots in each sample were counted (Supplementary data Table S1) and shoots were then divided into annual segments according to innate growth markers. Hylocomium splendens is known for forming annual segments and, in the case of A. hookeri, the annual growth can be recognized by bending of the stem (Tamm, 1953; Supplementary data Methods S1). The segments originated in 2010 and before that were not further divided into annual segments. The segments which originated in 2015, 2014, 2013, 2012, 2011 and before 2011 were referred to as S15, S14, S13, S12, S11 and SO, respectively. Thus, there were 130 sets of annual segments in total for the two species and five replicates: three types of annual segments (S12, S11 and SO) for samples harvested in 2012, four types of annual segments (S13, S12, S11 and SO) for 2013 samples and six types of annual segments (S15, S14, S13, S12, S11 and SO) for samples harvested in 2015. The segments were oven dried at 65 °C for 48 h and then weighed. The N and 15N concentrations were determined using a Vario Macro Cube Elemental Analyzer (Elementar, Germany) and IsoPrime100 IRMS (Isoprime, Manchester, UK).
Calculations
To disentangle the fate of 15N, we tracked the allocation of 15N among annual segments and sampling year. We calculated NRE, percentage of N lost to the environment via leaching from live tissue (Nrlive) as well as the percentage of N remaining in senesced tissue, which will be released successively by the detrital pathway (Nrdetrital), such as decomposition and leaching form senesced tissues in five steps.
First, we estimated the excess 15N pool size of each average annual segment by dividing the excess 15N pool size by the shoot count. Because only intact shoots without multiple branches were selected, the shoot count equals the number of segments. The excess 15N pool size was then calculated by subtracting the natural abundance from the measured 15N pool.
Biomassij is the biomass, NCij the total N concentration and 15NAPij is the 15N atomic percent of segment i harvested in the year j. The value of 0.366 % is the natural abundance of 15N. This is confirmed by three unlabelled samples. Shoot countj is the number of intact shoots harvested in the year j analysed for 15N.
Secondly, the decrease in the percentage of the 15N pool size between 2012 and 2015 was calculated as:
LossS12 is the percentage of 15N lost compared with the total 15N captured by the segments in 2012 (S12); PoolS12_Y2012 is the amount of 15N in S12 in the samples harvested in 2012; PoolS12_Y2015 is the amount of 15N remaining in the same segment, S12, in the samples harvested 3 years later, in 2015. Based on observation, S12 of both mosses turned brown (senesced) within 3 years. Given that S12 just senesced in 2015, the amount of N release through the detrital pathway should be minimal. The N loss through herbivory is also minor because no visual damage was found on any shoots. Thus, there are two pathways by which S12 lost 15N: by resorption to younger segments (Fig. 1 pathway 1) and/or via leaching (loss to the environment; Fig. 1 pathway 3). Nutrient loss via leaching from live tissue is largely associated with local climatic factors, such as the diurnal changes of temperature in winter and early spring, as well as the frequency and intensity of precipitation events (Melick and Seppelt, 1992; Wilson and Coxson, 1999). We assume that the annual N lost from live tissues is identical among years. The LossS12 can be expressed as:
aNrlive is the annual N lost from live tissue. The percentage of 15N remaining in senesced tissue, which will be released by detrital pathways (Fig. 1 pathways 2 and 4, Nrdetrital), can be calculated by the change of 15N pool in the S12 segment from 2012 to 2015:
Thirdly, we calculated the percentage of 15N retained in the live, green segments (S13, S14 and S15 segments) of the samples harvested in 2015:
RetentionGreen is the percentage of the 15N amount in the green segments of the samples from 2015 in relation to the total amount of 15N captured by the whole shoot in 2012; PoolGreen_Y2015 is the amount of 15N in the green segments of the samples harvested in 2015; and PoolAll_Y2012 is the amount of 15N captured by the whole shoot in samples from 2012. The 15N in the green segments of the samples collected in 2015 was the result of N resorption (Fig. 1 pathway 1), because all the green segments of those samples were formed after the labelling. In addition, a certain amount of the resorbed 15N should have been lost from these green segments (Fig. 1 pathways 3 and 5). Given that the average age of the green segments of samples collected in 2015 is 2 years, the RetentionGreen can be calculated as:
Fourthly, the NRE and aNrlive can be calculated using eqns (3) and (6).
Finally, because it takes 3 years for the mature segments to senesce, the overall 15N lost rate from live tissue can be calculated as:
Nrlive and aNrlive are the overall and annual percentage of net N lost from live tissues, respectively, since a certain amount of leached N is re-captured by the moss immediately, rather than lost (Startsev and Lieffers, 2006).
Statistical analyses
Data were tested for normality using Q–Q plots and for homogeneity of variance using Levene’s test before analyses of variance (ANOVAs). Two-way ANOVAs were used to test for differences in 15N pool sizes of each annual segment (S13, S12, S11 and SO) and whole shoots between harvest occasions (8 d, 1 year and 3 years) and species. One-way ANOVAs were used to test for differences in 15N pool sizes of S14 and S15 between the two species. We used a two-way ANOVA to test for differences in the fate of tissue N (NRE, Nrdetrital and Nrlive) between the two moss species. Interaction terms were removed from all two-way ANOVAs when they were not significant. Student–Newman–Keuls (SNK) tests were used for multiple comparisons of the means. All the analyses were carried out with R 3.2.3 (R Core Team, 2015).
RESULTS
The mean (± s.e.) excess 15N pool size of the two mosses, A. hookeri and H. splendens, were 526.5 (± 22.5) and 459.4 (± 64.7) nmol 15N per shoot (for both green and brown segments) in the 2012 samples, which were harvested 8 d after labelling. Three years after the labelling, those numbers decreased to 292.9 (± 47.6) and 138.0 (± 37.4) nmol 15N per shoot (again green and brown segments together, F1, 17 = 36.45, P < 0.001), and the 15N pool differed significantly between species (F1, 17 = 5.39, P = 0.033). Three years after the labelling, the 15N pools of the green segments were 239.3 (± 40.7) and 107.8 (± 27.2) nmol for A. hookeri and H. splendens, respectively, and differed significantly between species (F1, 17 = 10.30, P = 0.005). The 15N pools of the segment which originated in 2012 (S12) differed significantly between harvest occasions (F2, 24 = 25.37, P < 0.001), but not between species: the current year segment of 2012 samples captured 249.1 (± 6.8) and 245.2 (± 23.0) nmol excess 15N per shoot for A. hookeri and H. splendens, respectively, while only 37.4 (± 6.5) and 30.6 (± 7.8) nmol excess 15N were retained in the segments 3 years later (Fig. 2; Supplementary data Table S2). Thus, 15.1 % (± 2.7 %) and 14.2 % (± 4.8 %) of N were retained in the senesced tissue for the respective species.

Average amount of excess 15N (nmol 15N shoot–1; n = 5) in annual segments of the two mosses, Actinothuidium hookeri (A) and Hylocomium splendens (B), during three harvests (late August 2012, early September 2013 and early September 2015). The area of each circle is proportional to the amount of the corresponding segments’ excess 15N pool. ‘S15’–‘S11’ represent the segments originated in the years 2015–2011, respectively. ‘SO’ represents the moss segment originated in or before 2010.
Both moss species exhibited the ability to resorb N from the senescing tissues. The mean (± s.e.) NREs of A. hookeri and H. splendens were 61.7 % (± 3.4 %) and 52.2 % (± 3.2 %), respectively. Actinothuidium hookeri and H. splendens lost 8.7 % (± 2.3 %) and 13.3 % (± 3.3 %) of N from live tissue annually. Given the approx. 3 year life span of the segments, 23.2 % (± 5.7 %) and 33.6 % (± 7.3 %) of N was lost from live tissue during its lifetime for A. hookeri and H. splendens, respectively. The proportions of the N fates were significantly different from each other (F2, 26 = 36.98, P < 0.001): the NREs of both mosses were significantly higher than Nrlive and Nrdetrital, and Nrlive was significantly higher than Nrdetrital in H. splendens. Hence, most of the acquired N is recycled within the moss carpet. The two mosses did not differ significantly in terms of NRE, Nrlive and Nrdetrital (Fig. 3).
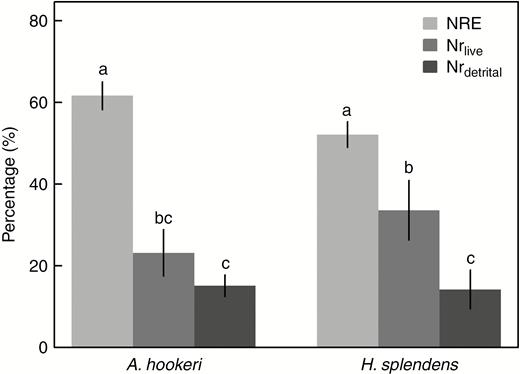
N resorption efficiency (NRE), N lost via leaching from live tissue (Nrlive) and N remaining in senesced tissue and lost via the detrital pathway (Nrdetrital) of Actinothuidium hookeri and Hylocomium splendens. Bars represent means ± s.e. (n = 5). Different letters indicate significant (P < 0.05) differences among species and N fates (SNK test) following two-way ANOVA.
Discussion
Excess 15N was found in all segments formed after the 15N labelling (Fig. 2), supporting earlier findings on N translocation of mosses (Eckstein and Karlsson, 1999; Aldous, 2002). The youngest, top segments typically held the largest amount of excess 15N, even though the segments were formed 3 years after the labelling. Hence, N resorption from senescing tissue can act as an N source for the growing tissue, corroborating the concept that nutrient demand drives nutrient resorption (Tully et al., 2013). In sub-alpine or boreal forests, ground-dwelling mosses generally grow upon their own senescent tissue and lack contact with the soil (Bates, 1992). As such, mosses are dependent on deposited nutrients, which come in irregular intermittent pulses (Bates, 1994; Aldous, 2002) and are in low concentrations in boreal and sub-alpine biomes. Consequently, the demand-driven N resorption is an important N source for mosses in supplying the newly grown tissue in N-limited ecosystems.
Nitrogen resorption efficiencies of the mosses
Our results show that the majority of tissue N is recycled during senescence (Fig. 2), supporting our first hypothesis (H1). Hence, the largest fraction of acquired N is retained within the moss carpet. The NREs of the studied mosses (Fig. 3) are comparable with that of vascular plants, which typically recycle >50 % of leaf N by resorption (Aerts, 1996; Yuan and Chen, 2009; Vergutz et al., 2012). This somewhat contradicts the idea that NRE should correspond to the degree of specialization of conducting tissue (Lang et al., 2014). We can give three plausible explanations for this contradiction. First, given the small stature of mosses, the distance of nutrient transport during resorption is much shorter for mosses than that for vascular plants. The network of plasmodesmata could serve as efficient structures for short-distance transport (Sokolowska et al., 2017). Secondly, vascular plants are mainly dependent on the soil N pool, which is continuous and stable, while atmospheric deposition has been considered as a major N source of forest floor mosses (Bates, 1994). The demand-driven N resorption plays a critical role in N supply to the growing moss tissue between N deposition events (Aldous, 2002). Thirdly, the somewhat similar NREs between the studied mosses and vascular plants confirm the notion that the NRE is determined by the cost of N resorption (Wright and Westoby, 2003). The energy cost of N resorption varies between the particular classes of compounds from which N is derived. The main N-containing compounds will be almost identical between mosses and vascular plants since they share the same metabolic activities, such as photosynthesis and respiration. The same energy constraints for resorbing specific N compounds should hold for mosses and vascular plants, resulting in similar NREs between the two groups. Given the N-limited habitat that they live in, mosses should resorb the majority of the fraction of N that is easy to hydrolyse and mobilize. This also results in decay-resistant litter of mosses, because the N-containing compounds remaining in senesced tissue will require more energy expenditure to hydrolyse (Wright and Westoby, 2003).
The NREs of our investigated moss species were much higher than those of sub-arctic mosses (<20 %), which were measured by comparing the nutrient concentrations of green vs. senesced tissues (Lang et al., 2014). Differences in environmental factors between mosses growing in forest systems and in open, sub-arctic tundra may influence the NRE. For instance, the forest canopy alters N deposition that reaches the understorey layer, which leads to different amounts of N input between the ecosystems, and thereby a different necessity for nutrient resorption. Furthermore, the method used by Lang et al. (2014), comparing N concentrations or pools of green vs. senesced tissues, does not take into account the fraction of resorbed N that was lost from live tissue. Release of N from the green, live segments after resorption can explain the contrast between the high NREs and the fact that 23–45 % of initially applied 15N remained in the green segments after 3 years.
Nitrogen loss from live moss tissues
Actinothuidium hookeri and H. splendens lost N, probably via leaching, from live tissue at the annual rate of 8.7 and 13.2 %, respectively. Eckstein (2000) reported that 0.6 μmol 15N per plot (9.2 %) was lost during 15 months from the initial 15N pool of 6.5 μmol 15N per plot in H. splendens. Gaseous N release may partly account for this, as some mosses are contributing to nitrous oxide (N2O) emission (Lenhart et al., 2015). However, measurements of gaseous N release from live mosses are uncertain, as mosses have also been found to take up, and not emit, N2O (Rousk et al., 2018). Thus, leaching during microclimate changes is likely to be the main cause of N lost from live tissue (Wilson and Coxson, 1999).
Mosses are known for their ability to retain nutrient ions on their outer surface, which are available for later uptake by the moss itself (Startsev and Lieffers, 2006). This release and re-capture process leads to the possibility that moss shoots can act as wicks, moving nutrients in leachate upwards via extracellular pathways (Aldous, 2002). While we cannot distinguish if the added 15N was only attached to the outer surface of the moss or actually taken up, this will not affect our estimates of to what extent live moss tissue loses N via leaching as all segments were processed with the same procedure.
The overall percentage of N lost from live tissue of H. splendens was higher than the percentage of N remaining in the senesced tissue (Fig. 3). This supports our second hypothesis (H2) that leaching losses from live tissue are greater than the portion of N retained in the senesced tissue. While there were no significant differences between Nrlive and Nrlitter in A. hookeri, a considerable percentage (23.2 %) of N was lost from live tissue. Moss litter typically shows low decomposability compared with vascular plants (Lang et al., 2009; Hagemann and Moroni, 2015), and thus limits nutrient cycling within forest ecosystems that are characterized by a thick moss carpet (Zackrisson et al., 1997). The relatively high rate of N release from live tissue might compensate for the low litter decomposition rate in terms of N supply. Nitrogen compounds are lost through the openings on the damaged cell membranes (Simon, 1974), and this process is largely dependent on climatic factors such as temperature and moisture conditions, which are extreme during dry–rewet and freeze–thaw events. For instance, N loss from mosses after drying and rewetting can increase soil N pools >10-fold compared with constantly moist moss (Slate et al., 2019). If mosses experience large fluctuations in their moisture content as a consequence of climate change (IPCC, 2014), the proportion of N released via leaching could be larger in the future. This will have significant effects on pristine ecosystems that are adapted to low N input.
N resorption and retention differences between the mosses
The results showed no significant differences of NRE between species, lending no support to our hypothesis (H3) stating that the slower growing A. hookeri should be more conservative in terms of N use than H. splendens. Albeit not significant, our results suggest small differences between the studied species. The green segments of A. hookeri held greater amounts of 15N 3 years after labelling than H. splendens (239.3 vs. 107.8 nmol, P = 0.019), and NRE of A. hookeri was slightly higher and Nrlive was lower than those of H. splendens, which might indicate N retention differences, but these were not significantly different. These results seem to stand in contrast to studies which found that A. hookeri has a higher shoot mass per area than H. splendens (Liu et al., 2015), which is associated with higher biomass investment in structural rather than metabolic components, implying a lower photosynthesis rate and tissue N concentration, reflecting a conservative strategy in nutrient use (Wang et al., 2017). It is reasonable that N resorption and loss simultaneously, instead of resorption alone, affect N retention of mosses. Moreover, there might be other factors, such as the ability to absorb N deposition, and the structure and density of the moss colony (Slate et al., 2019), affecting N retention and N use strategy, while these factors still remain to be studied.
We identified the capacity of two dominant forest floor mosses, A. hookeri and H. splendens, to resorb N, and disentangled the fates of their tissue N. Our analysis showed that the mosses can resorb a high percentage of acquired N, and a greater portion of N was lost from live tissue than remained in senesced tissue. Our findings suggest that understorey mosses are currently sinks of N due to their high NRE. This N sink, however, can turn into an N source due to the predicted changes in temperature and precipitation patterns that increase N losses from mosses during freezing–thawing and drying–rewetting events.
SUPPLEMENTARY DATA
Supplementary data are available online at https://dbpia.nl.go.kr/aob and consist of the following. Figure S1: photograph of single shoots of the two studied moss species, Actinothuidium hookeri and Hylocomium splendens. Figure S2: daily maximum and minimum air temperature of the forest from 11 August 2012 to 21 April 2013. Figure S3: photograph showing part of the experimental site. Table S1: number of selected moss shoots for Actinothuidium hookeri and Hylocomium splendens. Table S2: mean 15N pool size of each segment of the two moss species. Methods S1: measurement of moss annual growth
Funding
This work was supported by the National Natural Science Foundation of China [nos 31470023 and 31600357].
ACKNOWLEDGEMENTS
We thank Dr Defeng Feng for assistance with the field work, and Mr Huaxiang Tang and the Sichuan Dagu Nature Reserve Management Bureau for supporting the field research.
