


Abstract
A physiologically based pharmacokinetic (PBPK) modeling approach was used to simulate the concentration-time profile of ethanol (EtOH) in stomach, duodenum, plasma and other tissues upon consumption of beer and whiskey under fasted and fed conditions.
A full PBPK model was developed for EtOH using the advanced dissolution, absorption and metabolism (ADAM) model fully integrated into the Simcyp Simulator® 15 (Simcyp Ltd., Sheffield, UK). The prediction performance of the developed model was verified and the EtOH concentration-time profile in different organs was predicted.
Simcyp simulation showed ≤ 2-fold difference in values of EtOH area under the concentration-time curve (AUC) in stomach and duodenum as compared to the observed values. Moreover, the simulated EtOH maximum concentration (Cmax), time to reach Cmax (Tmax) and AUC in plasma were comparable to the observed values. We showed that liver is exposed to the highest EtOH concentration, faster than other organs (Cmax = 839.50 mg/L and Tmax = 0.53 h), while brain exposure of EtOH (AUC = 1139.43 mg·h/L) is the highest among all other organs. Sensitivity analyses (SAs) showed direct proportion of EtOH rate and extent of absorption with administered EtOH dose and inverse relationship with gastric emptying time (GE) and steady-state volume of distribution (Vss).
The current PBPK model approach might help with designing in vitro experiments in the area of alcohol organ damage or alcohol-drug interaction studies.
INTRODUCTION
The effect of drinking alcohol on drug absorption and bioavailability has received considerable attention (Lennernäs 2009; Bushra et al. 2011; Fagerberg et al. 2015). First, the effect of ethanol (EtOH) on different biochemical and physiological processes is concentration dependent; however, the time course or concentration-time profile of EtOH in various human tissues is not well-characterized. Second, EtOH alters the oral absorption of extended-release pharmaceuticals through altering dissolution of coating material, which may result in dose dumping (Darwish et al. 2015; Meyer and Hussain 2015; Newcorn et al. 2017). While interaction of EtOH with extended-release drug formulations has serious safety concerns, the US Food and Drug Administration (FDA) has recommended characterizing the effect of different concentrations of EtOH on in vitro dose dumping phenomenon (FDA 2019). Third, many interactions have been reported between EtOH and different therapeutic agents (Weathermon and Crabb 1999; Johnson and Seneviratne 2014). For instance, EtOH interactions with analgesics (Neutel and Appel 2000), antidepressants (Immonen et al. 2013), antibiotics (Larson et al. 2010), anticoagulants (Baker et al. 2004) and antidiabetics (Vasiliou et al. 1986) have been reported. Hence, bioavailability and tissue concentration of EtOH may impact pharmacokinetics of other therapeutics. Thus, information about EtOH in different tissues would enable better design of in vitro drug metabolism studies aimed at characterizing EtOH-drug interactions.
When EtOH is absorbed in the gastrointestinal (GI) tract, it undergoes two main oxidative (94–98%) and non-oxidative (0.1–0.2%) metabolic pathways (Jones 2019). Those include (i) reversible oxidative conversion to acetaldehyde catalyzed by alcohol dehydrogenases (ADH1A, ADH1B*1, ADH1C*2 and ADH4) (Lee et al. 2006; Zakhari 2006; Edenberg 2007) and cytochrome P450 2E1 (CYP2E1) (Forsyth et al. 2013) in liver and intestine (chronic drinkers), followed by irreversible oxidation to acetate and acetyl Co-A by aldehyde dehydrogenase 2 (ALDH2) (Crabb et al. 1989) and acyl-coenzyme A synthetase short-chain family member 2 (ACSS2) (Schug et al. 2015); (ii) EtOH involvement in sugars, amino and fatty acids through acetyl Co-A; (iii) oxidation via the tricarboxylic acid (TCA) cycle to CO2; and (iv) non-oxidative metabolism to fatty acid ethyl esters (FAEE) and phosphatidylethanol (Best and Laposata 2003). Figure 1 shows a schematic illustration of EtOH’s role in different metabolic pathways occurring in human GI tract and liver. In this scheme, EtOH oxidation to acetaldehyde and acetate (Fig. 1a), conversion of acetate to acetyl CoA (Fig. 1b) and acetyl CoA transformation to citrate and fatty acyl CoA (Figs. 1c and d) are shown. Apart from oxidative and non-oxidative metabolic pathways, 1–3% of total EtOH is eliminated unchanged from the body, through urine and breath (Jones 2019).
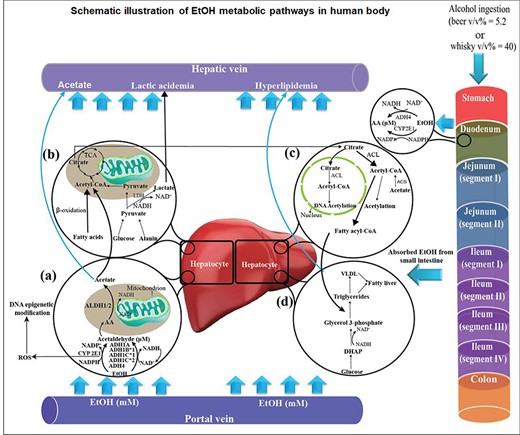
Schematic illustration of ethanol (EtOH) destination in human body after ingestion of alcoholic beverages. (a) EtOH is oxidized to acetaldehyde in hepatocytes through alcohol dehydrogenases (ADH1A, ADH1B*1, ADH1C*1 and ADH4) and cytochrome P450 2E1 (CYP2E1). Reactive oxygen species (ROS) are generated due to the interference of EtOH with electron transport complexes in mitochondrial membrane. Acetaldehyde is converted to acetate by aldehyde dehydrogenases (ALDH1/2). (b) Acetate is metabolized to acetyl CoA, which is considered as an important metabolic intermediate of the tricarboxylic acid (TCA) cycle and β-oxidation of fatty acids. (c) Citrate could be converted to acetyl CoA by ATP citrate lyase (ACL). The generated acetyl CoA may result in DNA acetylation or be involved in fatty acyl CoA production. (d) Fatty acyl CoA is associated with lipogenesis reactions, which results in triglycerides, very low density lipoproteins (VLDL) and, finally, alcoholic fatty liver in chronic alcoholic patients. The excess amount of EtOH in chronic alcoholic patients may result in elevated acetate in blood, lactic acidemia and hyperlipidemia.
The basic principles of EtOH pharmacokinetics were established in the 1930s, including the notion of zero-order elimination kinetics from blood and distribution of the absorbed dose into the total body water (Jones 2011). The actual site and magnitude of EtOH first-pass metabolism (FPM) in humans has remained controversial over the years. Some research studies confirmed that a significant fraction of administered EtOH is cleared by FPM, primarily in gastric mucosa. Julkunen et al. (1985) have shown that significant EtOH FPM in rat occurs in the GI tract, mainly due to the presence of ADH4 in stomach. However, other works suggested that the entire FPM of EtOH occurs in the liver, and gastric metabolism accounts for a small fraction of total EtOH clearance (Levitt et al. 1997).
EtOH concentration in different organs is difficult to measure experimentally, therefore development of an in silico model to predict the concentration-time profile of EtOH in human tissues is warranted. One of the most helpful theoretical approaches widely used in drug discovery and development is physiologically based pharmacokinetic (PBPK) modeling and simulation methodology (Jones et al. 2015). The concept of PBPK modeling was first introduced by Teorell (1937) and it developed rapidly during recent years, due to emergence of commercially available software, including Simcyp®, GastroPlus™ and PK-Sim® (Sjögren et al. 2016), and the ease of access to preclinical data (Zhuang and Lu 2016). PBPK modeling is a powerful tool in prediction of clinical data via evaluation of intrinsic (population properties and genetics) and extrinsic (drug–drug interaction) factors. This approach combines the physicochemical data for a compound with the predefined physiological and biological properties of a specific population, to obtain a mechanistic approach for that compound in the biological system (Kuepfer et al. 2016). PBPK models have been investigated to predict EtOH plasma concentration-time profile (Loizou and Spendiff 2004; Plawecki et al. 2008). However, to our knowledge, a well-validated PBPK model for the prediction of EtOH concentrations in the GI tract and different tissues is not available in the literature.
In the current study, a full PBPK model based on enzymatic elimination of EtOH was developed in Simcyp Simulator® 15 (Simcyp Ltd., Sheffield, UK) to predict the concentration-time profile of EtOH in human stomach, duodenum and plasma. Subsequently, the predicted EtOH concentration-time profiles were validated according to the corresponding observed values reported in the literature. Kinetic parameters, including area under the concentration-time profile (AUC), the highest concentration (Cmax) and time needed to reach Cmax (Tmax), were estimated. Moreover, the concentration-time profile of EtOH was predicted in gut, liver and brain after ingestion of common alcoholic beverages. Finally, the validated PBPK model was applied to predict the kinetic parameters of EtOH in various tissues.
METHODS AND MODELING APPROACHES
EtOH PBPK model development and validation
A whole-body PBPK model was constructed according to the Advanced Dissolution, Absorption and Metabolism (ADAM) model implemented in Simcyp® (Fig. 2a). The methodology and structure of the Simcyp® population-based PBPK modeling was described in detail, previously (Jamei et al., 2009a, 2009b, 2013). In this model, the GI tract is divided into nine parts including stomach, duodenum, jejunum I and II, ileum I-IV and colon. This model assumes that the body is composed of 13 tissue compartments and two blood compartments (arterial and venous pools). The overall process of model development, verification, validation and sensitivity analyses is presented in Fig. 2b. According to Fig. 2b, observed data for gastric and duodenal, as well as plasma EtOH concentration-time profiles, were collected simultaneously to validate model.
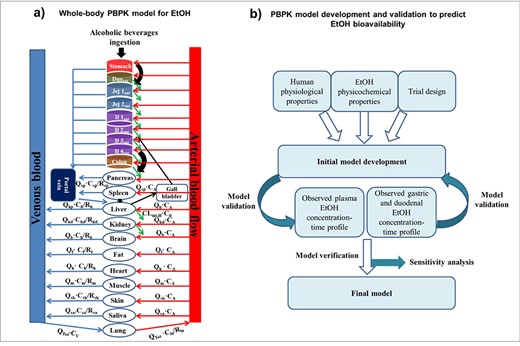
A whole-body PBPK model suggested for EtOH consumption. Abbreviation: Duoent (duodenum), Jejent (jejunum), Ilent (ileum), CA (arterial blood concentration), CV (venous blood concentration), QTot (total cardiac output), Qhp (blood flow perfusing the hepatic portal vein), R (tissue-to-blood partition coefficient), CLint,H (hepatic intrinsic clearance), b (brain), h (heart), li (liver), sp (spleen), lu (lungs), kd (kidney) f (fat), sk (skin), sa (saliva), and m (muscle).
Physicochemical properties, physiological/population details and trial design used for EtOH modeling have been summarized in Table 1. All anatomical and physiological parameters were modified according to the published literature (Table 1). The effect of age (ranging from 20 to 50 years old) and gender (Female ratio = 0.0, 0.5 and 1.0) on EtOH kinetic parameters were investigated. Moreover, the one-factor-at-a-time (OFAT) sensitivity analysis (SA) approach was conducted. Accordingly, SAs were performed to provide more insights on how EtOH concentration-time profile in plasma changes in response to EtOH dose (mg/kg body weight), mean gastric emptying time (GE, h) and steady state volume of distribution (Vss, L/kg) within a predefined range of estimations.
Physicochemical properties, physiological/population details and trial design for simulating the fasted and fed EtOH PBPK modeled in Simcyp®
| Input data to Simcyp® simulator | Parameters | Reference |
|---|---|---|
| Physicochemical properties | ||
| Molecular weight (g/mol) | 46.68 | |
| Log PO:W | −0.35 | |
| pKa | 15.9 | |
| Compound type | Neutral | |
| Blood/plasma binding ratio | 0.89 | |
| KD for HSA (μM) | 1000 | |
| Absorption model | ADAM | |
| Papp rat intestinal tissue (×10−6 cm/S) | 56.7 ± 14.8 | (Rubbens et al. 2017) |
| Polar surface area (Å2) | 20.23 | |
| Vss (L/Kg) | 0.69 | (Holford 1987) |
| Elimination | Enzyme kinetic (Table 2) | |
| Physiological/population details | ||
| Mean gastric emptying time (h) | 0.4 | (Franke et al. 2004; Mudie et al. 2014) |
| Initial volume of stomach fluid (ml) | 250 | (Mudie et al. 2014; Rubbens et al. 2017) |
| Weibull distribution of transit time | 2.92 (α) and 4.04 (β) | Simcyp |
| Mean small intestinal transit time (h) | 3.33 | Simcyp |
| Mean colon transit time (h) | 12 | Simcyp |
| Trial design and dosing regimen | ||
| Population | Human healthy volunteer | |
| No. of trials | 10 | |
| No. of subjects in trial | 10 | |
| Age range (years old) | 20–50 | |
| Proportion of females | 0.5 (0.0, 0.5 and 1.0) | |
| Standard adult body weight (kg) | 70 | (Emoto et al. 2015) |
| Fluid intake with dose (ml) | 500 (beer) and 80 (whisky) | (Rubbens et al. 2016, 2017) |
| Single dose (mg/kg body weight) | 325 (beer), 400 (whisky) and 800 | (Jones and Jönsson 1994b; Rubbens et al. 2016, 2017) |
| Proportion of dose inhaled (%) | 20 | (Levitt et al. 1997) |
LogP O:W (octanol:water partition coefficient), α and β are scale and shape parameters in Weibull distribution, respectively. HSA: human serum albumin, KD: dissociation constant of the EtOH-protein complex, Papp: apparent permeability, and Vss: steady-state volume of distribution.
According to the National Institute on Alcohol Abuse and Alcoholism (NIAAA), a standard drink unit (SDU) is defined as a drink that contains ~14 g of pure EtOH, which is roughly equivalent to 355 ml of beer, 148 ml of wine or 44 ml of distilled spirits (Zhuang and Lu 2016). While NIAAA defines specific patterns of drinking levels (i.e. moderate, binge and heavy) (National Institute on Alcohol Abuse and Alcoholism 2019), we have selected a virtual approach in our model according to Rubbens et al., (2016, 2017). In our study, ingestion of beer (325 mg EtOH/kg body weight, 1.625 SDU) and whisky (400 mg EtOH/kg body weight, 2 SDU) were modeled in fasted- and fed-states using a virtual population of healthy, adult male or female.
In all trial designs, standard adult body weight was set at 70 kg (Emoto et al. 2015). In the modeling of fed-state, a volume of 250 ml of liquid meal was applied and initial volume of stomach fluid was modified according to population details. Furthermore, other model input parameters, such as GE, initial volume of stomach fluid, volume of EtOH intake and dosage, were retrieved from the literature and used for model development (Table 1).
EtOH absorption, distribution and elimination
After oral ingestion of alcoholic beverages, EtOH is absorbed rapidly from GI tract via passive diffusion (Cederbaum 2012). The EtOH absorption starts from the mouth and continues along the GI tract. In fasted-state, about 15% of the initial EtOH dose is absorbed in stomach, with the remaining 85% passing on to the GI tract. In fed-state, 30% of EtOH is absorbed in stomach and the 70% remaining dose is emptied into the duodenum (Levitt et al. 1997). According to the ADAM model, EtOH oral absorption from luminal fluid to enterocytes is the first step of incorporation into an unstirred boundary layer (UBL) (Simcyp® manual). UBL is the layer of mucosa adjacent to epithelial cells that EtOH must penetrate before being absorbed. A permeability-limited membrane (basolateral side of enterocytes), which separates the enterocytes from intestinal interstitial fluid (ISF), is considered as the second step. Finally, a lymphatic route of absorption facilitates the EtOH entering systemic circulation.
Although the predominant site of EtOH metabolism is liver, the presence of ADH isozymes in mucosa of the stomach, duodenum and jejunum initiates the metabolism of EtOH before the liver (Chi et al. 2016). Although <2% of the ingested dose is metabolized by gastric ADH4 (Levitt et al. 1997), the presence of ADH4 in the stomach and upper GI tract may be responsible for EtOH metabolism prior to reaching the liver (Cederbaum 2012). While most of EtOH elimination occurs in the liver, <10% of EtOH is excreted from lung, kidney and skin. To fully model EtOH clearance from the body, we have assumed a breath clearance of 0.16 L/h, renal clearance of 0.06 L/h and sweat clearance of 0.02 L/h based on values reported by Holford (1987).
The Michaelis–Menten parameters of enzymes involved in EtOH metabolism
The PBPK model was developed considering saturable metabolism (Michaelis–Menten kinetic parameters) of EtOH by ADHs and CYP2E1. The Michaelis–Menten constant (Km) and maximum rate of enzymatic reaction at saturating EtOH concentration (Vmax), and tissue distribution of the enzymes involved in EtOH metabolism have been provided in Table 2. While many ADH isoforms with distinct kinetic parameters have been proposed to contribute to EtOH oxidative metabolism (Zakhari 2006; Edenberg 2007; Eng et al. 2007; Ramchandani 2013), recognizing the main EtOH metabolizing isoforms in the population of interest was crucial.
Michaelis–Menten kinetic parameters for the main involved enzymes in EtOH oxidation
| Enzyme | Km (μM) | Vmax (pmol. Min−1. mg −1 cytosolic protein) | Tissue distribution | Reference |
|---|---|---|---|---|
| ADH1A | 4000 | 12,780 | L | (Lee et al. 2006; Bhatt et al. 2017) |
| ADH1B*1 | 50 | 20,880 | L | (Lee et al. 2006; Bhatt et al. 2017) |
| ADH1C*1 | 1000 | 8600 | L, S, D, J | (Zakhari 2006; Edenberg 2007; Ito et al. 2014) |
| ADH4 | 30000 | 8000 | L, S | (Zakhari 2006; Edenberg 2007) |
| CYP2E1a | 8000 | 952 | L | (Lasker et al. 1987; Edenberg 2007; Hines 2008) |
Abbreviations: Km (Michaelis–Menten constant), Vmax (maximum rate of enzymatic reaction at saturating EtOH concentration), ADH (alcohol dehydrogenase), C (colon), L (liver), S (stomach), D (duodenum), J (jejunum), K (kidney), E (esophagus), and CYP2E1 (cytochrome P450 2E1). aCYP2E1 is upregulated by chronic alcohol use (Forsyth et al. 2013, 2014; Jin et al. 2013). Therefore, the activity of CYP2E1 in upper GI tract was not considered in our simulation for healthy subjects.
Genetic variants of EtOH metabolizing enzymes, specifically ADH1 polymorphisms, contribute to altered EtOH kinetics. Three types of ADH1 genes that are expressed in human populations are ADH1A, ADH1B and ADH1C (Edenberg 2007). Among them, the most important variants resulting in altered EtOH kinetics are ADH1B, including ADH1B*1, ADH1B*2 and ADH1B*3 (Edenberg 2007; Dasgupta 2015). ADH1B*2 is very common in East Asian populations, relatively common in Middle Eastern, and is very rare in European and African populations. Research shows that people who carry ADH1B*2 and ADH1B*3 alleles are less prone to develop alcohol use disorder (AUD), due to a protective effect of these alleles against excessive EtOH use. ADH1B*3 polymorphism is prevalent in African and African-American populations, but rare elsewhere (Ehlers 2007; Eng et al. 2007; Ramchandani 2013). Meanwhile, our PBPK model was developed based on the healthy, Caucasian human population, therefore the kinetic parameters for ADH1A, ADH1B*1, ADH1C*1 and ADH4 were applied that contributed for >70% of EtOH oxidation (Edenberg 2007; Dasgupta 2015). In addition, hepatic CYP2E1 was also considered for the model development (Kim et al. 1996; Cederbaum 2012).
Simulation of EtOH concentration in stomach, duodenum, plasma and other tissues
Concentration-time profiles of EtOH, in stomach and duodenum, after ingestion of common alcoholic beverages were predicted and compared to the observed data. EtOH concentrations in stomach and duodenum was measured in healthy human volunteers, using headspace gas chromatography, in fasted- (Rubbens et al. 2016) and fed-state (Rubbens et al. 2017) participants. In the fasted-state, three females and two males were enrolled, whereas in fed-state, one female and four males were studied (Rubbens et al. 2016, 2017). We have extracted numerical data from Rubbens et al. (2016, 2017), using a plot digitizer software (http://plotdigitizer.sourceforge.net), and have used the observed EtOH concentration-time profile to validate the simulated EtOH concentrations in GI tract. Moreover, using PBPK modeling, we have predicated plasma EtOH concentration-time profile and compared that to the observed data reported by Jones and Jönsson (1994b).
To support model validation, a 2-fold difference between simulated and observed values was considered acceptable (Jones et al. 2015) in all model validation steps. Consequently, the validated PBPK model was used to predict the concentration-time profile of EtOH in gut, liver, brain, kidney, pancreas, spleen, skin, heart, muscle and lung.
RESULTS
EtOH concentration-time profile in stomach and duodenum
A full PBPK model was developed for EtOH using the ADAM model integrated into the Simcyp Simulator®. This model was subsequently validated according to the experimental observations considering a <2-fold difference between observed and simulated data as acceptable predictive performance for most kinetic parameters.
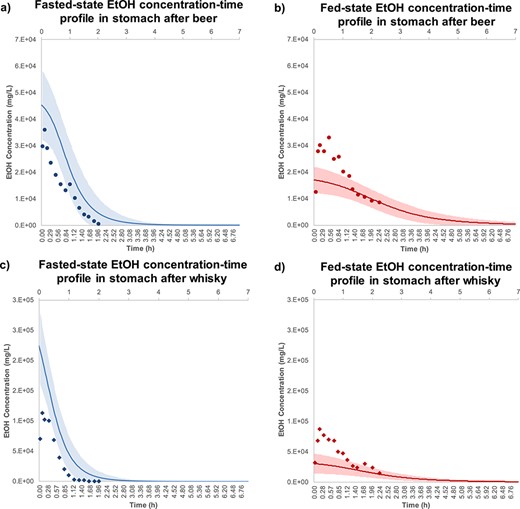
Figure 3 shows the EtOH concentration-time profile in stomach of healthy human volunteers after drinking alcoholic beverages in the fasted- and fed-states depicting Simcyp® predictions versus observed data reported by Rubbens et al. (2016, 2017). Concurrently, the mean predicted values were overlaid with the experimentally reported data to show model validity. The shaded area in each graph represents the standard deviation calculated for each simulated timepoint. Figure 3a shows the fasted-state observed and predicted EtOH concentration-time profiles in stomach after beer intake. Based on the results, no significant difference was observed in experimental and theoretical values for EtOH concentration in the stomach. Figure 3b shows underestimation of Cmax in the stomach after ingestion of beer in fed-state as compared to the observed data. However, the simulated data show good agreement with observed data in the elimination phase. Figure 3c illustrates the EtOH profile after ingestion of whisky in fasted-state showing the gastric EtOH Cmax was estimated 2-fold higher than the experimental observations. However, there was no significant difference between observed and simulated data in elimination phase. Figure 3d shows the underestimation of EtOH Cmax compared to the observed data after consumption of whisky in fed-state.
EtOH concentration-time profile in stomach after ingestion of (a) beer-fast ( ), (b) beer-fed (
 ), (c) whisky-fast (
 ) and (d) whisky-fed state (
 ). The observation data are shown as mean stomach EtOH concentration ± standards deviation for five healthy human subjects (Mean ± SD, n = 5). These experimental data were adopted from Rubbens et al. (2016, 2017) and visualized using Plot Digitizer (http://plotdigitizer.sourceforge.net). The EtOH doses for beer and whisky were 325 and 400 mg/kg body weight, respectively. The predicted mean EtOH concentration-time profile is shown in fasted- (
 ) and fed-state (
 ), respectively, and shaded areas represent SD for each simulation (Mean ± SD, n = 10). The average human body weight was considered 70 kg, female ratio was 0.5 and the subjects ranged between 20 and 50 years old.
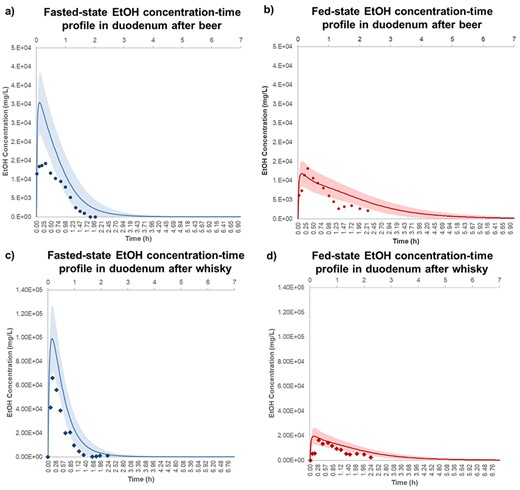
Figure 4 shows the observed and simulated EtOH concentration-time profiles in duodenum after drinking alcoholic beverages in the fasted- and fed-states. According to Fig. 4a, the predicted duodenal EtOH Cmax was 2-fold overestimated compared to the observed value after beer intake in fasted-state. However, the observed and predicted concentrations show similar trend in elimination phase. Figure 4b shows the agreement of the observed with the simulated duodenal EtOH concentration-time profile after beer intake in fed-state. Figure 4c shows duodenal EtOH Cmax was 50% overestimated compared to the observed value after ingestion of whisky in fasted-state. Figure 4d shows that observed duodenal EtOH concentration-time profile after whisky in fed-state was fully verified by simulation model.
EtOH concentration-time profile in duodenum after ingestion of (a) beer-fast (), (b) beer-fed (), c) whisky-fast () and (d) whisky-fed state (). The observation data are shown as mean stomach EtOH concentration ± standards deviation for five healthy human subjects (Mean ± SD, n = 5). These experimental data were adopted from Rubbens et al. (2016, 2017) and visualized using Plot Digitizer (http://plotdigitizer.sourceforge.net). The EtOH doses for beer and whisky were 325 and 400 mg/kg body weight, respectively. The predicted mean EtOH concentration-time profile is shown in fasted- () and fed-state (), respectively, and shaded areas represent SD for each simulation (Mean ± SD, n = 10). The average human body weight for simulation was considered 70 kg, female ratio was 0.5 and the subjects ranged between 20 and 50 years old.
Table 3 shows key kinetic parameters of EtOH in stomach and duodenum of subjects in the fasted-and fed-states after intake of alcoholic beverages. It summarizes the values of EtOH AUC, Cmax and Tmax, in stomach and duodenum, for observed and simulated data (Table 3). Results for beer shows that Cmax of EtOH in stomach in fasted-state was 1.25-fold overestimated as compared to the observation; however, EtOH Cmax in the stomach under fed-state was ~1.91-fold underestimated (Table 3). Furthermore, fed-state duodenal EtOH Cmax was 11.60% underestimated, while, fasted-state duodenal EtOH Cmax was 2.14-fold overestimated (Table 3). As stated in Table 3, Cmax of EtOH in stomach was <2-fold overestimated after whisky intake while simulated Cmax in fed-state stomach was 2.85-fold underestimated. Moreover, Cmax of EtOH after whisky was predicted 1.49- and 1.19-fold higher than that in observed data.
Key kinetic parameters including Cmax, Tmax and AUC of EtOH measured experimentally and by simulation
| Kinetic parameters | Fasted-state | Fed-state | ||
|---|---|---|---|---|
| Beer (325 mg/kg EtOH per body weight) | Stomach | Duodenum | Stomach | Duodenum |
| Cmax (mg/L) | 3.61E+04 (4.53E+04) | 1.42E+04 (3.04E+04) | 3.32E+04 (1.70E+04) | 1.32E+04 (1.18E+04) |
| Tmax (h)* | 0.11 [0.03–0.20] (0) | 0.11 [0.03–0.33] (0.04) | 0.20 [0.20–0.33] (0.04) | 0.20 [0.03–0.66] (0.04) |
| AUC 0-∞(mg·h/L) | 2.62E+04 (4.92E+04) | 1.37E+04 (2.75E+04) | 5.03E+04 (4.47E+04) | 1.54E+04 (2.42E+04) |
| Whisky (400 mg/kg EtOH per body weight) | ||||
| Cmax (mg/L) | 1.13E+05 (2.25E+05) | 6.61E+04 (9.91E+04) | 8.67E+04 (3.04E+04) | 1.64E+04 (1.96E+04) |
| Tmax (h)* | 0.33 [0.11–0.33] (0.04) | 0.20 [0.11–0.5] (0.15) | 0.20 [0.11–1] (0.04) | 0.50 [0.33–0.83] (0.15) |
| AUC 0-∞(mg·h/L) | 6.45E+04 (1.49E+05) | 3.27E+04 (7.12E+04) | 1.07E+05 (6.96E+04) | 2.17E+04 (3.69E+04) |
Abbreviation: Cmax (the highest concentration), Tmax (time needed to reach Cmax) and AUC (area under the concentration-time curve). The experimental values were reported by Rubbens et al. (2016, 2017), while Simcyp® simulated values obtained in this study were shown in parentheses. AUC0-∞ was calculated according to trapezoidal rule using Excel® software. Data are shown as mean ± standard deviation (Mean ± SD, n = 10). *Tmax is expressed as median [min-max].
EtOH fraction dose absorbed and metabolized in GI tract
Figure 5 shows simulation results for regional distribution of EtOH fraction dose absorbed (Fabs) and metabolized (Fmet). Figure 5a and b shows Fabs and Fmet, respectively, in different parts of intestine after ingestion of beer in fast- and fed- states. Figure 5c indicates Fabs after whisky intake in fasted- and fed- conditions, while Fig. 5d shows Fmet after whisky ingestion. According to these plots, the sequence of Fabs and Fmet for EtOH in different parts of intestine was predicted as jejunum I > duodenum> jejunum II > ileum I, II, III, IV > colon. No statistically significant difference was observed in Fabs of EtOH in fasted- and fed-states in different parts of GI tract after ingestion of beer (Fig. 5a) and whisky (Fig. 5c).
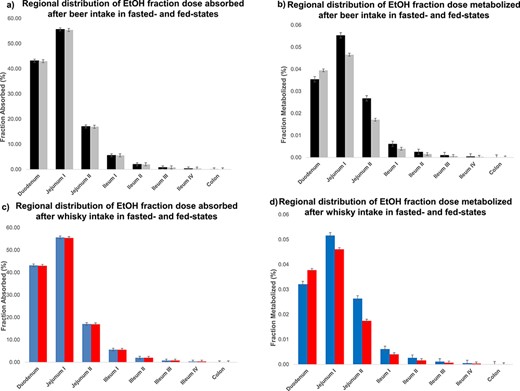
The Simcyp® simulation results for regional distribution of EtOH fraction dose absorbed (Fabs) and metabolized (Fmet). (a) and (b) show Fabs and Fmet in different parts of intestine after ingestion of beer in fast- ( ) and fed- states (
 ). (c) and (d) indicate Fabs and Fmet after whisky intake in fast- (
 ) and fed-conditions (
 ). In all trials, the EtOH administered dose was set as 800 mg/kg body weight. The average human body weight for simulation was considered 70 kg, female ratio was 0.5 and the subjects ranged between 20 and 50 years old. Data are shown as Mean ± Standard deviation (n = 10, Mean ± SD).
Figure 5b shows that the Fmet of EtOH in duodenum and jejunum I after beer intake in fasted-state is not significantly different from that in fed-state (P-value > 0.05). In contrast, the %Fmet of EtOH in fasted-state is significantly higher (P-value < 0.05) than that in fed-state for the rest of intestine, however, Fmet in jejunum II, ileum and colon accounts for a negligible amount of metabolized EtOH (< 0.03%). Figure 5d shows that the Fmet of EtOH after whisky in fasted-state is insignificantly different from that in fed-state along intestine. Fabs and Fmet of EtOH in different parts of intestine confirms that EtOH body exposure is not affected by absorption and metabolism of EtOH along intestine in fasted-and fed-state.
Plasma EtOH concentration-time profile
Figure 6 shows Simcyp-predicted plasma EtOH concentration-time profile after intake of EtOH (800 mg/kg body weight) in fasted- and fed-state. In order to verify the predicted EtOH concentration-time profiles, the experimentally reported values in fasted- and fed-state (Jones and Jönsson 1994a, 1994b; Jones 2011) are simultaneously illustrated. According to Fig. 6, the observed data are shown as mean plasma EtOH concentration ± standards deviation (Mean ± SD) of 12 healthy human subjects in fasted- (solid blue circles) and four subjects in fed-state (solid red circles). In Fig. 6, the predicted EtOH concentration-time profile is also shown in solid blue and red line for fasted- and fed-state, respectively (Mean ± SD, n = 10). The shaded area represents the SD for each simulation. According to Fig. 6, no significant difference was observed between experimental and simulated data.
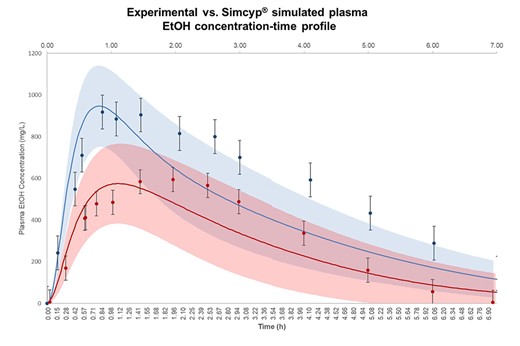
The observation and Simcyp® simulation results for EtOH plasma concentration-time profile. Observation data are shown as mean plasma EtOH concentration ± standards deviation (Mean ± SD) for 12 healthy human subjects in fasted- () and four subjects in fed-state (). The experimental values for systemic plasma concentration of EtOH were adopted from Jones and Jönsson (1994a, 1994b, 2011) and visualized using Plot Digitizer (http://plotdigitizer.sourceforge.net). The administered EtOH dose in observation and simulation was 800 mg/kg body weight. The predicted mean EtOH concentration-time profile is shown in fasted- () and fed-state (), respectively, and shaded areas represent SD for each simulation (Mean ± SD, n = 10). The average human body weight in our simulation was considered 70 kg, the female ratio was 0.5 and the subjects ranged between 20 and 50 years old.
Table 4 summarizes the simulated and observed plasma kinetic parameters of EtOH in fasted- and fed-states. According to Table 4, Cmax of EtOH is 0.09- and 0.16-fold underestimated in fasted- and fed-state compared to the observed data, respectively. The simulated Tmax was predicted in the same range as in observed data (1–2 h). Furthermore, the simulated AUC0-∞ of EtOH was ~ 0.15-fold underestimated compared to the observed data in fasted- and fed-state (Table 4). Comparing observed EtOH systemic exposure and Simcyp® simulation reveals the acceptable performance of the current model in predicting plasma EtOH concentration-time profile in human subjects.
Key kinetic parameters (Cmax, Tmax and AUC) of EtOH in plasma simulated by Simcyp®. Ethanol dose was 800 mg/kg EtOH per body weight for both experimental results and simulated data
| Kinetic parameters | Fasted-state | Fed-state |
|---|---|---|
| Experimental | ||
| Cmax (mg/L) | 1040.00 ± 165 | 670.00 ± 95 |
| Tmax (h)* | 1.00 (0.50–2.00) | 2.00 (0.82–2.5) |
| AUC 0-∞(mg·h/L) | 3980.00 ± 560 | 2410.00 ± 340 |
| Current simulation | ||
| Cmax (mg/L) | 948.05 ± 195 | 575.30 ± 191 |
| Tmax (h)* | 0.81 (0.73–0.90) | 1.12 (1.00–1.25) |
| AUC 0-∞ (mg·h/L) | 3345.04 ± 1789 | 2063.12 ± 525 |
Abbreviation: Cmax (the highest concentration), Tmax (time needed to reach Cmax) and AUC (area under the concentration-time curve). AUC0-∞ was calculated according to trapezoidal rule using Excel® software.
Fasted- and fed-state experimental data were retrieved from reports of Jones and Jönsson (1994a, 1994b; Jones 2011). Cmax and AUC of experimental data are shown as mean ± standard deviation (Mean ± SD, n = 12 for fasted- and n = 4 for fed-state). Simulation data are shown as Mean ± SD (n = 10). *Tmax is expressed as median (min-max).
The effects of gender, age, volume of distribution and mean gastric emptying time on EtOH absorption
In order to estimate the effect of gender on EtOH concentration-time profile, three healthy subjects with female proportion equal to 0, 0.5 and 1.0 were applied on the current model. The mean EtOH Cmax in population comprised from female ratio = 1 was higher than the other two populations (support information). It suggests that the rate and extent of EtOH absorption in women must be higher than that in men (Supplementary Figure S1a). However, the explored difference between female and male populations was not statistically significant (P-value > 0.05). In addition, no statistically significant difference (P-value > 0.05) was observed in EtOH kinetic parameters among three different age groups, including 20–30, 30–40 and 40–50 years old (Supplementary Figure S1b).
SA was used to find out the effect of EtOH dose, GE and Vss on EtOH Cmax and AUC in plasma. Results show that EtOH Cmax and AUC increase linearly by increasing EtOH dose (Supplementary Figure S2a and b). Moreover, Cmax (Supplementary Figure S2c) and AUC (Supplementary Figure S2d) show linear decrease by increasing the GE. Furthermore, EtOH Cmax (Supplementary Figure S2e) and AUC (Supplementary Figure S2f) are decreased by increasing Vss (support information).
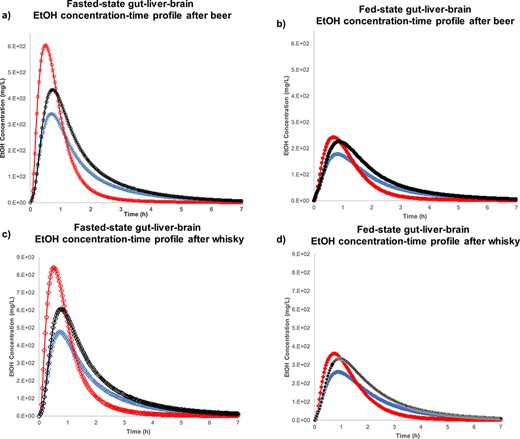
EtOH kinetic parameters in well- and poor-perfused organs
Figure 7 shows the model-predicted results for EtOH concentration-time profile in gut-liver-brain axis. Figure 7a indicates that the highest Cmax achieved in liver is around 600 mg/L, after beer intake in fasted-state, followed by brain and gut. Figure 7b reveals ~50% reduction in fed-state EtOH Cmax compared to fasted-state in gut, liver and brain. Figure 7c shows almost 40% induction in EtOH Cmax in liver after whisky intake compared to beer in fasted-state. Figure 7d exhibits that EtOH Cmax after whisky in fed-state gut, liver and brain is almost half of the corresponding value in fasted-state.
The Simcyp® simulation results for EtOH concentration-time profile after beer intake in (a) fasted-state gut (****), liver ( ), brain (
 ) and (b) fed-state gut (), liver (), brain (
 ). EtOH concentration-time profile after whisky ingestion is shown in (c) fasted-state gut (
 ), liver (
 ), brain (
 ) and (d) fed-state gut (), liver (), brain (
 ). The EtOH doses for beer and whisky were 325 and 400 mg/kg body weight. The average human body weight was considered 70 kg, female ratio was 0.5 and the subjects ranged between 20 and 50 years old. Data are shown as mean (n = 10).
Table 5 shows the Cmax, Tmax and AUC0-∞ achieved for EtOH in different organs for healthy human subjects after ingestion of beer and whisky. In this table, the EtOH kinetic parameters were obtained using the Simcyp® model for well-perfused organs (e.g. gut, liver, lung, heart and kidney), as well as poor-perfused tissues (e.g. skin, muscle and brain). Table 5 shows that the highest concentration of EtOH reached liver after whisky intake in fasted-state (Cmax = 839.50 mg/L) and the lowest EtOH Cmax achieved in skin after beer in fed-state (Cmax = 105.72 mg/L). Among different tissues, the earliest Tmax was predicted in liver after beer intake in fasted-state (Tmax = 0.49 h), however, the latest Tmax was indicated in muscle after whisky in fed-state (Tmax = 1.79 h). The highest EtOH extension of absorption occurs in brain after whisky ingestion in fasted-state (AUC0-∞ = 1139.43 mg·h/L), while the lowest AUC was obtained for skin after beer in fed-state (AUC0-∞ = 233.94 mg·h/L). Predicted EtOH kinetic parameters, based on the developed model, suggest that liver and brain are more exposed to EtOH than other organs.
The kinetic parameters (Cmax, tmax, and AUC) of EtOH simulated in different organs using Simcyp®
| Alcoholic beverage | EtOH dose (mg/kg body weight) | Fasted−/fed-state | Mean pharmaco-kinetic parameters | Tissues | |||||||||
|---|---|---|---|---|---|---|---|---|---|---|---|---|---|
| Liver | Gut | Brain | Kidney | Pancreas | Spleen | Skin | Heart | Muscle | Lung | ||||
| Beer | 325 | Fasted | Cmax | 604.14 | 340.97 | 433.35 | 375.92 | 432.17 | 404.92 | 199.10 | 348.55 | 244.34 | 368.78 |
| Tmax | 0.49 | 0.71 | 0.74 | 0.67 | 0.74 | 0.71 | 0.81 | 0.67 | 1.40 | 0.64 | |||
| AUC0-∞ | 611.74 | 584.66 | 749.49 | 642.76 | 746.51 | 694.32 | 359.11 | 597.59 | 724.92 | 630.64 | |||
| Fed | Cmax | 241.84 | 177.40 | 225.90 | 194.87 | 225.30 | 210.40 | 105.72 | 181.09 | 144.77 | 191.28 | ||
| Tmax | 0.70 | 0.84 | 0.88 | 0.81 | 0.88 | 0.84 | 0.98 | 0.84 | 1.65 | 0.81 | |||
| AUC0-∞ | 356.14 | 382.36 | 488.31 | 418.81 | 486.37 | 452.38 | 233.94 | 389.35 | 470.25 | 410.78 | |||
| Whisky | 400 | Fasted | Cmax | 839.50 | 475.16 | 604.58 | 523.56 | 602.84 | 564.42 | 279.15 | 585.85 | 353.57 | 513.82 |
| Tmax | 0.53 | 0.75 | 0.78 | 0.70 | 0.78 | 0.70 | 0.85 | 0.70 | 1.48 | 0.67 | |||
| AUC0-∞ | 955.15 | 888.87 | 1139.43 | 977.23 | 1134.91 | 1055.59 | 545.89 | 908.53 | 1099.61 | 958.86 | |||
| Fed | Cmax | 360.51 | 261.79 | 333.71 | 287.56 | 332.74 | 310.42 | 156.82 | 267.17 | 222.01 | 282.16 | ||
| Tmax | 0.74 | 0.88 | 0.95 | 0.88 | 0.95 | 0.91 | 1.06 | 0.91 | 1.79 | 0.88 | |||
| AUC0-∞ | 599.17 | 614.92 | 785.07 | 673.43 | 781.95 | 727.35 | 376.06 | 626.01 | 754.32 | 660.60 | |||
Maximum Concentration of EtOH (Cmax, mg/L), time to reach Cmax (Tmax, h) and area under the concentration-time curve (AUC, mg·h/L) after ingestion of common alcoholic beverages (beer 1.4 standard drinking unit (SDU) and whisky 1.8 SDU) during 7 h. The highest and lowest EtOH Cmax after ingestion of alcoholic beverages were found in liver and skin, respectively. Liver and muscles showed the fastest and slowest EtOH tmax compare to the other organs. The highest extension of EtOH absorption was predicted in brain (AUC0-∞ = 1139.43 mg·h/L) after whisky ingestion in fasted-state. In contrast, the lowest AUC (= 233.94 mg·h/L) was found in skin after intake of beer in fed-state.
DISCUSSION
The acceptable criterion for performance of a PBPK model to predict kinetic parameters has remained challenging. The reliable fold change between observed and predicted values extensively depends on model development, availability of clinical data, sample size and variance of parameters within the population. Therefore, there is no general cutoff criteria for all predictions. However, 2-fold change between observed and predicted values is commonly acceptable for substances with wide safety window. In the current model, the fold change difference between observed and predicted AUC0-∞ in stomach and duodenum was ≤2-fold. It proved that our model was able to predict the EtOH concentration-time profile accurately in healthy human GI tract. The fold change between the observed and predicted EtOH kinetic parameters in plasma was negligible and estimated as <0.2-fold change. Throughout the simulation, the effective physiologic, enzymatic and population demographic characteristics were taken into account to provide more insights into EtOH disposition.
Physiologic properties of the human GI tract greatly affect the intragastric EtOH concentration. The residual gastric fluid, the volume of liquid meal in fed-state, GE and gastric transit time are important parameters in determining the gastric EtOH concentration-time profile. In the presence of meal in fed-state, the gastric fluid volume will be increased, which results in more EtOH dilution and lower gastric concentration. As a result, the EtOH concentration in stomach, duodenum, plasma and other organs in fed-state was predicted lower than that in fasted-state. Oneta et al. (1998) had shown that enhanced gastric and hepatic FPM of EtOH in human subjects occurs due to delayed GE. The higher exposure of EtOH to gastric ADH4 and slower absorption of EtOH from intestine were suggested to be responsible for higher gastric and hepatic FPM, respectively (Oneta et al. 1998). Holt described that GE is influenced by the presence of food in stomach and the type of alcoholic beverage that govern the time needed for EtOH to leave stomach and the rate of EtOH absorption (Holt 1981). SA in our simulation confirms that by increasing GE, EtOH Cmax and AUC in plasma decrease. In addition to the physiologic properties of the subjects that affect the EtOH disposition, demographic characteristics of the population was also evaluated in EtOH kinetics.
The effect of population characteristics like age and gender on EtOH kinetics are explored in different human studies. Seitz et al. (1993) have described that in older human populations, plasma EtOH concentration is higher than that in younger populations. The decreased Vss, as well as lower ADHs activity in advanced ages, were introduced as main reasons for higher blood EtOH concentration in elderly subjects. However, our model suggests that EtOH concentration in younger population is insignificantly higher than that in elderly population. Another controversial demographic characteristic that may affect EtOH disposition is gender. Soldin and Mattison (2009) have suggested that due to higher FPM of EtOH in men compared to women, and also smaller Vss of EtOH in women, blood EtOH concentration in women is higher than men. On the other hand, Oneta et al. (1998) have shown that there is no significant difference in serum EtOH concentration-time profile in women versus men. The current model supports the idea that there is no significant difference between EtOH concentration in women versus men, even though mean EtOH Cmax in women is higher than that in men.
Direct measurement of EtOH in different organs is challenging, while some noninvasive techniques have been applied to estimate EtOH in human brain. In one attempt, Fein and Meyerhoff (2000) have shown a strong correlation between brain and blood EtOH concentration using proton magnetic resonance spectroscopy (1H MRS). Furthermore, Li et al. (2012) have studied EtOH ADME in primates using positron emission tomography (PET). They found that the highest EtOH Cmax was observed in liver that is comparable to our work estimating that liver exposed to higher EtOH concentration.
One of the limitations of the current study is that just healthy Caucasian population was investigated as target subjects and this evaluation needs to be expanded to non-Caucasian and non-healthy cohorts as well. Considering the differences in the kinetic parameters of ADH polymorphisms among various human populations and non-healthy subjects is crucial in this way.
A promising direction for future modeling of EtOH may be incorporating clinical data for non-healthy human subjects as input data. Moreover, MRS and PET data and their correlation with clinical data might be beneficial to improve the predictivity of EtOH ADME in brain. This approach leads to optimize dosing regiments for specific patient populations and provides more insights about EtOH disposition in brain.
CONCLUSION
In the present study, a full PBPK model was developed for EtOH using ADAM oral absorption model integrated in Simcyp Simulator®. Common alcoholic beverages including beer and whisky were selected to simulate gastric, duodenal, plasma and tissue EtOH concentration-time profiles in fasted- and fed-state. Simcyp simulation showed ≤ 2-fold difference in AUC of EtOH in stomach and duodenum compared to the observed values. Moreover, the simulated EtOH Cmax, Tmax and AUC in plasma was almost comparable to the observed values. Based on our model, the highest concentration of EtOH reaches the liver faster than any other organ, while the highest extension of EtOH absorption occurs in the brain. This study provides a quantitative insight into assessment of EtOH concentration at different tissues upon each drink. This approach might be valuable in determining the effect of EtOH on the pharmacokinetics and pharmacodynamics of other drugs at their site of action when EtOH is concurrently used.
FINANCIAL/GRANT SUPPORT
This work was supported by grant number 1UH3TR000963 (PIs: F.A. and L.L.) from the National Center for Advancing Translational Sciences (NCATS), National Institutes of Health (NIH). L.L. is supported by the National Institute on Drug Abuse (NIDA) Intramural Research Program and the National Institute on Alcohol Abuse and Alcoholism (NIAAA) Division of Intramural Clinical and Biological Research, NIH (ZIA-DA000635 and ZIA-AA000218). The content of this article does not necessarily represent the official views of the funders.
CONFLICTS OF INTEREST STATEMENT
The authors declare that they have no conflict of interest.
