


Abstract
California’s Mental Health Services Act (MHSA) substantially expanded funding of county mental health services through a state tax, and led to broad prevention efforts and intensive services for individuals experiencing serious mental disorders. We estimated the associations between MHSA and mortality due to suicide, homicide, and acute effects of alcohol. Using annual cause-specific mortality data for each US state and the District of Columbia from 1976–2015, we used a generalization of the quasi-experimental synthetic control method to predict California’s mortality rate for each outcome in the absence of MHSA using a weighted combination of comparison states. We calculated the association between MHSA and each outcome as the absolute difference and percentage difference between California’s observed and predicted average annual rates over the postintervention years (2007–2015). MHSA was associated with modest decreases in average annual rates of homicide (−0.81/100,000 persons, corresponding to a 13% reduction) and mortality from acute alcohol effects (−0.35/100,000 persons, corresponding to a 12% reduction). Placebo test inference suggested that the associations were unlikely to be due to chance. MHSA was not associated with suicide. Protective associations with mortality due to homicide and acute alcohol effects provide evidence for modest health benefits of MHSA at the population level.
Abbreviations
- FSP
full-service partnership
- ICD
International Classification of Diseases
- MHSA
Mental Health Services Act
- MSPE
mean squared prediction error
- SCM
synthetic control method
In 2004, California voters passed Proposition 63, creating the Mental Health Services Act (MHSA). Major aims of the MHSA were to “reduce the long-term adverse impact on individuals, families, and state and local budgets resulting from untreated serious mental illness” (1, p. 103) and to reduce the stigma of mental illness (2), which can directly impact mental health or affect care-seeking among persons with mental health care needs (3–5).
To reach these goals, MHSA expanded funding of county mental health services through a 1% state tax on adjusted gross income over $1 million. In addition, MHSA prevented reductions in mental health spending below fiscal year 2003–2004 levels and blocked the state and counties from using MHSA funds to supplant existing funds for mental health services. MHSA initially increased the state’s mental health budget by approximately 31% above 2004 levels (6), raising $254 million in new revenue in fiscal year 2004–2005 (7) and increasing revenue to more than $1.8 billion in 2015–2016 (8). Additionally, 5% of revenues supported the state’s administration and oversight of MHSA.
The state distributed MHSA funds to counties, which were responsible for implementing programs. Counties used heterogeneous approaches and programs to achieve MHSA’s goals. Examples of statewide programs included provision of housing, suicide prevention, stigma mitigation, educational loan repayments for mental health professionals, and veterans’ services (9).
Despite MHSA’s explicit intent to improve health-related outcomes, few studies have estimated its health impacts. Statewide MHSA Prevention and Early Intervention initiatives have been found to reach targeted California populations, reduce mental illness stigma, increase the number of Californians with the skills to aid persons with mental health challenges, and disseminate evidence-based practices in educational settings (10). Much of the research on MHSA has focused on its full-service partnerships (FSPs). FSPs, which account for a large portion of MHSA spending—for example, 40% of the dollars allocated to counties in fiscal year 2011–2012 (11)—are collaborative relationships between each county and eligible clients (adults with severe mental disorders or seriously emotionally disturbed children and adolescents) that aim to provide the full spectrum of community services to meet the client’s identified goals (12). Research indicates fewer emergency department visits among FSP participants than among nonparticipants (13). Furthermore, research suggests improvements in upstream social factors that likely shape the risk of mental health and substance use problems: Comparison of FSP clients at program intake with the same clients at discharge showed improvements in homelessness, emergency care for mental health/substance abuse conditions, psychiatric hospitalizations, arrests, incarcerations, living independently, child out-of-home placements, and academic performance (14). Children and youth in FSPs have also been found to exhibit more rapidly declining rates of use of crisis-related mental health emergency services than nonparticipants (11).
To our knowledge, only 1 study has examined population-level associations of MHSA with health-related outcomes, and it found that involuntary 14-day psychiatric hospitalizations (“5250's”) decreased after disbursement of MHSA funds, while numbers of involuntary 72-hour holds (“5150s”) did not change (15). Understanding the long-term effects of MHSA on population health is critical to inform future policy-making. Therefore, in this study, we estimated the association of MHSA with mortality due to suicide, homicide, and the acute effects of alcohol in California using a quasi-experimental approach. We focused on causes of mortality that would be expected to decline with improved management of serious mental disorders, based on known consequences of mental disorders (16–22) and documented experiences of MHSA program participants (10, 11, 13–15).
METHODS
Overview
We estimated the population-level associations between MHSA and cause-specific mortality from suicide, homicide, and the acute effects of alcohol using a generalized form of the synthetic control approach (23–25).
Intervention start date
We defined intervention start date by the start of county-level expenditures on MHSA programs. County-level expenditure information was available in reports obtained through a Public Records Act request (see Web Appendix 1, available at https://doi.org/10.1093/aje/kwab123). We used 2006 as the start date because county-level expenditures on MHSA programs began in fiscal year 2006–2007.
Outcomes
We used annual cause-specific mortality rates for all 50 states and the District of Columbia from the Centers for Disease Control and Prevention’s compressed mortality data, accessed through the Wide-ranging Online Data for Epidemiologic Research (WONDER) database, available through 2015 at the time of analysis (26–28). We examined mortality due to suicide, homicide, and the acute effects of alcohol from 1976 to 2015 (Web Figure 1). Because of the 9 years of postintervention time, we chose alcohol-related International Classification of Diseases (ICD; Eighth, Ninth, and Tenth Revisions) underlying-cause-of-mortality codes corresponding to short-term direct effects of alcohol (e.g., accidental alcohol poisoning) but did not include effects of chronic alcohol use (e.g., cirrhosis) (Web Table 1). We were unable to examine mortality due to drugs other than alcohol, because changes in ICD coding from the Ninth Revision to the Tenth Revision between 1998 and 1999 were so substantial that temporal trends across the transition were not interpretable (Web Table 2).
We selected 1976 as the beginning of our study period, because suicide-specific mortality in California was high before the mid-1970s due to use of barbiturates, and synergistic effects between alcohol and barbiturates may have affected mortality due to acute effects of alcohol (29–31). Deaths involving barbiturates decreased dramatically after the mid-1970s as a consequence of the Controlled Substances Act and development of safer treatment alternatives (30, 31). This major change in the composition of cause of death played a larger role in California than it did in many other states. We considered all available postintervention years (2007–2015) because MHSA funding substantially increased throughout this period. Additionally, the population-level health effects of both the broadly directed Prevention and Early Intervention activities and FSPs targeting persons with severe mental disorders were expected to take time to manifest. For each outcome, the donor pool included states with at least 20 reported deaths in each year of the study period (Web Table 3). MHSA constitutes a complex set of changes to the financing and delivery of mental health services, and these changes were not undertaken by any other state during the study period. For each outcome, we included demographic and economic covariates that were available at the state-year level and could have affected the outcomes (Web Appendix 2).
Analysis
We estimated the associations of MHSA with mortality due to suicide, homicide, and acute effects of alcohol using a generalization of the quasi-experimental synthetic control method (SCM) (23, 24). This method has recently been used in a variety of assessments of the health impacts of policies and programs (32–38). The SCM is suitable when there are 1 or few intervention units and no ideal control units and the intervention is initiated on a specific start date. It predicts what the outcome of the intervention unit would have been in the postintervention period in the absence of the intervention (i.e., an estimate of the counterfactual outcome) by modeling the preintervention outcomes observed for the intervention unit as a weighted linear combination of the preintervention outcomes in control units. It includes restrictions such that the weights on the control units are nonnegative and sum to 1, and the intercept is 0. The SCM has strengths compared with alternative methods such as the difference-in-differences method, because it assumes not that parallel preintervention trends would have continued in the postintervention period but rather that the relationships between the intervention unit and the controls captured by the model in the preintervention period will continue in the postintervention period (25).
Recent work illustrates elastic net regression as a generalization of the SCM that retains these strengths but has fewer restrictions on the weights and intercept (25). In elastic net regression, the weights on the control units are not restricted to sum to 1 and the intercept may be nonzero, making it more suitable when the intervention unit has higher or lower outcome levels than many controls. Additionally, the weights on the control units are not restricted to be positive. In this analysis, we selected the elastic net approach because this increased flexibility allowed us to achieve better preintervention model fit. We applied least absolute shrinkage and selection operator (LASSO)-penalized linear regression (39) (a type of elastic net) and used leave-1-out cross-validation on the preintervention data to select the penalties. Analyses were implemented in R 3.1.1 (R Foundation for Statistical Computing, Vienna, Austria) using the package “glmnet” (40). Mean squared prediction error (MSPE) in the preintervention period was used to assess fit for models with and without covariates, and results from the model with the lower MSPE are presented. We excluded the 2006 initiation year from both the pre- and postintervention periods in all calculations. Additional details on the method are provided in Web Appendix 3.
The final model provides a prediction of the intervention unit’s outcome during the postintervention period if the intervention had not occurred. We compared the average annual observed rates with the predicted rates in the postintervention period and calculated the absolute and percentage differences between those rates. Inference is derived from placebo tests in which each control state is modeled in turn as an intervention unit (23, 24). Because the intervention did not actually occur in the other states, any observed association of MHSA with outcomes in comparison states is probably due to chance. If the intervention unit’s association is stronger than the control states’ associations, there is evidence that the association for the intervention unit is not simply due to chance. As is standard practice (24, 32), we restricted calculation of the proportion of control units with associations greater than that of the intervention unit to states for which the preintervention MSPE was less than a multiple (20 times, 5 times, and 2 times) of California’s MSPE. Depending on the number of states within this multiple, values of this proportion may be limited—for example, with 8 control states, possible values are 0, 0.125, 0.25, and so on. With 20 or fewer control states, a “significant” result (proportion < 0.05) can only be observed if the association for California is more extreme than all control states’ associations. We thus caution against strictly interpreting the proportions from the placebo tests using traditional P value cutoffs.
Cross-validation in model selection mitigates the risk of overfitting to the pre-MHSA trends. As an additional overfitting check, we implemented analyses with the intervention start year set to every year between 1990 and 2000. If the main model were overfitting, we would expect these negative control findings to systematically indicate divergence between the observed and predicted trends postintervention.
Sensitivity analyses
Since MHSA may have mitigated or delayed death due to alcoholic liver disease, we conducted a sensitivity analysis in which we estimated the association of MHSA with mortality due to alcoholic liver damage or acute effects of alcohol.
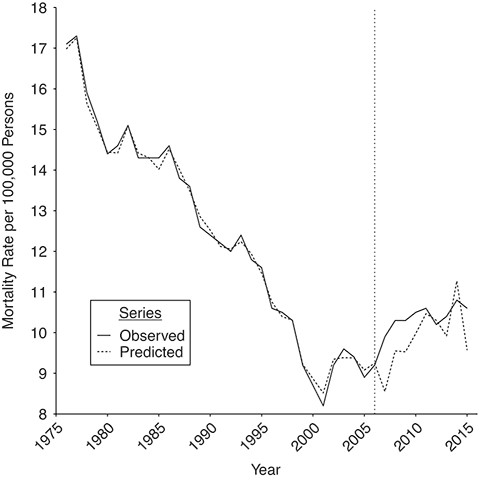
Suicide mortality observed and predicted using the synthetic control method, before and after implementation of the Mental Health Services Act, California, 1976–2015. The vertical dotted line indicates the initiation of the Mental Health Services Act in 2006.
RESULTS
Suicide
The relationship of the MHSA to suicide mortality is depicted in Figure 1. We obtained the best preintervention fit with a linear combination of 23 control states without covariates (Table 1, Web Table 4). Overall, a comparison of the observed suicide rate in California with the prediction in the absence of MHSA indicated no evidence of a population-level difference in suicide mortality associated with MHSA over the postintervention period.
Synthetic Control Results for the Association Between Implementation of the Mental Health Services Act and Cause-Specific Mortality, California, 1976–2015
| Cause of Death | ||||||
|---|---|---|---|---|---|---|
| Suicide | Homicide | Acute Alcohol Effects | ||||
| Attribute | No. | Rate per 100,000 Persons | No. | Rate per 100,000 Persons | No. | Rate per 100,000 Persons |
| Control pool size, no. of statesa | 50 | 41 | 34 | |||
| Observed no. of deaths postintervention | 38,604 | 10.28 | 20,493 | 5.48 | 9,866 | 2.63 |
| Predicted no. of deaths postintervention without MHSA | 37,085 | 9.87 | 23,568 | 6.29 | 11,225 | 2.98 |
Abbreviation: MHSA, Mental Health Services Act.
a States were excluded from the control donor pool if they had fewer than 20 reported deaths from the specified cause in any year.
Homicide
The relationship of the MHSA with homicide is depicted in Figure 2. For homicide, we obtained the best preintervention fit with 13 control states without covariates (Table 1, Web Table 4). The postintervention average annual predicted homicide rate was 6.29/100,000 persons while the average observed homicide rate was 5.48/100,000 persons, for a difference of −0.81/100,000 persons, corresponding to an observed rate 13% lower than the predicted rate in the absence of MHSA.
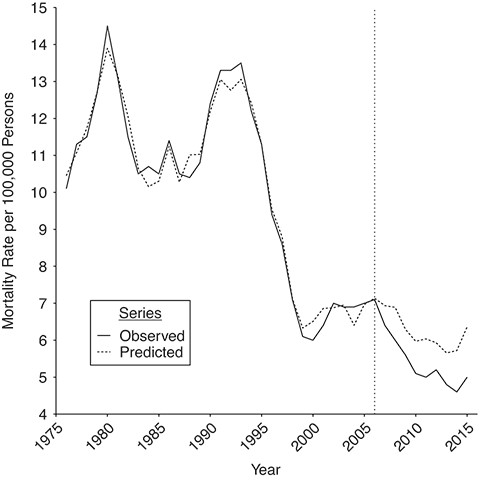
Homicide mortality observed and predicted using the synthetic control method, before and after implementation of the Mental Health Services Act, California, 1976–2015. The vertical dotted line indicates the initiation of the Mental Health Services Act in 2006.
Alcohol deaths
The association of MHSA with mortality due to the acute effects of alcohol is depicted in Figure 3. The best-fitting model included 7 control states without covariates (Table 1, Web Table 4). The predicted alcohol mortality in the absence of MHSA follows the observed rate in the preintervention period but does not match the actual mortality rate as closely as the other outcomes, probably because the outcome is less common and thus the rate is more variable. The postintervention average annual predicted alcohol mortality rate was 2.98/100,000 persons, while the average observed alcohol mortality rate was 2.63/100,000 persons, for a difference of −0.35/100,000 persons, corresponding to an observed rate 12% lower than the rate predicted in the absence of MHSA.
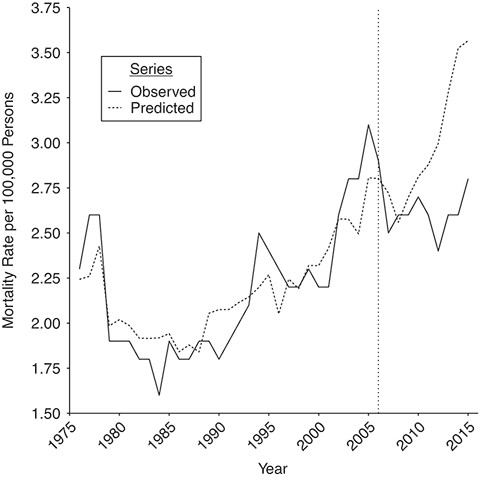
Mortality due to acute effects of alcohol observed and predicted using the synthetic control method, before and after implementation of the Mental Health Services Act, California, 1976–2015. The vertical dotted line indicates the initiation of the Mental Health Services Act in 2006.
Inference using placebo tests
In the placebo tests, the models for California fitted the preintervention period much better than most models for placebo states, possibly due to California’s large population and the consequent stability in the outcome rate trends. Therefore, there were few comparison units available for placebo tests within 5 times and 2 times the MSPE of California (Table 2). However, the most restricted comparisons are the most informative because they focus on the subset of states that had a preintervention fit reasonably close to the fit for California. For suicide, there was high probability (the proportion more extreme (i.e., the proportion of control states with a more extreme estimated association between MHSA and the outcome than the estimated association for California when treated as the intervention unit in a placebo test) was 0.5 for the 2 times MSPE case) of observing a difference at least as large as that observed among the placebo tests. The placebo tests for homicide and alcohol suggested that the associations were unlikely to be due to chance (the proportion more extreme was 1/15 = 0.07 for homicide and 0/9 = 0 for alcohol in the 2 times MSPE case; see Web Tables 5–9 and Web Figures 2–4 for placebo test plots).
Results of Placebo Tests for the Estimated Association Between Implementation of the Mental Health Services Act and the Average Postintervention Outcome, California, 1976–2015
| Proportion of Control States With a More Extreme Averagea in 2007–2015 | |||||||||
|---|---|---|---|---|---|---|---|---|---|
| Suicide | Homicide | Acute Alcohol Effects | |||||||
| MSPE Cutoff | No. of Control States | Total No. | Proportion | No. of Control States | Total No. | Proportion | No. of Control States | Total No. | Proportion |
| <20 times MSPE | 8 | 24 | 0.33 | 10 | 36 | 0.28 | 3 | 32 | 0.09 |
| <5 times MSPE | 2 | 5 | 0.40 | 8 | 31 | 0.26 | 3 | 26 | 0.12 |
| <2 times MSPE | 1 | 2 | 0.50 | 1 | 15 | 0.07 | 0 | 9 | 0.00 |
Abbreviation: MSPE, mean squared prediction error.
a Number of control states in the placebo tests with a more extreme estimated average association (over 2017–2015) between California’s Mental Health Services Act and the postintervention outcome, compared with the estimate for California.
Overfitting checks
Overall, checks suggest that overfitting is not a likely explanation for the main study findings. For homicide and alcohol, there were no substantial differences between California’s observed and predicted rates postintervention for any negative control start year during 1990–2000. Placebo tests suggested that for each year, any apparent associations were probably due to chance.
Sensitivity analysis
We found no association between MHSA and deaths due to the effects of alcohol when we included both short-term effects and alcoholic liver damage (see Web Figures 5 and 6).
DISCUSSION
Overall, these results suggest protective associations of MHSA with population-level mortality due to homicide and acute alcohol effects in California, as indicated by lower postintervention outcome rates than those predicted in the absence of MHSA implementation. In contrast, there was no association of MHSA with the population-level suicide rate in the postintervention period. The magnitudes of associations were modest but consistent with an intervention that would be expected to have the largest impact on the small subset of the population experiencing serious mental disorders (approximately 1 out of every 1,000 Californians was served by an FSP after MHSA) (41), with a much smaller effect anticipated for broad-reaching Prevention and Early Intervention activities.
Homicide
The association of MHSA with a decrease in homicide may have been driven by several possible mechanisms. While most people with mental disorders are nonviolent and most violence is perpetrated by people without mental disorders (42), committing homicide is associated with some mental disorders and with comorbidity among disorders, particularly schizophrenia, some personality disorders, and substance use disorders (16–20). Violence and aggressive behavior are associated with use of some substances, particularly alcohol, amphetamines, cocaine, phencyclidine (PCP), and benzodiazepines, as well as with withdrawal from opioids, alcohol, and amphetamines (43, 44). If the MHSA improved management of symptoms and reduced substance use, particularly for persons with serious mental disorders, this could have reduced violent behavior among these individuals.
Furthermore, people with mental disorders are at increased risk of being the victims of homicide (21, 45–47). Part of the association between MHSA and homicide may therefore be due to decreases in exposure to potentially violent situations for people with mental disorders. Increased linkage with housing and social services may reduce the amount of time that people with mental illness spend in settings in which violent situations are more likely to develop (48). In addition, improved management of symptoms and MHSA’s stigma prevention efforts could contribute to reduced mental disorder symptoms as well as reduced hostility from others in the presence of such symptoms (21). More research is needed to uncover whether MHSA is associated with decreases in homicides through any of these mechanisms.
Alcohol
Our finding that MHSA was associated with a decrease in population-level mortality due to acute effects of alcohol, such as alcohol poisoning, may be due to improved access to substance-use-disorder care and prevention efforts. A major category of FSP programs included services integrating substance use and mental health care (49). Substance use treatment can reduce the use of alcohol, and treatment effectiveness depends upon social services that influence substance use problems (22). As a result of MHSA, many social services were integrated with mental health care services, including those related to housing, physical health care, and legal services (49). By improving treatment access and integrating services that improve treatment efficacy, MHSA may have decreased or changed patterns of alcohol use (50). More research is needed to identify particular programs and services behind the reduction in mortality due to acute alcohol effects and to examine whether the reductions reflect decreases in alcohol use, shifts to safer drinking patterns, or other mechanisms.
Suicide
Although we did not observe an association between MHSA and population-level suicide, previous analyses have shown protective associations between MHSA and indicators of suicide risk. These include reductions in mental illness stigma and improved capacity of community members to intervene in mental health crises (10); reductions in homelessness, emergency mental health/substance abuse intervention, and psychiatric hospitalizations (14); reductions in use of mental health emergency services (13, 14); and reductions in “5250” holds (15). Together with this study, these findings suggest that although MHSA may have been effective in reducing suicide risk factors among high-risk participants in MHSA programs, there is no evidence that it reduced the overall statewide suicide rate. The rates and methods of suicide among demographic and geographic subgroups have changed substantially during the MHSA postimplementation period (51). Thus, an association may be lacking because the populations at highest risk of suicide have shifted to groups that are less often reached by MHSA services. Notably, suicide rates have increased dramatically in many rural California counties and in particular racial/ethnic groups (51). Programs funded by MHSA may not have adapted their programs that target high-risk groups to the rapid change in the populations at greatest risk of suicide over this period. Researchers should continue to monitor the changing landscape of suicide risk and evaluate the extent of MHSA’s reach into these high-risk populations.
Strengths and limitations
While previous studies on MHSA have examined the associations of MHSA with outcomes for program participants, this study provides novel estimates of population-level associations between MHSA and health outcomes over almost a decade postimplementation. In addition, we used a generalization of the quasi-experimental SCM approach that is well-suited to address the question given an intervention in 1 state with no one ideal control unit.
There are several limitations to this work. The results rely on the assumption that any important causes of the outcomes in California, other than MHSA, are captured by trends in the control states. As one example of how this could have been violated, California may have been uniquely affected by the recession of 2007–2009 because of the large proportion of the population affected by subprime mortgages (52). If the recession had stronger effects on California than on other states, this could have diminished any relationship between MHSA and suicide. As another example, California has restrictive firearm laws, and to the extent that there were California-specific changes in gun laws post-MHSA that reduced homicide rates, this could have contributed to the observed relationship between MHSA and homicide. Firearm laws for which there is the strongest evidence of reducing violent crime, specifically background checks and mental illness prohibitions, were not initiated in California during the postintervention period (53, 54). Unfortunately, limited evidence on the impacts of firearm laws precludes comprehensive assessment of this explanation (54). In addition, we used 2006 as the start date because it was the earliest year in which MHSA could have affected outcomes, but funding of programs and services supported by MHSA was rolled out over time. To test the sensitivity of our results to the start date, we replicated our analyses using 2007 as the start date, and the results were similar, with slightly larger reductions associated with MHSA (14% reduction in homicide and 13% reduction in mortality due to acute effects of alcohol). Additionally, we were unable to examine mortality due to drugs other than alcohol because of changes in ICD coding between the Ninth and Tenth revisions that made temporal trends across the transition uninterpretable and led to poor model fit, although analyses over a short preintervention time frame (1999–2005) during which ICD coding was consistent did not suggest a relationship with MHSA (Web Figures 7 and 8). Finally, although no other states implemented the set of changes that together comprised MHSA, it is possible that changes of some aspects of mental health service delivery in other states may have included elements of MHSA during the post-MHSA period. If such a state had a nonzero weight, the synthetic control would be partially “intervention,” and we would expect an attenuation in the difference between the observed and predicted average postintervention rates. Additionally, national policies may have differentially affected state mental health care delivery during the control period. Medicaid expansion under the Affordable Care Act, implemented in 2014, may be one such policy, but there do not appear to be sudden changes in predicted rates versus observed rates for our outcomes starting in 2014.
Implications
Our findings suggest that large-scale investment in mental health services similar to those funded by MHSA has potential for modest reduction in the consequences of mental disorders at the general population level. It would be valuable for further research to identify particular approaches that were most effective or investigate which demographic groups were particularly impacted, potentially by leveraging county-level variation in program implementation (see Web Appendix 1 for information on documents we obtained through the Public Records Act request). More detailed studies on the mechanisms of effect would also be valuable. Such studies would help us to understand how mental health and related services can most effectively be implemented to mitigate the negative consequences of serious mental disorders.
ACKNOWLEDGMENTS
Author affiliations: Division of Epidemiology, School of Public Health, University of California, Berkeley, Berkeley, California, United States (Scott C. Zimmerman, Ellicott C. Matthay, Kara E. Rudolph, Dana E. Goin, Kriszta Farkas, Christopher L. Rowe, Jennifer Ahern); and Department of Epidemiology and Biostatistics, School of Medicine, University of California, San Francisco, San Francisco, California, United States (Kara E. Rudolph).
This work was funded by the Office of the Director (grant DP2HD080350), Eunice Kennedy Shriver National Institute of Child Health and Human Development, National Institutes of Health; the University of California Firearm Violence Research Center; and the University of California, Berkeley, Committee on Research.
The data used in this study are controlled by a third party. They are available from the US Centers for Disease Control and Prevention (CDC) Wide-ranging Online Data for Epidemiologic Research (WONDER) database upon completion of a data-use agreement with the CDC.
The analyses, interpretations, and conclusions in this article are attributable to the authors and not to the California Department of Public Health or the National Institutes of Health.
Conflict of interest: none declared.
REFERENCES
Steinberg Institute.
National Institute on Drug Abuse.
National Center on Addiction and Substance Abuse at Columbia University.

