


Abstract
Longitudinal trajectories of vital signs and biomarkers during hospital admission of patients with COVID-19 remain poorly characterized despite their potential to provide critical insights about disease progression. We studied 1884 patients with severe acute respiratory syndrome coronavirus 2 infection from April 3, 2020, to June 25, 2020, within 1 Maryland hospital system and used a retrospective longitudinal framework with linear mixed-effects models to investigate relevant biomarker trajectories leading up to 3 critical outcomes: mechanical ventilation, discharge, and death. Trajectories of 4 vital signs (respiratory rate, ratio of oxygen saturation (Spo2) to fraction of inspired oxygen (Fio2), pulse, and temperature) and 4 laboratory values (C-reactive protein (CRP), absolute lymphocyte count (ALC), estimated glomerular filtration rate, and D-dimer) clearly distinguished the trajectories of patients with COVID-19. Before any ventilation, log(CRP), log(ALC), respiratory rate, and Spo2-to-Fio2 ratio trajectories diverge approximately 8–10 days before discharge or death. After ventilation, log(CRP), log(ALC), respiratory rate, Spo2-to-Fio2 ratio, and estimated glomerular filtration rate trajectories again diverge 10–20 days before death or discharge. Trajectories improved until discharge and remained unchanged or worsened until death. Our approach characterizes the distribution of biomarker trajectories leading up to competing outcomes of discharge versus death. Moving forward, this model can contribute to quantifying the joint probability of biomarkers and outcomes when provided clinical data up to a given moment.
Abbreviations
- ALC
absolute lymphocyte count
- CCI
Charlson Comorbidity Index
- CI
confidence interval
- COVID-19
coronavirus disease 2019
- CRP
C-reactive protein
- eGFR
estimated glomerular filtration rate
- Fio2
fraction of inspired oxygen
- IQR
interquartile range
- JH-CROWN
Johns Hopkins COVID-19 Precision Medicine Analytics Platform Registry
- SARS-CoV-2
severe acute respiratory syndrome coronavirus 2
- Spo2
oxygen saturation
The pandemic caused by the severe acute respiratory syndrome coronavirus 2 (SARS-CoV-2) continues to progress, with 134 million cases globally and more than 2.9 million deaths as of April 9, 2021 (1). In several studies, risk factors have been identified for progression to severe disease or death from coronavirus disease 2019 (COVID-19; the syndrome caused by SARS-CoV-2) (2–7). However, these studies have focused largely on baseline demographic (e.g., age, race) or clinical variables (e.g., obesity, inflammatory markers) without considering longitudinal trends in biomarkers and vital signs. Biomarker and vital signs trajectories leading up to initiation of mechanical ventilation, discharge, and death contain valuable information that can guide clinical decisions and elucidate the pathobiology of COVID-19. Because different therapeutics may have efficacy at different time points in disease progression, understanding patient trajectories before and after events such as mechanical ventilation can motivate specific hypotheses about which patients are more likely to benefit from specific interventions. Finally, an understanding of longitudinal trajectories of clinical features of COVID-19 will inform the development of robust and accurate prediction tools to guide resource allocation and inform conversations with patients and families.
In this article, we propose using a linear mixed-effects model to retrospectively study individual biomarker trajectories preceding the key clinical events of initiation of mechanical ventilation, discharge, and death (8). We use a longitudinal case–control design and outcome-specific strata to describe population and individual biomarker trajectories preceding clinical events to better understand how biomarkers change over time relative to clinical milestones.
METHODS
Data source
The data source for this study was JH-CROWN, the Johns Hopkins COVID-19 Precision Medicine Analytics Platform Registry, which uses the Hopkins Precision Medicine Analytics Platform (4). JH-CROWN includes data from 5 hospitals (Johns Hopkins Hospital, Baltimore, Maryland; Bayview Hospital, Baltimore, Maryland; Howard County General Hospital, Columbia, Maryland; Suburban Hospital, Bethesda, Maryland; and Sibley Hospital, Washington, DC) that compose the Johns Hopkins Medicine System. The institutional review boards of these hospitals approved this study as minimal risk and waived requirement for informed consent.
All patients consecutively admitted with confirmed SARS-CoV-2 infection by microbiological testing from April 3, 2020, to June 25, 2020, were included. Time of admission was defined as the time the admission order was written. Readmissions were excluded because data represent the initial episode of care for each patient. Data in JH-CROWN include demographics, medical history, comorbid conditions, symptoms, vital signs, respiratory events, medications, and laboratory results.
Study population
We studied 1884 patients who died during admission or were discharged before data extraction on June 25, 2020, and who had at least 1 biomarker value reported during admission. Some patients were included in prior descriptions of the cohort (4). Ninety-nine patients who were hospitalized at the time of data extraction were excluded. The number of unique patients with reported values varied (Table 1), with vital signs reported more regularly and laboratory values measured less frequently. We multiplied the number of individual patients by length of stay to determine the total patients-days for which we would expect measurements. For example, 1,856 patients had a median of 6 (interquartile range (IQR), 3–11) days with respiratory-rate data (n = 28 patients had no respiratory-rate data), and of the total patient-days we would have expected data, 4.5% had no reported value.
Frequency of Patients With at Least 1 Reported Measure, Number of Reported Measures per Patient, and Unmeasured Data, per Vital Sign and Laboratory Value, From the Johns Hopkins COVID-19 Precision Medicine Analytics Platform Registry, Study of Patients With COVID-19, Baltimore, Maryland, April 3, 2020–June 25, 2020
| Biomarker | No. of Unique Patients | Daily Measures | Days With Reported Measures, Median (IQR) | Days With Reported Measures, Range | Days With No Reported Measure, %a |
|---|---|---|---|---|---|
| Overall | 1884b | 16,747 | 6 (3–11) | 1–81 | |
| Respiratory rate | 1856 | 16,117 | 6 (3–11) | 1–79 | 4.5 |
| Temperature | 1845 | 16,130 | 6 (3–11) | 1–79 | 4.4 |
| Pulse | 1856 | 16,183 | 6 (3–11) | 1–79 | 4.1 |
| Spo2-to-Fio2 ratio | 1847 | 16,132 | 6 (3–11) | 1–79 | 4.4 |
| D-dimer | 1,471 | 5,668 | 2 (1–5) | 1–38 | 66.4 |
| CRP | 1,461 | 5,631 | 3 (1–5) | 1–40 | 66.6 |
| eGFR | 1715 | 13,023 | 5 (2–9) | 1–77 | 22.8 |
| ALC | 1,316 | 7,551 | 3 (1–6) | 1–59 | 55.3 |
Abbreviations: ALC, absolute lymphocyte count; COVID-19, coronavirus disease 2019; CRP, C-reactive protein; eGFR, estimate glomerular filtration rate; Fio2, fraction of inspired oxygen; IQR, interquartile range; Spo2, oxygen saturation.
a The denominator or days with an expected measure was based on the number of individual patients and length of stay of each patient.
b Number of patients with ≥1 biomarker measure.
Clinical events
We followed patients from hospital admission until the first of either mechanical ventilation, discharge, or death. We then followed patients who received ventilatory support until the first of discharge or death. On the basis of outcome events, we identified 4 patient strata: those who were 1) admitted and discharged without ventilation; 2) admitted and died without receiving ventilatory support; 3) admitted, received ventilatory support during admission, and discharged; and 4) admitted, received ventilatory support during admission, and died. Patients with multiple ventilation episodes were followed from initial date of ventilation until their final outcome.
We compared demographics and clinical characteristics across the 4 strata, using Kruskal Wallis tests for continuous variables, ꭓ2 tests for categorical variables, and Fisher exact tests with Monte Carlo simulation for categorical variables with expected values less than 5. Clinical outcomes (i.e., ventilation, discharge, or death) were treated as independent strata indicators in longitudinal models. In effect, we performed a longitudinal case–control study by identifying patients on the basis of their outcome and retrospectively characterizing trajectories preceding their outcome.
Biomarkers
We selected 8 biomarkers (4 vital signs and 4 laboratory measures) to represent components of inflammation, end-organ disease, and coagulation: respiratory rate, temperature, pulse, ratio of oxygen saturation (Spo2) to fraction of inspired oxygen (Fio2) ratio, C-reactive protein (CRP), estimated glomerular filtration rate (eGFR), D-dimer, and absolute lymphocyte count (ALC). These factors are associated with severe illness and/or death from COVID-19 (9). Respiratory rate, temperature, CRP and ALC were found to be predictive of severe disease or death due to COVID-19, and Spo2-to-Fio2 ratio was associated with death, using data from the Johns Hopkins Health System (4). Elevated pulse is a marker of sepsis and may be associated with a worse mortality rate in cases of sepsis as well as in COVID-19 (10). Patients with preexisting kidney disease are at higher risk of death due to COVID-19 (11). Acute kidney injury is also a risk factor for poor outcomes (12). D-dimer is associated with severe COVID-19 and has been linked to death due to COVID-19 (13). Laboratory values that were reported as greater or less than a value (4.0% of values were reported this way) were changed to reflect the limit of quantification. For example, if D-dimer was reported as less than 0.19 μg/mL, 0.19 was used. We calculated daily means for each biomarker.
Trajectories preceding clinical events
We aimed to characterize population-average and patient-specific biomarker trajectories leading up to major clinical outcomes. For each patient, we treated the day of their outcome as day 0 and studied repeated biomarker measures over previous time from their admission until day 0. Previous time from admission to day 0 is designated as |$u$|. For example, if a patient was admitted for COVID-19 20 days before their outcome, we considered that patient’s admission to be day −20. This approach aligned patient trajectories proximal to event time rather than admission time and allowed us to characterize trajectories immediately preceding major clinical outcomes.
We fitted 2 linear mixed-effects models for each biomarker. The first model described trajectories from admission up to a patient’s first major event of interest: ventilation, discharge, or death. The second model described trajectories from the initiation of ventilation up to their second event of interest: discharge or death. Patients admitted before receiving ventilatory support contributed data to both models. The fixed effects were indicators for the patient’s outcome stratum and interactions between the stratum and smooth time trends represented by natural cubic splines with 3 degrees of freedom. The random effects included random intercepts and smooth time trends represented by natural cubic splines with 3 degrees of freedom. Random effects allowed each patient’s trajectory to deviate from the mean level and shape of their subgroup’s overall curve. We performed likelihood ratio tests to test the null hypotheses that the smoothed time trend was the same across the outcome strata for each model.
To study the total effect of each covariate on the level or shape of each biomarker’s trajectory, we fit a series of models in which the interaction between the smooth time trend and outcome stratum also interacted with 1 of the patient characteristics: age, sex, race, body mass index, Charlson Comorbidity Index (CCI) score, or smoking status. We displayed the estimated intercept (value at day 0) and 3-day linear trend preceding day 0 (from day −3 to 0) for each subgroup in Web Figures 1 and 2 (available at https://doi.org/10.1093/aje/kwab138). Programs were written in the R statistical language (14).
Statistical model
Let |${Y}_{ij}$| be the jth biomarker value for patient i measured at day |${t}_{ij}$| from the day of admission for which |${t}_{ij}=0$|. We denoted baseline predictor variables as |${X}_i$| and major clinical events as |${E}_i$|. We considered 2 possible events after admission denoted by |${E}_i^{(1)}$| and |${E}_i^{(2)}$|, where |${E}_i^{(1)}\in\{0,1,2\}$| indicates whether the patient was discharged, died, or received mechanical ventilatory support. When |${E}_i^{(1)}=2$|, then |${E}_i^{(2)}\in \{0,1\}$|, indicating whether the person who required ventilatory support was eventually discharged or died. The 5 clinical outcome strata coincided with 4 patient groups: |${E}_i^{(1)}=0$|, those who were admitted, never received mechanical ventilatory support, and were discharged; |${E}_i^{(1)}=1$|, those who were admitted, never received mechanical ventilatory support, and died; |${E}_i^{(2)}=0\mid {E}_i^{(1)}=2$|, those who were admitted, received mechanical ventilatory support, and were discharged; and |${E}_i^{(2)}=1 \mid {E}_i^{(1)}=2$|, those who were admitted, received mechanical ventilatory support, and died.
Model checking
We created boxplots of standardized residuals against deciles of predicted values for each |${\hat{Y}}_{ij}$| to identify systematic deviations from a residual mean of 0 or changing spread among residuals that would indicate an incorrect model for the variance of the observations. We produced quantile-quantile plots against the standard Gaussian distribution for the standardized residuals to assess the Gaussian assumption regarding random effects and residual errors. If we discovered a systematic deviation, we used bootstrapping to obtain robust variance estimators for the estimated population intercepts and linear slopes.
RESULTS
Study population
Among the 1,884 patients, 1,445 were admitted and discharged without receiving mechanical ventilatory support; 118 were admitted and died without receiving mechanical ventilatory support; 202 were admitted, received mechanical ventilatory support during admission, and were discharged; and 119 were admitted, received mechanical ventilatory support during admission, and died. Compared with the other patient strata, patients discharged without receiving mechanical ventilatory support were more likely to be younger (median age (IQR), 56 (41–71) years), be of Latinx or other race/ethnicity, have lower CCI scores, and less likely to have been a current or former smoker (Table 2). Patients who died without receiving mechanical ventilatory support were more likely to be older (median age (IQR), 82.5 (73–91) years), White, and have a do not resuscitate/do not intubate order. Patients who received mechanical ventilatory support and were discharged were more likely to be younger (median age (IQR), 60.5 (51–71) years), Black, nonsmokers, and have lower CCI scores. Patients who received mechanical ventilatory support and died were more likely to be older (median age (IQR), 70 (63–75) years), Black, have a CCI score of 1–2, and have a do not resuscitate/do not intubate order. Among patients who never received mechanical ventilatory support, median times to discharge and death were 4 (IQR, 2–7) days and 5 (IQR, 1–9) days, respectively. Among those who received mechanical ventilatory support, median times from admission to discharge or death were 20 (IQR, 12–32) days and 11 (IQR, 6–20) days, respectively.
Comparing Characteristics of Patients With COVID-19 Across Outcome Strata From Within the Johns Hopkins COVID-19 Precision Medicine Analytics Platform Registry, Baltimore, Maryland, April 3, 2020–June 25, 2020
| Admitted Then Discharged (n = 1,445) | Admitted Then Died (n = 118) | Admitted, Ventilated, Discharged (n = 202) | Admitted, Ventilated, Died (n = 119) | Total (N = 1884) | ||||||
|---|---|---|---|---|---|---|---|---|---|---|
| Patient Characteristic | No. | % | No. | % | No. | % | No. | % | No. | % |
| No. of days to initial ventilation, median (IQR)a,b | 1.00 (0, 2.00) | 1.00 (0, 3.00) | ||||||||
| No. of days to discharge/death, median (IQR)a,b | 4.00 (2.00, 7.00) | 5.00 (1.00, 9.00) | 20.0 (12.0, 31.8) | 11.0 (6.00, 20.0) | 5.00 (2.00, 10.0) | |||||
| Age, median (IQR), yearsa,b | 56.0 (41.0, 71.0) | 82.5 (73.0, 91.0) | 60.5 (51.0, 70.8) | 70.0 (63.0, 80.5) | 60.0 (44.0, 73.0) | |||||
| Age, %, yearsa | ||||||||||
| <60 | 817 | 56.5 | 3 | 2.5 | 99 | 49.0 | 22 | 18.5 | 941 | 49.9 |
| 60–74 | 356 | 24.6 | 30 | 25.4 | 72 | 35.6 | 52 | 43.7 | 510 | 27.1 |
| >74 | 272 | 18.8 | 85 | 72.0 | 31 | 15.3 | 45 | 37.8 | 433 | 23.0 |
| Race, %a | ||||||||||
| White | 376 | 26.0 | 59 | 50.0 | 52 | 25.7 | 43 | 36.1 | 530 | 28.1 |
| Black | 499 | 34.5 | 39 | 33.1 | 80 | 39.6 | 47 | 39.5 | 665 | 35.3 |
| Latinx/other | 569 | 39.4 | 20 | 16.9 | 70 | 34.7 | 29 | 24.4 | 688 | 36.5 |
| Missing data | 1 | 0.1 | 0 | 0 | 0 | 0 | 0 | 0 | 1 | 0.1 |
| Sex, %c | ||||||||||
| Female | 702 | 48.6 | 49 | 41.5 | 85 | 42.1 | 52 | 43.7 | 888 | 47.1 |
| Male | 743 | 51.4 | 69 | 58.5 | 117 | 57.9 | 67 | 56.3 | 996 | 52.9 |
| Body mass index, %a,d | ||||||||||
| <18.5 | 35 | 2.4 | 12 | 10.2 | 4 | 2.0 | 2 | 1.7 | 53 | 2.8 |
| 18.5– 24.9 | 304 | 21.0 | 44 | 37.3 | 32 | 15.8 | 29 | 24.4 | 409 | 21.7 |
| 25.0–29.9 | 379 | 26.2 | 23 | 19.5 | 48 | 23.8 | 30 | 25.2 | 480 | 25.5 |
| 30.0–39.9 | 405 | 28.0 | 14 | 11.9 | 58 | 28.7 | 27 | 22.7 | 504 | 26.8 |
| ≥40.0 | 116 | 8.0 | 2 | 1.7 | 22 | 10.9 | 13 | 10.9 | 153 | 8.1 |
| Missing data | 206 | 14.3 | 23 | 19.5 | 38 | 18.8 | 18 | 15.1 | 285 | 15.1 |
| Diabetesa,e | 374 | 25.9 | 28 | 23.7 | 72 | 35.6 | 46 | 38.7 | 520 | 27.6 |
| Smoking history, %a | ||||||||||
| Current smoker | 78 | 5.4 | 7 | 5.9 | 19 | 9.4 | 6 | 5.0 | 110 | 5.8 |
| Former smoker | 284 | 19.7 | 35 | 29.7 | 57 | 28.2 | 33 | 27.7 | 409 | 21.7 |
| Never smoker | 957 | 66.2 | 48 | 40.7 | 109 | 54.0 | 50 | 42.0 | 1,164 | 61.8 |
| Missing data | 126 | 8.7 | 28 | 23.7 | 17 | 8.4 | 30 | 25.2 | 201 | 10.7 |
| CCI score, median (IQR)a | 1.00 [0, 2.00] | 2.00 [1.00, 3.00] | 1.00 [0, 3.00] | 1.00 [1.00, 3.00] | 1.00 [0, 2.00] | |||||
| CCI score, %a | ||||||||||
| 0 | 658 | 45.5 | 14 | 11.9 | 74 | 36.6 | 27 | 22.7 | 773 | 41.0 |
| 1–2 | 580 | 40.1 | 56 | 47.5 | 76 | 37.6 | 59 | 49.6 | 771 | 40.9 |
| 3–4 | 170 | 11.8 | 38 | 32.2 | 35 | 17.3 | 20 | 16.8 | 263 | 14.0 |
| >5 | 30 | 2.1 | 10 | 8.5 | 17 | 8.4 | 13 | 10.9 | 70 | 3.7 |
| Missing data | 7 | 0.5 | 0 | 0 | 0 | 0 | 0 | 0 | 7 | 0.4 |
| Ever had DNR/DNI order, %a | 175 | 12.1 | 112 | 94.9 | 35 | 17.3 | 105 | 88.2 | 427 | 22.7 |
Abbreviations: CCI, Charlson Comorbidity Index; COVID-19, coronavirus disease 2019; IQR, interquartile range; DNI, do not intubate; DNR, do not resuscitate.
a Comparison across 4 strata statistically significant such that P < 0.001.
b Values expressed as median (IQR).
c Comparison across 4 strata groups not statistically significant.
d Calculated as weight (kg)/height (m2).
e Diabetes history missing for 7 patients (0.4%).
Trajectories preceding clinical events
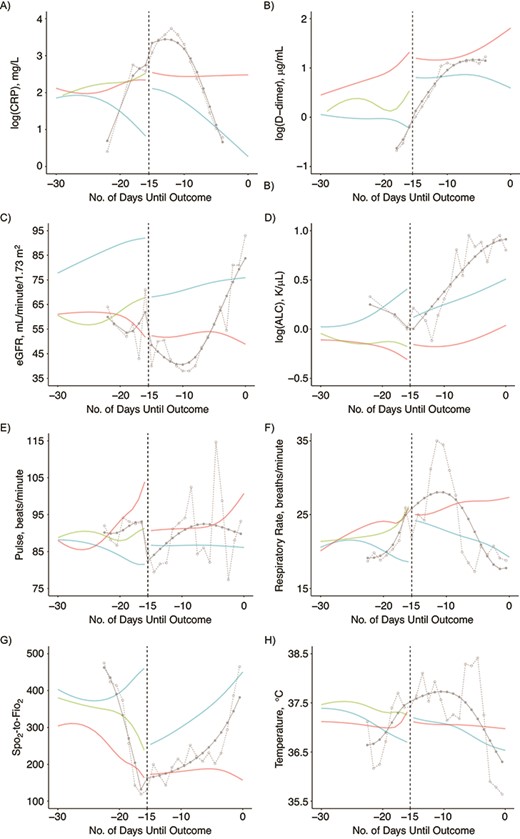
Mean biomarker trajectories preceding patient outcomes are displayed with 95% confidence intervals in Figure 1. The final fitted values on the day of each outcome (day 0) are presented with 95% confidence intervals in Table 3, and the slope of values over the 3 days leading up to each outcome are presented in Table 4. All likelihood ratio tests of the null hypothesis that the smoothed time trend is the same across the outcome strata were statistically significant (P < 0.001). Patients discharged without receiving mechanical ventilatory support had lower (i.e., better) log(CRP) (Figure 1A), log(D-dimer) (Figure 1C), pulse (Figure 1I), respiratory rate (Figure 1K), and temperature (Figure 1O) values, and higher (i.e., better) eGFR (Figure 1E), log(ALC) (Figure 1G), and Spo2-to-Fio2 ratio (Figure 1M) values at discharge than those who died with or without receiving mechanical ventilatory support. Without ventilation, there was a divergence in log(CRP), log(ALC), respiratory rate, and Spo2-to-Fio2 ratio trajectories approximately 8–10 days before death or discharge (Figure 1A, 1G, 1K, and 1M). We observed a steady increase in D-dimer level that began 20 days before death without ventilation and minimal change in D-dimer level among those discharged without receiving mechanical ventilatory support (Figure 1C). Similarly, we observed a steady increase in eGFR that began 20 days before discharge without ventilation and minimal change in eGFR among those who died without receiving mechanical ventilatory support, apart from the last few days leading up to death (Figure 1E). In the days leading up to ventilation, patient trajectories more closely followed trajectories of patients who died without receiving mechanical ventilatory support.

Mean population-average and patient-specific biomarker trajectories preceding clinical events for 8 selected measures using outcome-stratified longitudinal models among patients in the Johns Hopkins COVID-19 Precision Medicine Analytics Platform Registry, Baltimore, Maryland, March 2020–June 2020. A–H) The y-axes are fitted values for each biomarker and x-axes are days leading up to the clinical outcome. Thick lines represent population-average trajectories, and thin lines represent the patient-specific trajectories. A, C, E, G, I, K, M, and O contain data from among those who did not receive mechanical ventilatory support. Trajectories in these panels are shown from admission to death (red), from admission to discharge (blue), and from admission to mechanical ventilation if patient later received mechanical ventilatory support (green). B, D, F, H, J, L, N, and P contain data from among those who received mechanical ventilatory support. Trajectories in these panels are shown from ventilation to death (red) and from ventilation to discharge (blue). Individual trajectories of patients with less data more closely approximate the population-average curve with the same outcome. Line thickness is representative of the number of patients with available data at that time point: widest width the curves represents data from > 1,000 patients and, at the narrowest, fewer than 50 patients. The 95% confidence intervals are shown in corresponding colors with transparency. Abbreviations, ALC, absolute lymphocyte count; CRP, C-reactive protein; eGFR, estimated glomerular filtration rate; Fio2, fraction of inspired oxygen; Spo2, oxygen saturation.
Fitted Values on the Day of Clinical Event (i.e., Discharge, Death, or Ventilation) From Outcome-Stratified Longitudinal Models Among Patients Within the Johns Hopkins COVID-19 Precision Medicine Analytics Platform Registry, Baltimore, Maryland, April 3, 2020, to June 25, 2020
| Biomarker | Trajectory From Admission to Discharge | Trajectory From Admission to Death | Trajectory From Admission to Ventilation | Trajectory From Ventilation to Discharge | Trajectory From Ventilation to Death | |||||
|---|---|---|---|---|---|---|---|---|---|---|
| Fitted Valuea | 95% CI | Fitted Value | 95% CI | Fitted Value | 95% CI | Fitted Value | 95% CI | Fitted Value | 95% CI | |
| Log(CRP) | 0.8 | 0.7, 0.9 | 2.3 | 1.9, 2.7 | 2.5 | 2.3, 2.7 | 0.3 | 0, 0.6 | 2.5 | 2.1, 2.8 |
| Log(D-dimer) | −0.2 | −0.3, −0.1 | 1.3 | 1, 1.7 | 0.5 | 0.4, 0.7 | 0.6 | 0.3, 0.9 | 1.8 | 1.5, 2.1 |
| eGFR | 92 | 90.2, 93.8 | 51.7 | 44.8, 58.5 | 67.8 | 63.4, 72.3 | 75.9 | 70.1, 81.7 | 48.9 | 41.4, 56.4 |
| Log(ALC) | 0.4 | 0.4, 0.4 | −0.3 | −0.5, −0.1 | −0.2 | −0.3, −0.1 | 0.5 | 0.4, 0.6 | 0 | −0.1, 0.2 |
| Pulse | 81.6 | 80.7, 82.4 | 103.9 | 101.1, 106.7 | 91.3 | 89.2, 93.4 | 86.1 | 83.9, 88.3 | 100.7 | 97.9, 103.6 |
| Respiratory rate | 18.6 | 18.4, 18.8 | 25.9 | 25.1, 26.6 | 26.1 | 25.6, 26.6 | 19.2 | 18.4, 20.1 | 27.3 | 26.2, 28.4 |
| Spo2-to-Fio2 ratio | 460.5 | 456.6, 464.3 | 163.5 | 149.7, 177.3 | 238.6 | 228.8, 248.3 | 450.6 | 438.4, 462.8 | 157.1 | 141.4, 172.9 |
| Temperature | 36.7 | 36.7, 36.7 | 37.3 | 37.237.4 | 37.3 | 37.2, 37.3 | 36.5 | 36.4, 36.6 | 37 | 36.8, 37.1 |
Abbreviations: ALC, absolute lymphocyte count; CI, confidence interval; COVID-19, coronavirus disease 2019; CRP, C-reactive protein; eGFR, estimated glomerular filtration rate; Fio2, fraction of inspired oxygen; Spo2, oxygen saturation.
a Fitted values calculated from 16 outcome-stratified longitudinal models (for each biomarker pre- and postventilation). In each column, the fitted value represents the population-average value on the day of the final event in each trajectory (i.e., day 0 in each model). For example, patients in our study population who were admitted and discharged without requiring mechanical ventilatory support were discharged with an average log(CRP) value of 0.8 (95% CI: 0.7, 0.9).
Linear Trend in Values Over the 3 Days Preceding the Clinical Event From Outcome-Stratified Longitudinal Models Among Patients Within the Johns Hopkins COVID-19 Precision Medicine Analytics Platform Registry, Baltimore, Maryland, April 3, 2020, to June 25, 2020
| Biomarker | Trajectory From Admission to Discharge | Trajectory From Admission to Death | Trajectory From Admission to Ventilation | Trajectory From Ventilation to Discharge | Trajectory From Ventilation to Death | |||||
|---|---|---|---|---|---|---|---|---|---|---|
| Trenda | 95% CI | Trend | 95% CI | Trend | 95% CI | Trend | 95% CI | Trend | 95% CI | |
| Log(CRP) | −0.2 | −0.2, −0.1 | 0 | −0.1, 0.2 | 0.1 | 0, 0.2 | −0.2 | −0.2, −0.1 | 0 | −0.1, 0.1 |
| Log(D-dimer) | −0.1 | −0.1, 0 | 0.1 | 0, 0.2 | 0.1 | 0.1, 0.2 | −0.1 | −0.1, 0 | 0.1 | 0, 0.2 |
| eGFR | 0.5 | 0.2, 0.9 | −2.6 | −4, −1.1 | 1.2 | 0.4, 2.1 | 0.3 | −0.5, 1.1 | −1.2 | −2.3, −0.1 |
| Log(ALC) | 0 | 0, 0.1 | 0 | −0.1, 0 | 0 | −0.1, 0 | 0 | 0, 0 | 0 | 0, 0 |
| Pulse | −0.5 | −0.7, −0.2 | 3 | 2.1, 3.8 | 1 | 0.3, 1.8 | −0.1 | −0.7, 0.5 | 2.1 | 1.3, 2.9 |
| Respiratory rate | −0.3 | −0.4, −0.3 | 0.6 | 0.3, 0.9 | 1.1 | 0.8, 1.3 | −0.5 | −0.8, −0.3 | 0.2 | −0.2, 0.5 |
| Spo2-to-Fio2 ratio | 17.4 | 15.9, 18.9 | −14.2 | −19.8, −8.6 | −29 | −34, −24 | 19.2 | 15.7, 22.7 | −8.3 | −13.1, −3.6 |
| Temperature | −0.1 | −0.1, 0 | 0.1 | 0.1, 0.1 | 0 | 0, 0 | 0 | −0.1, 0 | 0 | 0, 0 |
Abbreviations: ALC, absolute lymphocyte count; CI, confidence interval; COVID-19, coronavirus disease 2019; CRP, C-reactive protein; eGFR, estimated glomerular filtration rate; Fio2, fraction of inspired oxygen; Spo2, oxygen saturation.
a Trend represents the slope of fitted values over the 3 days immediately preceding the event (i.e., day −3 to day 0 in in each model). For example, for patients in our study population who were admitted and discharged without requiring mechanical ventilatory support, log(CRP) decreased 0.2 units/day over the 3 days before discharge.
Among patients who required mechanical ventilatory support, log(CRP) (Figure 1B), eGFR (Figure 1F), log(ALC) (Figure 1H), respiratory rate (Figure 1L), and Spo2-to-Fio2 ratio (Figure 1N) trajectories diverged between patients who received mechanical ventilatory support and were discharged versus those who died, such that values improved for those who were discharged or remained unchanged or worsened for those who died. This divergence was observed 10 or more days before discharge or death. Log(D-dimer) and temperature diverged between patients receiving mechanical ventilatory support who were discharged versus those died approximately 8 days before discharge or death (Figure 1D and 1P). Almost immediately after ventilation, eGFR and the Spo2-to-Fio2 ratio increased among patients who were discharged, compared with minimal changes among those who died (Figure 1F and 1N). Patients who required mechanical ventilatory support and were discharged reached Spo2-to-Fio2 ratio, respiratory rate, log(ALC), pulse, and temperature values comparable to those of patients who were discharged without receiving mechanical ventilatory support. In contrast, patients discharged after receiving mechanical ventilatory support were discharged at lower eGFRs than patients who were discharged but did not receive mechanical ventilatory support (75.9 (95% confidence interval: 70.1, 81.7) vs 92 (95% confidence interval: 90.2, 93.8)) (Table 3). Log(D-dimer) values remained elevated among patients discharged after receiving mechanical ventilatory support when compared with those who were discharged without receiving mechanical ventilatory support (0.6 (95% confidence interval: 0.3, 0.9) vs −0.2 (95% confidence interval: −0.3, 0.1)) (Table 3).
Trajectories by subgroup
Among those discharged without receiving ventilatory support, at the time of discharge there was minimal variation by sex, age, race, body mass index, CCI score, or smoking status in log(CRP), pulse, respiratory rate, Spo2-to-Fio2 ratio, or temperature. Black patients and White patients older than 75 years and patients with CCI score greater than 3 were discharged with a lower eGFR. Among patients who required ventilatory support, older Black patients and White patients received mechanical ventilatory support at lower eGFRs, and patients of Latinx or other race/ethnicity received mechanical ventilatory support at a higher respiratory rate. Among patients who received mechanical ventilatory support and were discharged, those with CCI score greater than 3 were discharged at lower eGFR, D-dimer, and log(ALC) values, and pulse than those with CCI score of 0 or 1–2 (Web Figure 1). Fitted linear trends over the 3 days before each outcome across demographic and clinical subgroups are plotted in Web Figure 2. Overall, there were minimal variations in slope across subgroups.
Individual trajectory
The models offer patient-specific estimated curves (Figure 2). Here, we plotted observed and fitted biomarker trajectories for 1 random patient before and after receiving mechanical ventilatory support. The patient’s observed and fitted values overlay the population-average, model-based estimates to illustrate individual variation from trajectories conditioned on outcome.
Patient-specific trajectories for 1 randomly selected patient based on outcome-stratified longitudinal models among patients within the Johns Hopkins COVID-19 Precision Medicine Analytics Platform Registry, Baltimore, Maryland, March 2020 to June 2020. The randomly selected patient was discharged on day 0 and received mechanical ventilatory support 15 days before discharge (day −15, dashed line). A–P) Solid gray lines with closed circles represent fitted values of this patient’s trajectory; dashed gray lines with open circles represent observed values of this patient’s trajectory. The patient was followed from admission until mechanical ventilation on day −15, and from ventilation until discharge on day 0. Dashed vertical line on day −15 delineates the pre- and postventilation data. Solid red, blue, and green lines represent population-average curves leading up to death, discharge, and ventilation in the overall population pre- and postventilation. The patient had no reported CRP or D-dimer data over the 4 days before discharge. Abbreviations: ALC, absolute lymphocyte count; CRP, C-reactive protein; eGFR, estimated glomerular filtration rate; Fio2, fraction of inspired oxygen; Spo2, oxygen saturation.
Model checking
For all but 1 of the biomarkers, the distributions of residuals were approximately Gaussian with constant variance. The respiratory rate models produced residuals such that spread increased with the mean value (Web Figure 3), indicating an incorrect model for the variance of estimate coefficients. We introduced robust variance estimators for the respiratory rate models and used bootstraps with 500 iterations to determine whether this improved model validity. Quantile-quantile plots of bootstrapped estimates indicated that inferences with respect to respiratory rate using robust variance were valid (Web Figure 4).
DISCUSSION
In this study of 1884 patients with COVID-19 from 1 hospital system, we used a generalization of the case–control design by stratifying longitudinal data analysis into outcome-specific strata. We describe population and individual biomarker trajectories conditioned on each stratum. Trajectories of 4 vital signs (respiratory rate, Spo2-to-Fio2 ratio, pulse, and temperature) and 4 laboratory values (CRP, ALC, eGFR, and D-dimer) clearly distinguished patients admitted for COVID-19 on the basis of their outcomes of 1) discharge without ventilation, 2) death without ventilation, 3) ventilation, 4) discharge after ventilation, and 5) death after ventilation. Before any ventilation, we observed a divergence in log(CRP), log(ALC), respiratory rate, and Spo2-to-Fio2 ratio that began approximately 8–10 days before the event such that values improved steadily up until discharge or remained unchanged or worsened up until ventilation or death. After ventilation, we again observed a divergence in log(CRP), log(ALC), respiratory rate, Spo2-to-Fio2 ratio, and eGFR values that began 10 or more days before death or discharge such that values improved until discharge and remained unchanged or worsened until death.
Our findings that Spo2-to-Fio2 ratio decreased in the days before death and increased in the days before discharge in patients with COVID-19 are consistent with how this measure correlates with the severity of lung injury and likelihood of death in patients who receive mechanical ventilatory support or who have acute respiratory distress syndrome from other causes (15, 16). Multiple studies have identified respiratory failure and acute respiratory distress syndrome as primary complications in patients with COVID-19 (7, 17), and previous work by our group identified an association between Spo2-to-Fio2 ratio and death in COVID-19 (4). Respiratory rate is also an important predictor of severe disease or death in patients with COVID-19 (4, 18, 19). This is not surprising, given its prominence in well-known prediction calculators for in-hospital death (20–22). Our trajectories of respiratory rate and Spo2-to-Fio2 ratio extend these findings to illustrate patients’ progression to respiratory failure before ventilation and subsequent failure to regain respiratory function among patients who died after receiving mechanical ventilatory support. We are also able to observe how patients who died after receiving mechanical ventilatory support were unable to regain respiratory function while receiving mechanical ventilatory support; whereas those who survived to discharge after receiving mechanical ventilatory support had clear and immediate improvement in respiratory function (as defined by a higher Spo2-to-Fio2 ratio and lower respiratory rate). Given the ease with which these vital signs can be measured continuously, understanding these trajectories is the first step toward applying a patient’s individual data points to robust population-level trajectories and gaining a better understanding of that patient’s disease course.
Our findings that patients who died with or without receiving mechanical ventilatory support had persistently higher CRP and D-dimer levels and lower ALCs are consistent with existing work on the importance of these inflammatory markers in severe SARS-CoV-2 infection (4, 5, 23–25). For example, Manson et al. (26) plotted CRP and ALC data over time from a cohort of 269 patients with a positive swab for SARS-CoV2. They observed slightly elevated CRP levels among patients who required mechanical ventilatory support and among those who died. We provide additional insight into the behavior of these inflammatory markers leading up to and after ventilation. Specifically, in our study population, CRP level consistently declined over the 15 days before discharge after receiving mechanical ventilatory support, yet CRP level remained elevated without decreasing among those who went on to die after receiving mechanical ventilatory support. The ALC consistently increased among patients who survived to discharge after receiving mechanical ventilatory support, but ALC increased only slightly and after some delay among those who died after receiving mechanical ventilatory support. Understanding the behavior of these biomarkers independent of each other is clinically helpful as models of inflammatory states emerge (20).
In our study, patients who were discharged after receiving mechanical ventilatory support regained Spo2-to-Fio2 ratio, ALC, respiratory rate, and temperature values comparable to those of patients discharged without receiving mechanical ventilatory support. In contrast, these patients were discharged at lower eGFRs and higher D-dimer levels than those discharged without receiving mechanical ventilatory support. The eGFR trajectories we observed support existing evidence that COVID-19 leads to acute kidney injury in up to 25% of patients in whom critical illness develops (27). This damage is likely compounded by the potential injurious impact of ventilation on kidney function (28, 29). The D-dimer trajectories we observed are consistent with those of prior studies linking elevated D-dimer level to an increased risk of severe disease and death (30). In addition, we showed that patients who survived to discharge but required mechanical ventilatory support maintained an elevated D-dimer level when compared with patients who were discharged without receiving mechanical ventilatory support.
The limitations of this study merit discussion. Our approach to modeling biomarker trajectories relevant to SARS-CoV-2 does not incorporate joint modeling of biomarkers, which might provide a unified picture of health and disease trajectory for a given patient. We were bound by the restrictions of case–control design and unable to predict a given patient’s trajectory, because each model requires that we know the patient’s outcome. Thus, these models cannot be used for prediction but rather provide the foundation for jointly modeling biomarker trajectories and the probability of each event. For patients receiving mechanical ventilatory support, we modeled Spo2-to-Fio2 ratio rather than the ratio of partial pressure of oxygen to Fio2, which would allow minor changes to be better observed. Spo2-to-Fio2 ratio data were reported more frequently for our study population and allowed us to compare pre- and postventilation trajectories. We chose to retrospectively characterize trajectories on the basis of ventilation, discharge, or death, yet there is significant variation in health status and quality of life for patients within each of these outcomes, and, in particular, among discharged patients. We observed significant improvements in health up until discharge, yet there are unknown long-term consequences for patients discharged after COVID-19 that should be considered in the context of this work (31). When interpreting patient trajectories, we must also recognize the circularity between medical and pharmacological interventions (mechanical ventilation and otherwise) and the biomarkers we observed throughout a patient’s hospital stay. Biomarkers are both drivers of and responses to physician intervention and complicate our understanding of temporality in a longitudinal analysis. Finally, we did not capture the dynamic nature of ventilation (e.g., adjustments in ventilator mode, Fio2, positive end-expiratory pressure, tidal volume, respiratory rate, neuromuscular blockade, sedation, prone positioning); we treated patients for whom mechanical ventilatory support was ever initiated as having received ventilatory support until their outcome, and we characterized their trajectories as a distinct patient population.
We provide robust population-level and patient-specific biomarker and vital sign trajectories for a cohort of patients admitted to hospital for COVID-19. This work is unique in that our attempt to understand these trajectories was conditioned on and preceding distinct outcomes. Our findings align with existing research, provide insight into the dynamic behavior of biomarkers and vital signs before clinical events, and lay the foundation for a joint modeling approach to predicting trajectories using population-level and patient-specific data.
ACKNOWLEDGMENTS
Author affiliations: School of Medicine, Johns Hopkins University, Baltimore, Maryland, United States (Mary G. Bowring); Department of Biostatistics, Bloomberg School of Public Health, Johns Hopkins University, Baltimore, Maryland, United States (Zitong Wang, Yizhen Xu, Joshua Betz, John Muschelli, Scott L. Zeger); and Division of Pulmonary and Critical Care, School of Medicine, Johns Hopkins University, Baltimore, Maryland, United States (Brian T. Garibaldi).
The first 2 authors contributed equally to this work. The last 2 authors were co-senior authors.
This work was supported by the National Institutes of Health (grant T32 GM007309 to M.G.B). The JH-CROWN registry was funded by Hopkins inHealth. B.T.G. received funding from the COVID-19 Administrative Supplement for the Health and Human Services Region 3 Treatment Center from the Office of the Assistant Secretary for Preparedness and Response.
We thank the Johns Hopkins Health System and its surrounding communities for working together to provide outstanding patient care and to keep each other safe during these extraordinary times. We thank members of the COVID Statistical Template Analysis Team: Dr. Brian Garibaldi, Dr. William Gray Roncal, Kenneth Harkness, Hannah Cowley, Dr. Panagis Galiatsatos, Nanette Bell, Zitong Wang, Mary Grace Bowring, Joshua Betz, Dr. Jacob Fiksel, Dr. Scott L Zeger, Dr. Aki Nishimura, Martina Fu, Dr. Eileen Scully, Dr. Annie Antar, Dr. Amita Gupta, Dr. Sherita Golden, Josh Gray, Dr. Yizhen Xu, Dr. Karen Bandeen Roche, Grant Schumock, Dr. John Muschelli, Mariam Ghobadi-Krueger, Bonnie Woods, Dr. Matthew Robinson, Dr. Paul Nagy, Dr. Timothy Niessen, Masoud Rouhizadeh, Aalok Shah, Dr. Ji Soo Kim, Dr. Jamie Perin, and Dr. Robert Bollinger.
The data set and study protocol are not available. Statistical code is available from Dr. Zeger ([email protected]).
Conflict of interest: none declared.

