


Abstract
In Parkinson’s disease (PD), the propensity to fall and the higher risk of osteoporosis converge yielding a high fracture risk. Updated National Osteoporosis Guideline Group (NOGG) guidance recommends that PD should trigger a risk assessment, for example using the FRAX tool, yet clinical pathways remain sub-optimal. To address this, we generated an algorithm for the assessment and management of bone health specifically in PD.
Within the Proactive and Integrated Management and Empowerment in Parkinson’s Disease randomised controlled trial (PRIME-UK RCT), bone-health metrics were collected, and all participants were offered a dual X-ray absorptiometry scan. The FRAX tool was used to obtain the 10-year probability of hip and major osteoporotic fracture (MOF), and the resulting NOGG risk-category recorded. Probabilities were recalculated including femoral-neck bone mineral density (FN-BMD) and/or with numeric adjustment for recurrent falls, and results compared.
Among 182 people with parkinsonism (mean age 73.8 years, 65% male, median disease duration 5 years), 28% reported a prior fragility fracture, and 40.7% recurrent falls over the previous year. 28.6% had MOF above NOGG intervention thresholds (IT); whilst 12.1% had a FN-BMD T-Score ≤ −2.5. Recalculation of FRAX with FN-BMD (n = 182) reduced fracture MOF and hip fracture probabilities; 12 (6.6%) deescalated below the IT, and 16 (8.8%) moved above the IT.
This 2024 BONE-PARK algorithm is informed by both the latest NOGG Guidelines and novel findings in a ‘real-world’ population. The algorithm will aid bone health assessment for people with PD.
Key Points
Bone health in Parkinson’s is under-recognised and under-treated, and we have demonstrated an ongoing treatment gap.
In this population, we have demonstrated dual X-ray absorptiometry is feasible but infrequently changes treatment.
Our Parkinson’s specific guidance supports clinicians and patients to recognise, investigate and treat fracture risk.
Introduction
The propensity to fall and increased osteoporosis risk converge yielding a high risk of fractures in people with Parkinson’s disease (PD). Osteoporotic fracture risk is more than doubled in PD and, in women of a given age, PD has been reported as the strongest single contributor to fracture risk [1, 2]. After a fracture, people with PD are more likely than controls to develop complications [3, 4], have difficulty regaining mobility [5] and mortality is doubled [6]. Hip fracture admissions account for 4.2% of all PD admissions in England, with an average yearly cost estimated at £13.7 million [7].
In PD neuropsychiatric symptoms, musculoskeletal and gait dysfunction contribute to high fall and fracture risk [8]. Additionally, swallowing difficulties and cognitive impairment can preclude treatment with oral osteoporosis medications. Current evidence is poorly generalisable as studies fail to capture the heterogeneity of PD, the full age spectrum nor people with cognitive impairment through restricted eligibility criteria [9, 10].
Patients and clinicians are often unaware of the excess fracture risk resulting in a major treatment gap [11]. Despite recent meta-analyses highlighting the elevated risk of fragility fracture in PD, particularly at the hip [1], clinical practice remains suboptimal. In 2020, Parkinson’s UK reported that of 1131 patients assessed, 50% had fallen, yet only one-in-six were on bone health treatment, and 73% lacked an up-to-date fracture risk assessment [12]. This highlights how bone health is commonly overlooked in clinical practice.
Since 2019, when we published the ‘BONE-PARK algorithm’ [13], which updated our 2014 guidance [14], and has been used as the gold standard for the Parkinson’s UK service improvement project [14], there have been two significant developments in the management of bone health. In September 2021, new National Osteoporosis Guideline Group UK (NOGG) guidelines were launched, which specifically mention PD as a risk factor for fracture that should trigger risk assessment. Furthermore, NOGG provides new post-FRAX fracture risk categories, which stratify patients to guide management decisions [15, 16].
FRAX is a fracture risk assessment tool that incorporates risk factors to predict the 10-year probability of sustaining a major osteoporotic fracture (MOF) or hip fracture. Bone mineral density (BMD), measured by dual X-ray absorptiometry (DXA), can be included in FRAX. This is advantageous as, whilst osteoporosis is operationally defined using BMD alone (T-Score ≤ −2.5), most fragility fractures occur in people who do not meet this criterion [17, 18]. However, a key limitation is that falls are not directly incorporated into FRAX. This is important since 60% and 39% of people with PD experience falls and recurrent falls, respectively [19]. Rather, FRAX assumes an average exposure to falls in the previous year despite falls being an independent risk factor for fracture [20–22], meaning fracture risk is likely under-estimated in those with elevated falls risk.
Aims and objectives
Our aim was to generate a new algorithm for the assessment and management of bone health in PD and related disorders, by considering (i) current treatment gaps; (ii) how including femoral neck BMD (FN-BMD) influences FRAX probabilities and subsequent NOGG-based treatment recommendations; (iii) influence of recurrent falls as a clinical risk factor. We undertook cross-sectional sub-study of people with parkinsonism to determine fracture risk in a high risk, under-served, representative population.
Methods
Study design and participants
This was a cross-sectional sub-study nested within the Proactive and Integrated Management and Empowerment in Parkinson’s Disease randomised controlled trial (PRIME-UK RCT), which is evaluating a new model of care [23]. Two hundred and fourteen people with idiopathic PD and other forms of parkinsonism were recruited from the catchment area of the Royal United Hospitals Bath NHS Foundation Trust (RUH Bath). London-Harrow Research Ethics Committee (REC reference 21/LO/0387) granted ethical approval on 14 July 2021. Further details of the trial methodology have been previously published [23].
Assessment of bone health
Bone health metrics, including FRAX risk factors, were collected as part of the baseline visit [15], along with the Clinical Frailty Scale (CFS) and Movement Disorder Society-Unified Parkinson’s Disease Rating Scale (MDS-UPDRS), a measure of PD severity. Height (nearest mm, SECA stadiometer) and weight (nearest 0.1 kg, SECA scales) were measured. If measurements were impossible (e.g. severe camptocormia, inability to stand etc.), most recent height and weight were taken from routine clinical records.
All participants were offered a DXA. Our protocol included bilateral hip and lumbar spine scans (PRIME-DXA). Forearm scans were also obtained if deemed necessary by the DXA operator (due to e.g. bilateral hip replacement). If participants had a DXA as part of their standard medical care less than 2 years prior to baseline, this was included in the analysis in the absence of a PRIME-DXA. All scans were performed by a trained DXA operator, using a Hologic Discovery A (S/N85953) Densitometer (Software version: 13.5.3) at RUH Bath. Daily quality control scans with the manufacturer-provided spine phantom, and weekly tests of reproducibility and tabletop radiographic uniformity were performed.
T-scores compare measured BMD to mean BMD of a young healthy reference population to diagnose osteoporosis. T-score site, calculation and interpretation followed international and national guidelines (Appendix 1) [24–26].
The 10-year probabilities of sustaining a MOF or hip fracture were calculated using FRAX (https://www.fraxplus.org/calculation-tool; accessed June 2024) [27], excluding and including FN-BMD (g/cm2); where both hips were scanned, the lowest of the two values was used. PD was included using rheumatoid arthritis (RA) as a proxy risk factor, as recommended by NOGG [28].
The resulting NOGG fracture risk category (‘NOGG-category’), based on FRAX probabilities with age-specific risk thresholds, was recorded. Without BMD, MOF risk is categorised as low, intermediate, high or very high. The intermediate category was subdivided into above or below the intervention threshold (IT). With inclusion of BMD, MOF and hip fracture risks were categorised as low, high or very-high [16].
Assessing current treatment gaps
We extracted data from hospital electronic prescription records, rheumatology outpatient/osteoporosis day-unit letters and DXA reports, for documented bone protective medication prescriptions and compared the NOGG treatment recommendations. Self-reported medications were used where electronic records were unavailable. Participants were considered ‘on treatment’ if bone protective medication had been started and not discontinued before the baseline visit (Appendix 2).
Bone protective treatment was recommended if FRAX probabilities without BMD were greater than the NOGG IT. After inclusion of BMD, treatment was indicated if either hip fracture or MOF risk was categorised by NOGG as ‘high’ or ‘very-high’.
Assessing the clinical value of DXA
FRAX-derived fracture probabilities and NOGG categories, calculated excluding and including BMD, were compared. The NOGG category for MOF excluding BMD was compared to the NOGG category including BMD, for either MOF or hip fracture depending on which had the highest risk category [16, 29].
Assessing the influence of recurrent falls
As per NOGG guidelines, FRAX probabilities were adjusted for recurrent falls (≥2 retrospectively self-reported falls in the previous year) by increasing the probability of MOF and hip fracture by 30% [16, 30].
Statistical analysis
Stata 18 was used for analysis. Data are described using mean/standard deviation (SD) for normally distributed variables, and if skewed, using median/inter-quartile range. Given the large sample size, it was appropriate to use paired t-tests to compare the different FRAX probabilities for a given individual, according to the central limit theorem [31]. Categorical variables were described using counts with percentages and compared by chi-squared testing.
Patient and public involvement
Patient and carer representatives were involved in the design, conduct and sharing of findings from this study.
Results
Overall, 214 people with parkinsonism were recruited into the PRIME-RCT (mean age 74.5 years SD = 8.2, 65.0% male), of whom 213 had bone health information available (Table 1).
Demographic and bone-health characteristics of the PRIME-UK population.
| Summary | |
|---|---|
| N | 214 |
| Age, mean (SD) | 74.5 (8.2) |
| Sex, n (%) | |
| Female | 75 (35.0%) |
| Male | 139 (65.0%) |
| Weight (kg), mean (SD) | 76.1 (15.9) |
| Height (cm), mean (SD) | 168.1 (9.5) |
| BMI category, n (%) | |
| Underweight | 7 (3.3%) |
| Healthy weight | 73 (34.1%) |
| Overweight | 81 (37.9%) |
| Obese | 51 (23.8%) |
| Severely obese | 2 (0.9%) |
| Diagnosis, n (%) | |
| Parkinsons disease | 184 (86.0%) |
| Parkinsons disease dementia | 4 (1.9%) |
| Lewy body dementia | 14 (6.5%) |
| Progressive supranuclear palsy | 4 (1.9%) |
| Multiple system atrophy | 3 (1.4%) |
| Corticobasal degeneration | 1 (0.5%) |
| Vascular parkinsonism | 3 (1.4%) |
| Other | 1 (0.5%) |
| Years lived with PD, median [IQR] | 5.0 [3.0–8.0] |
| MDS-UPDRS Part III, mean (SD) | 42.7 (19.9) |
| Clinical Frailty Score, n (%) | |
| 1 - Very fit | 5 (2.4%) |
| 2 - Well | 40 (18.9%) |
| 3 - Managing Well | 43 (20.3%) |
| 4 - Vulnerable | 44 (20.8%) |
| 5 - Mildly frail | 25 (11.8%) |
| 6 - Moderately frail | 30 (14.2%) |
| 7 - Severely frail | 22 (10.4%) |
| 8 - Very severely frail | 2 (0.9%) |
| 9 - Terminally ill | 1 (0.5%) |
| Hoehn & Yahr Scale, n (%) | |
| Stage 1 | 21 (9.8%) |
| Stage 2 | 67 (31.3%) |
| Stage 2.5 | 12 (5.6%) |
| Stage 3 | 64 (29.9%) |
| Stage 4 | 33 (15.4%) |
| Stage 5 | 17 (7.9%) |
| Recurrent Falls (≥2 falls over previous year), n (%) | |
| No | 118 (55.1%) |
| Yes | 88 (41.1%) |
| Unknown | 8 (3.7%) |
| Bone protective medications, n (%) | |
| None | 181 (84.6%) |
| Alendronate | 21 (9.8%) |
| Risedronate | 5 (2.3%) |
| Zoledronate | 5 (2.3%) |
| Denosumab | 1 (0.5%) |
| Unknown | 1 (0.5%) |
| Bone health data (n = 213), n (%) | |
| Previous Fragility Fracture | |
| No | 147 (69.0%) |
| Yes | 65 (30.5%) |
| Unsure | 1 (0.5%) |
| Parental hip fracture | |
| No | 167 (78.4%) |
| Yes | 29 (13.6%) |
| Unsure | 17 (8.0%) |
| Current smoking | |
| No | 212 (99.5%) |
| Yes | 1 (0.5%) |
| Taking oral glucocorticoids | |
| No | 210 (98.6%) |
| Yes | 3 (1.4%) |
| Rheumatoid arthritis (not including PD) | |
| No | 207 (97.2%) |
| Yes | 6 (2.8%) |
| Secondary osteoporosis | |
| No | 194 (91.1%) |
| Yes | 19 (8.9%) |
| Alcohol | |
| Less than 3 units/day | 174 (81.7%) |
| Three or more units/day | 39 (18.3%) |
| Probability of MOF (%) | 17.0 (11.5) |
| Probability of hip fracture (%) | 9.1 (9.3) |
186 (87%) had a DXA scan (175 PRIME-DXA scans and 11 available from previous routine NHS care) (Appendix 3). Those who did not have a DXA scan were older by a mean of 4.6 years (P = .005), had higher MDS-UPDRS Part III (motor) scores by an average of 18.2 points (P < .001), and a greater proportion were frail (82.1% vs 31.7%, P < .001) (Appendix 4). Of those who had a DXA, 12.4% had osteoporosis (T-score ≤ −2.5) and 46.8% had osteopenia (low bone mass) (T-score > −2.5 and ≤ −1.0).
FRAX excluding and including FN-BMD, was assessed for 182 participants who had a DXA scan (Figure 1).
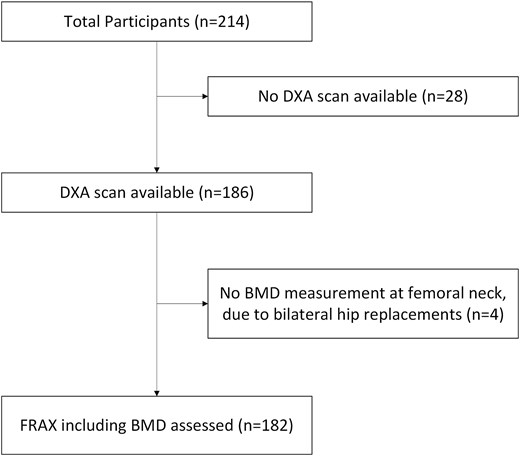
A flow chart to show how many people had FRAX assessments, with the remaining 182 forming the study population.
Is there a gap between recommendation and prescribed treatment?
Only 21 participants (11.5%) were receiving bone protective treatment (Appendix 5). FRAX calculations without BMD (n = 182) identified 52 (28.6%) people above the IT, of whom 15 (28.8%) were receiving bone protective treatment. FRAX recalculation including BMD (n = 182) led to treatment being recommended in 56 (30.8%), of whom 15 (26.8%) were on treatment. We noted that some participants were receiving treatment despite being below the NOGG IT (n = 6 both excluding and including BMD).
What additional value does DXA add?
Recalculation of FRAX including FN-BMD reduced FRAX-derived probabilities of MOF by 3.6% (P < .001) and hip fracture by 3.5% (P < .001) (Appendix 6).
The effect of including BMD on the NOGG categories is shown in Figure 2, including BMD lowered the NOGG category for 61 people (33.5%). This resulted in a de-escalation from above the IT (intermediate-above IT; high; or very high-risk) to lifestyle advice (low risk) for 12 (6.6%) participants.
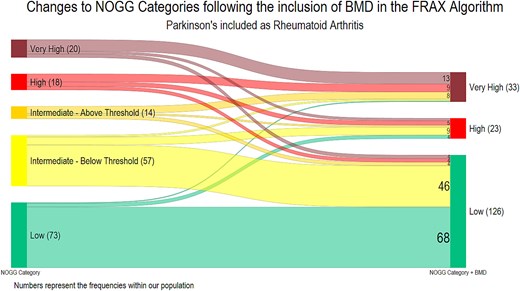
Transitions between NOGG categories following the inclusion of femoral neck bone mineral density. A Sankey diagram to show the transition between the NOGG categories following the inclusion of bone mineral density (BMD) into the FRAX algorithm (n = 182), where PD is included as RA. Prior to the addition of BMD, the NOGG category is for major osteoporotic fracture; following the inclusion of BMD the highest NOGG category for either MOF or hip fracture was included, as the site with greatest level of risk is used to inform clinical decisions. The numbers reflect the number of participants in each category.
Conversely, the NOGG category was increased for 35 (19.2%), with an escalation from below the IT (low or intermediate-below the IT) to above the IT for 16 (8.8%) participants. Overall, the recommended management (lifestyle advice, treatment or treatment plus liaison with bone health specialist) remained unchanged for 134 (73.6%).
What is the impact of recurrent falls?
Falls frequency data was collected from all 182 participants, of whom 74 (40.7%) experienced recurrent falls. Recurrent fallers did not differ from non-recurrent fallers in terms of age (mean difference = −0.2, P = .89) or sex (37.8% vs 32.4% female, respectively, P = 0.45). However, recurrent fallers had higher MDS-UPDRS Part III (motor) scores by an average of 9.8 points (P < .001) (Appendix 7).
After falls adjustments (n = 182), FRAX probabilities (excluding BMD) increased for MOF by mean 2.0% (P < .001) and hip fractures by mean 1.1% (P < .001) (Appendix 8). Thus, NOGG categories were increased for 34 people (18.7% study population and 45.9% recurrent fallers), leading to a change from lifestyle advice (low or intermediate (below IT) risk) to treatment recommendation (intermediate (above IT) or high risk) for 9 people (4.9% of study population and 12.2% of recurrent fallers), and from treatment to treatment with liaison with local bone health specialists (very high-risk) for 9 people (4.9% of study population and 12.2% of recurrent fallers) (Figure 3A).
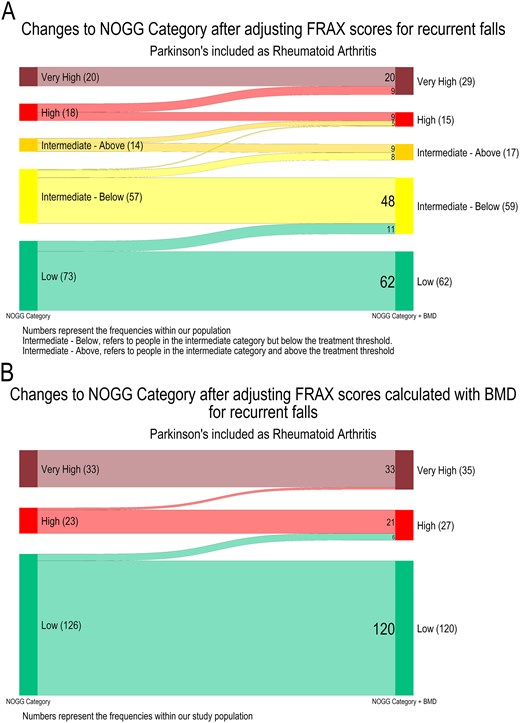
Transitions between NOGG categories following the application of the NOGG falls adjustment. A Sankey diagram to show the transition between the NOGG categories following application of the NOGG falls adjustment to the FRAX probabilities (n = 182), where PD is included as rheumatoid arthritis. The numbers on the plots represent the number of participants within each category (A) FRAX without the inclusion of Bone Mineral Density, the NOGG categories are for major osteoporotic fracture (n = 182) (B) FRAX with the inclusion of Bone Mineral Density, the NOGG categories are for either hip or major osteoporotic fracture whichever was greater (n = 182).
Recalculated FRAX probabilities (with BMD) were also adjusted for falls (n = 182) which increased MOF probabilities by mean 1.5% (P < .001) and hip fracture probabilities by mean 0.5%, (P < .001) (Appendix 9). Thus, NOGG categories were increased for 8 people (4.4% of study population and 10.8% of recurrent fallers), leading to a change from lifestyle advice [low, or intermediate (below IT) risk] to treatment recommendation [intermediate (above IT) or high risk] for 6 people (3.3% of study population and 8.1% of recurrent fallers), and from treatment to treatment with liaison with local bone health specialists (very high risk) for 2 people (1.1% of study population and 2.7% of recurrent fallers; Figure 3B).
Discussion
Despite some notable advances in bone health management, patients with PD continue to receive suboptimal care. To tackle this, we undertook a cross-sectional study of people with parkinsonism to determine their fracture risk using FRAX and the implications for treatment based on the NOGG recommendations. We identified the current treatment gaps and addressed these by generating an updated algorithm for the assessment and treatment of bone health in PD (Figure 4).
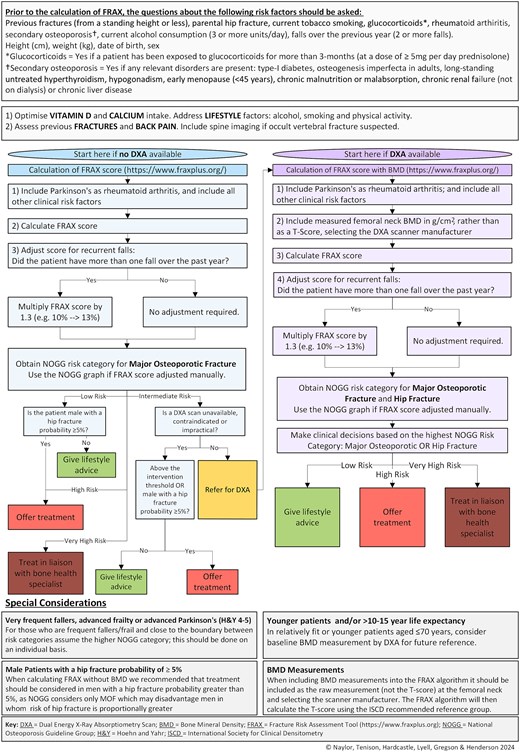
BONE PARK 2 algorithm.
Consistent with the findings of the Parkinson’s UK national audit [32], we found a substantial treatment gap within our population with less than one-third of participants receiving the NOGG-recommended treatment. Our results suggest that DXA was feasible in this population given 87% attended and we did not find that tremor, camptocormia or mobility precluded DXA scanning. Additionally, DXA was broadly reassuring as most participants (73.6%) received the same recommendation following FRAX recalculation. Importantly, the inclusion of falls as a risk factor altered the FRAX probabilities, with an additional 5% recommended for treatment after falls adjustment.
The bone health treatment gap is marked in PD, despite the latest NOGG guidance. This gap may be explained by failure to consider bone health, concerns over polypharmacy, patient preferences, bisphosphonate ‘drug-holidays’ or treatment considered ‘inappropriate’ or of insufficient priority by health care professionals, which cannot be captured using prescription data. Additionally, given that fracture risk is being under-estimated within this population as PD-associated fracture risk is not fully captured in FRAX, more patients could require treatment than identified here.
In lieu of PD being included as a risk factor in FRAX, we selected RA as a proxy marker [28]. Previous guidelines recommended the use of Secondary Osteoporosis as a proxy marker [13]; however, this approach inadvertently assumes PD-associated fracture risk is entirely mediated through low BMD, the assumption applied by FRAX to all causes of Secondary Osteoporosis [15]. Practically, this means that including PD as Secondary Osteoporosis only uplifts FRAX scores calculated without BMD. However, recent evidence suggests that PD increases fracture risk independent of BMD, which can be reflected by including PD by proxy as RA, because this uplifts FRAX score both with and without BMD [29]. However, this will still only capture some of the PD-associated fracture-risk, and ideally PD would be incorporated as a distinct risk factor into future iterations of the FRAX algorithm.
Falls are an independent risk factor for fracture [20–22], and approximately 60% of people with PD experience falls [19]; without incorporating falls into fracture risk assessment, risk is underestimated in this group. We employed the falls adjustment from the NOGG guidance [16, 30]; however, this oversimplifies the influence of falls on fracture risk. Recent meta-analyses suggest that one fall in the previous year confers a risk for fracture, and that hazard ratios increase with the number of falls; whilst an inflation could be applied per fall up to five falls [30], we maintained the NOGG-recommended approach [16]. Additionally, there is evidence that falls increase fracture risk to a greater extent in men, and that the increased risk from falls decreases with age [20, 33]. To account for these intricate effects requires the integration of falls into FRAX; whilst a falls adjustment is available on the FRAXplus platform [34], the associated cost precludes its use in NHS clinical practice. Until such updates to FRAX are freely available, the NOGG adjustment provides a pragmatic solution to guide treatment decisions in patients experiencing falls.
In those who are frail, very frequent fallers or close to the boundary of the higher NOGG-category consider, on an individual basis, management according to the higher risk category. Clinical judgement is necessary regarding patient preferences towards treatment, comorbidities and life expectancy; and recognising that FRAX including any adjustments will not completely capture fracture risk associated with parkinsonism. This should be considered alongside optimisation of vitamin D and calcium and strategies to reduce falls risk.
Currently, two websites host FRAX risk algorithms. We recommend that the new FRAXplus website (www.fraxplus.org) is used, as the old website (https://frax.shef.ac.uk/FRAX) will soon be retired. The FRAX algorithm specifies that FN-BMD should be used and, if BMD is included as a T-Score, this should be calculated using the NHANES III age 20–29 female reference data [26], in line with current international and national guidelines. However, in our experience, radiology departments may use alternative reference data and/or not specify the reference data used. Since the choice of reference population influences T-scores, it is advisable to enter the absolute value in g/cm2 for FN-BMD and select the appropriate scanner manufacturer within the FRAX tool. Inter-operator variability may affect DXA results; however, this can be minimised by following the recommendations of the International Society for Clinical Densitometry [35].
Our study had both strengths and limitations. This study is strengthened by its use of a representative sample that included participants across the Hoehn and Yahr, and CFSs, as those with more advanced disease or greater frailty are typically under-represented in research [36]. Furthermore, we collected bone health data from 99.5% of participants. There are some limitations to consider. Whilst we were able to obtain DXA scans from most participants, those who did not receive a scan (13%) were older, had worse PD symptoms and were frailer. Therefore, fracture risk is likely underestimated compared with the wider PD population. The practicalities of DXA scanning likely precluded these individuals from taking part. As well as an additional hospital appointment, DXA scanning requires the patient to transfer to the scanning bed, lie flat and maintain position for the scan duration. This is an important consideration, since frailty is associated with poorer outcomes following fragility fracture [37]. The latest NOGG guidance helps to mitigate this; if FRAX assessment (without BMD) produces a probability in the intermediate risk category but DXA scanning is unfeasible, treatment can be offered to patients above the age-specific IT. We have reflected this in our proposed algorithm.
We also acknowledge that using NOGG categories calculated without BMD to determine treatment can disadvantage men in whom risk of hip fracture is proportionally greater. Therefore, in the BONEPARK algorithm (Figure 4), we recommend that treatment also be considered in men with a FRAX hip fracture probability greater than 5% when calculating FRAX without BMD.
The ability to adjust FRAX for falls requires accurate recollection of falls over the previous year. However, both falls and falls-related injuries are under-reported among older people, and retrospective recall can be unreliable [38–40]. This might have resulted in an underestimation of fracture risk, although we sought to mirror how our proposed guidelines would be implemented in clinical practice.
We acknowledge that FRAX has other limitations, such as not accounting for the number or type of previous fractures. FRAX may underestimate fracture risk in certain individuals, such as those with multiple prior fractures; hence, the algorithm reiterates the need for clinical judgement when making treatment decisions. For those with life expectancies less than 5 years, QFracture can estimate fracture risk over shorter time periods.
This revised BONE-PARK algorithm is informed by the latest NOGG guidance. We have incorporated our novel findings regarding falls adjustment and operationalised it specifically for Parkinson’s clinicians, although it remains to be seen whether this clinically effective strategy would yield cost-effectiveness. The algorithm can be used both without and with BMD measurements and should help clinicians to assess bone health and fracture risk accurately and thenceforth make appropriate treatment decisions in tandem with their patients.
Acknowledgements:
The authors would like to thank Asjad Naqvi for the development and update of the Sankey Diagram package for Stata (https://github.com/asjadnaqvi/stata-sankey), Jackie Shipley and the clinical measurement team at the Royal United Hospitals NHS Foundation Trust for performing the DXA scans. The authors would like to thank the PPI contributors who helped to inform this study and the study participants and their carers for their participation. Mícheál Ó Breasail and Nicola Giles for organisation of the DXA scanning. Katie Lloyd & Charlotte McDonald for overall running of PRIME-RCT. Anahita Nodehi & Michael Lawton for their guidance with the statistical analysis.
Declaration of Conflicts of Interest:
None.
Declaration of Sources of Funding:
This trial was funded by Royal Osteoporosis Society (509) Parkinson’s Excellence Network (M-22-004) and Gatsby (GAT3676). E.T. is funded by a National Institute for Health and Care Research Academic Clinical Lectureship. CLG is funded by the National Institute for Health and Care Research (NIHR302394). The views expressed are those of the authors and not necessarily those of the NIHR or the Department of Health and Social Care.
References
Peel N, Griffin J.

Comments