


Abstract
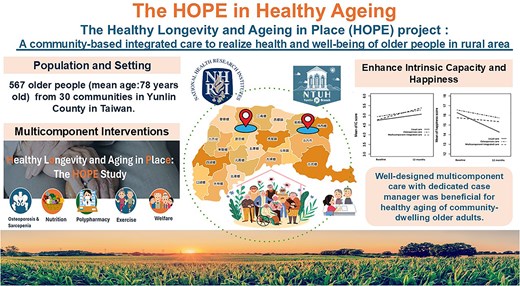
Monitoring and improving intrinsic capacity (IC) and well-being are essential for older adults to maintain functional abilities. However, evidence of effective interventions to improve IC and happiness is scarce. This study examined the effects of multicomponent interventions in the Healthy Longevity and Ageing in Place (HOPE) randomised controlled trial on IC and happiness among rural community-dwelling older adults.
This cluster randomised trial was conducted in rural communities in Taiwan (NCT05104034). Participants aged ≥50 were enrolled from September 2021 to April 2022 and randomly assigned by community level to one of three groups: multicomponent integrated care (MIC), osteoporosis care (OC) and usual care (UC). MIC included osteoporosis, sarcopenia and polypharmacy care, along with exercise and nutritional support. OC was a resource-conservative, focusing on osteoporosis screening and treatment alone. IC and happiness were measured at baseline and 12 months after follow-up. IC was assessed across cognition, locomotion, vitality, sensory and psychological domains per World Health Organization Integrated Care for Older People (ICOPE) guidelines. Happiness was measured using the 10-item Chinese Happiness Inventory. Generalised estimating equations were used to estimate the effect of the intervention.
567 residents were recruited from 30 congregate meal service centres. Mean IC score increased across all the groups, though the happiness score decreased. Compared to UC, the MIC group exhibited a significantly greater improvement in IC scores (adjusted estimate = 0.30, standard error (SE) = 0.11, P = .01), whereas OC did not show significant effects. Smaller reductions in happiness scores were observed in both the MIC (adjusted estimate = 1.46, SE = 0.48, P = .003) and OC groups (adjusted estimate = 0.95, SE = 0.48, P = .05).
MIC, including osteoporosis and pharmaceutical care, along with exercise and nutritional support, is an effective strategy to enhance IC and happiness compared to osteoporosis treatment alone and UC. This underscores the importance of comprehensive strategies for promoting healthy ageing in rural communities.
Key Points
Multicomponent care can remarkably increase intrinsic capacity (IC) scores.
Multicomponent care can also notably reduce diminishing happiness and improve vision.
Findings advocate for the use of MIC to enhance IC and happiness in rural older adults.
Introduction
Worldwide, people are living longer. The proportion of the world’s population aged >60 years is expected to nearly double from 12% in 2015 to 22% by 2050 [1]. Moreover, the number of persons aged ≥80 years is expected to triple to 426 million between 2020 and 2050 [1]. Therefore, the World Health Organization (WHO) proposed the concept of healthy ageing and emphasised the development and maintenance of functional ability that enables well-being. Intrinsic capacity (IC), the main component of functional ability, comprises all the physical and mental capacities of an individual [2]. Many studies have appraised the IC status, while limited research has been conducted to evaluate the impact of interventions on longitudinal IC changes [3, 4].
Previous evidence has shown the benefit of multicomponent interventions and the importance of patient-centred integrated care [5]. Exercise- and nutrition-based multicomponent interventions have been proven to reduce physical frailty and maintain cognitive function and quality of life (QOL). However, interventions to prevent abrupt declines in physical function and the deterioration of chronic disease conditions are crucial to realise healthy longevity. For example, Sánchez-Sánchez et al. found that the Vivifrail exercise program significantly improved the IC composite score, with positive effects on locomotion, cognition and vitality [6]. Nonetheless, since this study focused on middle-old and oldest-old adults, it may not fully represent the broader rural older adult population. Osteoporotic fractures can immediately prevent older adults from living a normal daily life, and well-established evidence has shown the benefit of osteoporosis treatment in older adults [7, 8]. One meta-analysis suggests that combining antiresorptive agents with exercise can improve bone mineral density in postmenopausal women [9], while another recent meta-analysis indicates that antiresorptive drugs significantly reduce hip fracture risk in adults aged 65 and older [10]. These findings imply that osteoporotic treatment may enhance the benefits of exercise on mobility. In addition, polypharmacy and related adverse effects can cause losses in multiple domains of IC, including cognitive, locomotor and psychological capacity [11]. Therefore, managing polypharmacy is regarded as a crucial component of the Integrated Care for Older People (ICOPE) care framework. Furthermore, recent research underscores the profound influence of positive well-being on general health, with correlations extending to mortality rates among senior demographics [12]. Other scholarly works have posited that happiness not only assists elders in surmounting disability but also propels the process of healthy ageing [13]. While IC encapsulates both the physical and mental dimensions of health, it is imperative to concurrently appraise the salutary aspects to present a comprehensive understanding of healthy ageing status. For example, the absence of depression does not imply happiness.
Notably, most current evidence has been generated from high-income countries or professional healthcare institutions, which leads to challenges when generalizing the evidence to resource-limited community settings [14]. Moreover, people aged ≥65 years in low- and middle-income countries will account for most of the older persons in the future; therefore, the related burden of an ageing society should be higher in these areas [15, 16]. Therefore, experiences and mindsets from the perspectives of rural areas with low-resource community healthcare settings are warranted to develop strategies to alleviate the global burden of ageing.
This study aimed to evaluate the effects of a multicomponent intervention—including structured exercise, nutritional support, pharmaceutical care and osteoporosis management—on IC and happiness in rural community-dwelling older adults, compared to less resource-intensive osteoporosis care (OC) intervention and usual care (UC).
Methods
Study design and setting
A three-armed, single-blind, cluster randomised controlled trial was designed and registered at ClinicalTrials.gov (Reference NCT05104034), named the Healthy Longevity and Ageing in Place (HOPE) trial. The HOPE randomised controlled trial aimed at improving healthy longevity and ageing in place of community-dwelling older adults was conducted in 30 communities in Yunlin County, a rural area in Taiwan. Recruitment and intervention took place in congregate meal service (CMS) centres within the communities. CMS provides affordable lunch options for older individuals in community centres near their homes [17]. This makes the CMS centre a platform for community activities and the delivery of social welfare healthcare benefits. This trial was designed and executed in accordance with the principles of the Declaration of Helsinki. The CMS centres were stratified according to service size before cluster randomisation (small, <20; large, ≥20 residents). Within each stratum, the CMS centres were randomised into three arms using a computer-generated random allocation sequence with the aim of an allocation ratio at the community level of 1:1:1. This trial was approved by the Institutional Review Board of the National Taiwan University Hospital and the National Health Research Institutes (protocol ID 202106076RIND and EC1101104-R1).
Participants
All community-dwelling residents aged ≥50 years who participated in the CMS were considered eligible. We selected an inclusion age of 50 for two main reasons. First, most participants within the CMS centres were 50 and older, and the cluster design made it challenging to exclude individuals by age within the same centre. Setting the threshold at 50 allowed for equitable service and minimised disparities, which facilitated the smooth conduct of the project. Second, our interventions—including exercise, nutrition and pharmaceutical care in addition to OC—aim to promote longevity, enhance QOL and support well-being. We believe individuals starting at age 50 can also benefit from these initiatives. We excluded terminally ill patients with a life expectancy of <3 months because they might not have been able to complete the evaluation during the follow-up period. We also excluded older individuals who were unable to communicate effectively or respond adequately to our questionnaire. We aimed to set the exclusion criteria to allow the broadest possible inclusion, in line with our goal of providing comprehensive services to as many participants as feasible. In addition, a more inclusive approach was necessary to ensure equitable service across all individuals within the same CMS centre and to facilitate smooth project execution. A total of 567 individuals aged ≥50 years were recruited from 30 CMS centres between September 2021 and April 2022.
Randomisation
The CMS was stratified according to service size before cluster randomisation of three arms (multicomponent integrated group, the osteoporosis group and the UC group) using a computer-generated random allocation sequence with the aim of an allocation ratio at the community level of 1:1:1. After randomisation, eligible individuals were identified according to our inclusion and exclusion criteria for every CMS, and informed consent was obtained.
Intervention
All participants were randomly assigned to one of the three intervention groups by community CMS centre level. (i) The multicomponent integrated care (MIC) group received osteoporosis, sarcopenia and polypharmacy pharmaceutical care, along with exercise training and nutritional support. Our nurses acted as coordinators of multidisciplinary care in different specialities. The execution details of each component are provided in Appendix Table 1. (ii) The OC group (named as the Screening group in the registry) received osteoporosis treatment alone when clinically indicated, according to the treatment guidelines. (iii) The UC group (named as the delayed intervention group in the registry) received delayed care initiated in the third year of this trial and received no intended intervention in the first 2 years, only performed the usual daily activities in the community, and served as the control group in this study. The rationale for the delayed care design was to address ethical concerns and to increase the willingness of older adults to participate in the trial.
Outcomes
While osteoporosis-related outcomes, such as diagnosis and treatment rates, were initially identified as study outcomes in designing the trial, we additionally included QOL, happiness and institutionalisation to address broader and more clinically relevant outcomes. Moreover, we also included IC as one of our outcomes to align with the WHO’s ICOPE framework. All the study outcomes analysed were included at the beginning or early stage of the trial. The evolution of the study outcomes and documentation in the trial registry was illustrated (Appendix Figure 1) to ensure transparency and alignment with the trial’s initial objectives. The outcomes elaborated in this study were the IC composite and happiness scores, while the happiness score was documented as other outcomes in the trial registry. The IC and happiness scores were planned to be evaluated annually for 4 and 2 years, respectively. In this study, we demonstrated the changes in IC composite and happiness scores, which were evaluated at trial entry and 12 months post-enrolment. IC and happiness scores indicate a higher number of reserved functional capacities or greater happiness. We assessed the IC composite, which comprises cognition, locomotion, vitality, sensory and psychological domains [18]. The assessment of IC referred to the ICOPE guideline and used self-reported measures with physical performance tests as follows. (i) Cognition: the Mini-Mental State Examination (MMSE) was used. An MMSE score of <24 has been shown to be highly suggestive of dementia and is determined to indicate impaired cognition [19]. (ii) Locomotion: we used the Short Physical Performance Battery (SPPB) to assess mobility and balance. The SPPB scores range from 0 to 12 points. SPPB score ≤9 indicates one or more mobility limitations [20]. (iii) Vitality: vitality was measured by dominant handgrip strength and nutritional status using the Short-Form Mini Nutritional Assessment (MNA-SF) [21]. The total MNA-SF score ranges from 0 to 14 and a score ≤11 indicate the risk of malnutrition. (iv) Sensory: the sensory domain was self-reported vision and hearing status, which were self-reported by the participants on whether they could see a newspaper or hear sound well (categorised as good or bad sight and hearing). (v) Psychological: psychological capacity was evaluated by assessing depressive symptoms using the 15-item Geriatric Depression Scale (GDS-15) [22]. A cut-off GDS-15 score >6 indicated worse psychological performance. Each domain was converted to either 1 (without impairment) or 0 (with impairment). The IC level ranged from 0 to 6, with a higher score indicating better IC. Happiness was measured using the Chinese Happiness Inventory (CHI) with 10 items [23, 24]. The original questionnaire was developed, validated and published in a Chinese version [25]. The psychometric properties of the CHI were assessed through a multi-stage systematic random sampling technique involving 600 adults aged 18–65 years residing in Kaohsiung City. Of these, 494 participants completed home interviews and returned the questionnaires. Descriptive statistics and correlation analyses were performed, along with an examination of potential differences across demographic groups (e.g. gender and age). Psychometric analyses demonstrated good reliability and validity for the CHI. Further testing among retired older adults in Taiwan also indicated high reliability and validity [24]. Scores were based on subjective feelings over the last three months, using a four-point Likert scale (0–3). The scores for each subscale were summed to obtain the total score for the 10 items. A higher score indicates a better level of happiness.
Covariate
We considered the following factors related to the functional abilities of older adults: covariates included age (50–69, 70–79 and > = 80 years), sex (male/female), body mass index, educational status (non-literate/primary school), average monthly income of <USD 330 during the past year (yes/no), living alone (yes/no) and comorbidities (hypertension, diabetes, hyperlipidaemia, hepatitis B and arthritis). Those covariates were based on a directed acyclic graph (Appendix Figure 2).
Sample size
Because the final goal of the HOPE study is to decrease disability, we performed a priori power calculation according to the final goal of the project: a decrease in institutionalisation rate. Under the condition of 80% power and a two-sided error α probability of 0.05, in a cluster randomised controlled trial for detecting the changes in institutionalisation rate, at least 19 patients in each cluster and eight clusters were considered necessary in each group. Considering a potential dropout of up to 20%, the estimated sample size was approximately 20 in each cluster and 10 clusters in each group. A total of 600 participants are estimated to be adequate to complete the study.
Statistical analysis
General linear models with the generalised estimating equation (GEE) method were used to estimate the effects of interventions on IC and happiness scores at baseline and at 12 months. The GEE approach used an exchangeable working correlation structure, accounting for the data correlation arising from repeated outcome measures for each participant, as well as the participants in the same cluster. It provides robust SEs for the parameter estimates, thus avoiding misleading inferences due to the violation of the independence assumption [26]. Additionally, we also used binary logistic regression with GEE to estimate the effect of interventions on each of the IC subitems. Statistical analyses were conducted using R programming language (version 4·2·3) with the ‘geepack’ package. The significance level was set at an alpha value of 0·05.
Results
A total of 567 eligible older adults were recruited during the enrolment phase between September 2021 and April 2022 (Appendix Figure 3). Overall, 178 participants were randomised into the MIC group, 201 into the OC group, and 188 into the UC group (Table 1). Of these, 528 (93%) completed the 12-month assessment, while 7% were lost to follow-up 12 months after the initial intervention.
Baseline characteristics (n = 567).
| UC (n = 188) | MIC (n = 178) | OC (n = 201) | P-value | ||||
|---|---|---|---|---|---|---|---|
| n | % | n | % | n | % | ||
| Sex | |||||||
| Male | 35 | 18.62 | 44 | 23.40 | 28 | 14.89 | .0275 |
| Female | 153 | 81.38 | 134 | 71.28 | 173 | 92.02 | |
| Age (years) | |||||||
| 50–69 | 41 | 21.81 | 56 | 31.46 | 62 | 30.85 | .2211 |
| 70–79 | 90 | 47.87 | 74 | 41·57 | 81 | 40.30 | |
| 80+ | 57 | 30.32 | 48 | 26·97 | 58 | 28.86 | |
| Mean/SD | 75.61 | 8.53 | 74.07 | 8.91 | 74.45 | 8.39 | .2620 |
| Body mass index | |||||||
| Mean/SD | 24·33 | 3.83 | 24.70 | 3.29 | 25.05 | 3.87 | .1560 |
| Educational status | |||||||
| Non-literate | 64 | 34.04 | 42 | 23.60 | 51 | 25.37 | .0545 |
| Primary school | 124 | 65.96 | 136 | 76.40 | 150 | 74.63 | |
| Income <USD 330 | |||||||
| No | 52 | 27.66 | 66 | 37.08 | 66 | 32.84 | .1556 |
| Yes | 136 | 72.34 | 112 | 62.92 | 135 | 67.16 | |
| Living alone | |||||||
| No | 146 | 77.66 | 144 | 80.90 | 161 | 80.10 | .7228 |
| Yes | 42 | 22.34 | 34 | 19.10 | 40 | 19.90 | |
| Comorbidity | |||||||
| Hypertension | 92 | 48.94 | 97 | 54.49 | 101 | 50.25 | .5404 |
| Diabetes | 38 | 20.21 | 46 | 25.84 | 47 | 23.38 | .4394 |
| Hyperlipidaemia | 18 | 9.57 | 19 | 10.67 | 34 | 16.92 | .0708 |
| Hepatitis B | 11 | 5.85 | 8 | 4.49 | 10 | 4.98 | .8631 |
| Arthritis | 51 | 27.13 | 31 | 17.42 | 44 | 21.89 | .0817 |
| SPPB | |||||||
| Mean/SD | 10.21 | 2.29 | 10.50 | 1.97 | 10.41 | 2.04 | .3908 |
| MMSE | |||||||
| Mean/SD | 22.65 | 4.83 | 24.00 | 4.96 | 24.31 | 5.26 | .0158 |
| MNA | |||||||
| Mean/SD | 13.55 | 0.95 | 13.49 | 1.22 | 13.68 | 0.89 | .1887 |
| GDS | |||||||
| Mean/SD | 2·22 | 2.64 | 2.04 | 2.47 | 1.73 | 2.16 | .1336 |
| Number of basal medicaments Means/SD | 5.89 | 3.71 | 5.86 | 3.53 | 5.93 | 3.88 | .945 |
MIC, multicomponent integrated care; OC, osteoporosis care; UC, usual care.
The baseline characteristics did not differ significantly between the participants in the usual, multicomponent integrated and OC groups (Table 1), except for the majority of female participants in the OC group (173 [92%] of 201). The majority of participants were female, aged 70–79 years, had a primary school education level, had an average monthly income of <USD 330 during the past year, lived with others and had hypertension.
The IC and happiness scores of the three intervention groups are presented in Table 2. Changes in the outcome variables from baseline were observed at 12 months. In the MIC, OC and UC groups, the mean improvements during the first 12 months were 0·57, 0·26 and 0·27, respectively. In contrast, the mean change in happiness for the three groups (MIC: −0·45, OC: −1·04 and UC: −1·86) indicated a decreasing pattern from baseline, with the MIC group showing a smaller decrease than the other groups.
Score and changes over time in impaired IC and happiness.
| UC | Change from baseline | MIC | Change from baseline | OC | Change from baseline | |||||||||||||
|---|---|---|---|---|---|---|---|---|---|---|---|---|---|---|---|---|---|---|
| Mean | SD | Mean | SD | (Min, Max) | Median | Mean | SD | Mean | SD | (Min, Max) | Median | Mean | SD | Mean | SD | (Min, Max) | Median | |
| IC | ||||||||||||||||||
| Baseline (n = 567) | 4.74 | 1.20 | 4.77 | 1.15 | 4.93 | 1.06 | ||||||||||||
| 12 months (n = 528) | 5.01 | 1.11 | 0·27 | 0.99 | (−2, 3) | 0 | 5.33 | 0.87 | 0.57 | 0.99 | (−2, 4) | 0 | 5.22 | 1.03 | 0.26 | 0.96 | (−3, 4) | 0 |
| Happiness | ||||||||||||||||||
| Baseline (n = 566) | 16.30 | 4.68 | 15.80 | 4.46 | 16.60 | 5.17 | ||||||||||||
| 12 months (n = 523) | 14.30 | 4.53 | −1·86 | 4.53 | (−14, 11) | −1 | 15.30 | 4.33 | −0.45 | 4.48 | (−10, 11) | −1 | 15.70 | 4.04 | −1.04 | 4.75 | (−14,14) | −1 |
IC includes cognition, locomotion, vitality, vision, hearing and psychological domains.
MIC, multicomponent integrated care; OC, osteoporosis care; UC, usual care.
The results of the GEE, considering several confounding variables, are presented in Table 3. The IC changes were significantly greater in the MIC group than in the UC group, with a difference of 0·30 in the improved IC score. The MIC group also showed a significantly smaller reduction in happiness score by a difference in reduced score of 1·46 (P-value = ·003). In terms of participants who aged equal to or more than 80, we found the MIC group exhibited significantly improved IC scores (adjusted estimate = 0·45, standard error (SE) = 0·22, P = ·04), whereas the OC group did not show significant effects. However, there are no significant improvement effects found in the happiness scores among those aged > = 80 in both MIC and OC groups. (Appendix Table 2).
Generalised estimation equation model on the effect of IC and happiness score for intervention.
| Variables | IC score | Happiness score | ||||
|---|---|---|---|---|---|---|
| Estimate | SE | P-value | Estimate | SE | P-value | |
| Intervention | ||||||
| UC | Reference | Reference | ||||
| MIC | −0.03 | 0.03 | 0.39 | −0.27 | 0.14 | .05 |
| OC | 0.02 | 0.03 | 0.57 | −0.02 | 0.15 | .92 |
| Time | ||||||
| Baseline | Reference | Reference | ||||
| 12 months | 0.28 | 0.07 | <0.001 | −1.89 | 0.34 | <.001 |
| MIC group × Time | 0.30 | 0.11 | 0.01 | 1.46 | 0.48 | .003 |
| OC group × Time | 0.0002 | 0.10 | 1.00 | 0.95 | 0.48 | .05 |
| Baseline score | 0.69 | 0.02 | <0.001 | 0.72 | 0.02 | <.001 |
| Sex | ||||||
| Male | −0.01 | 0.04 | 0.73 | −0.22 | 0.20 | .26 |
| Female | Reference | Reference | ||||
| Age (years) | ||||||
| 50–69 | Reference | Reference | ||||
| 70–79 | 0.02 | 0.04 | 0.51 | −0.09 | 0.20 | .63 |
| 80+ | −0.13 | 0.05 | 0.01 | −0.48 | 0.23 | .04 |
| Body mass index | 0.01 | 0.01 | 0.003 | −0.02 | 0.02 | .34 |
| Educational status | ||||||
| Illiterate | Reference | Reference | ||||
| Primary school | 0.21 | 0.05 | <0.001 | 0.41 | 0.20 | .03 |
| Income < USD 330 | ||||||
| No | Reference | Reference | ||||
| Yes | −0.04 | 0.03 | 0.21 | −0.03 | 0.19 | .87 |
| Living alone | ||||||
| No | Reference | Reference | ||||
| Yes | −0.04 | 0.04 | 0.40 | −0.41 | 0.20 | .04 |
| Comorbidity | ||||||
| Hypertension | −0.01 | 0.03 | 0.67 | −0.09 | 0·17 | .58 |
| Diabetes | −0.06 | 0.04 | 0.21 | 0.27 | 0·20 | .17 |
| Hyperlipidaemia | 0·09 | 0.05 | 0.06 | −0.01 | 0·23 | .95 |
| Hepatitis B | −0.11 | 0.07 | 0.13 | −0.82 | 0·38 | .03 |
| Arthritis | −0.07 | 0.04 | 0.13 | −0.49 | 0·19 | .01 |
IC, intrinsic capacity; SE, standard error.
MIC, multicomponent integrated care; OC, osteoporosis care; UC, usual care.
The mean IC score for the three groups increased over time between baseline and postintervention (Figure 1a), whereas the mean happiness score decreased slightly from baseline (Figure 1b). Regarding IC subitems, all groups generally showed improvements in locomotion, vision, and, to a lesser extent, hearing domains after the intervention (Figure 2). Nonetheless, only the odds of improvement in vision differed significantly between the MIC and UC groups, and the odds of improvement in locomotion differed significantly between the osteoporosis and UC groups (Figure 2). Subgroup analysis revealed that only patients in the OC group who received osteoporosis treatment, primarily zoledronate, showed significant improvement in the locomotion domain compared to the UC group (see Appendix Figure 4). The interventional effects on each IC subitem are presented in Appendix Table 3.
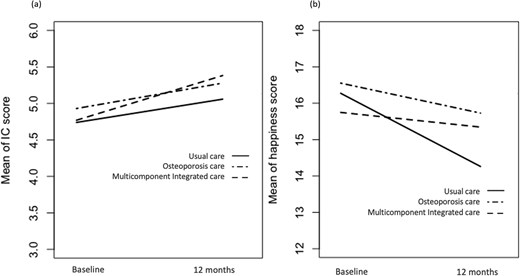
Changes in the mean of the IC and happiness score over time at baseline and 12 months in the three groups. (a) IC score; (b) Happiness score.
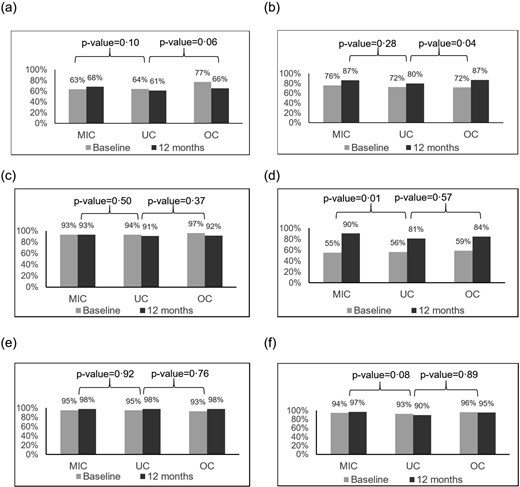
Prevalence (%) of retaining capacity with the three interventions, according to the IC subitems. (a) Cognition; (b) Locomotion; (c) Vitality; (d) Vision; (e) Hearing; (f) Psychological. MIC, multicomponent integrated care; OC, osteoporosis care; UC, usual care.
Discussion
This study incorporated a MIC intervention into primary healthcare for older adults in the community, assessing both IC composite and positive mental aspects, such as happiness. Based on the concept of integrated care for older adults in the ICOPE guidelines, we hypothesised that integrated primary healthcare would benefit the health and well-being of community residents, allowing them to age in place. Compared with the UC group, the MIC intervention significantly improved both IC and happiness. MIC is an effective intervention for improving IC and happiness among older adults living in rural communities.
Few studies have been conducted in the community, although various guidelines have emphasised the importance and benefits of community-based integrated care interventions to alleviate the soaring burden of healthcare systems in an ageing society [11, 27, 28]. To the best of our knowledge, only two studies have assessed IC composite scores after multiple interventions among community-dwelling older people [29, 30]. Giudici et al. conducted a secondary analysis of the Multidomain Alzheimer Preventive Trial (MAPT), investigating the impact of a 3-year intervention involving ω-3 polyunsaturated fatty acid supplementation, and a multidomain approach (physical activity counselling, cognitive training and nutritional advice) [29]. The study found a decrease in IC scores within the first 12 months across all groups, with no significant differences between intervention and placebo groups over time. The authors attributed the lack of a combined IC effect to the MAPT intervention’s low-intensity procedures, particularly physical activity (counselling rather than exercise training). Another study by Yu et al. examined the association between different types of intervention activities (cognitive, physical, nutritional, mental and social) and changes in IC components (cognitive, locomotor, vitality and psychological) across subgroups [30]. The results showed that the number of activities was associated with improvements in IC components. This previous study lacked a comprehensive assessment of IC as recommended by the WHO and employed an aggregated IC score derived from four IC subdomains [30].
In our study, we observed that both the UC and OC groups showed improvement in IC, with primary gains seen in the vision and locomotion domains. For vision improvements in the UC and OC groups, we hypothesise this was influenced by a Yunlin County government initiative offering free eyeglass prescriptions to senior citizens, a service widely utilised and not limited to our MIC group. This likely contributed to the observed improvements in the vision domain across all groups. However, vision improvements were significantly greater in the MIC group than in the UC group (Figure 2d, P = .01). In the MIC group, our nurses proactively assisted with welfare care beyond eyeglass evaluations for those with visual impairments. This included referring them to ophthalmology clinics per the ICOPE practice guidelines, thus contributing notably to positive outcomes. Regarding locomotion improvements in the UC and OC groups, a possible factor is Taiwan’s government-led health initiatives aimed at geriatric health and welfare. These include community-based health promotion activities and a long-term care policy by the Ministry of Health and Welfare, which supports community care stations offering disability prevention services and initiatives to strengthen exercise habits and sports health training. This universal care approach likely contributed to improvements in locomotion in the UC group. While the MIC group showed slightly higher improvement in locomotion than the UC group, (Figure 2b, P = .28) this difference was not statistically significant, likely due to less intensive exercise training in the MIC group during the first year. Notably, we observed a significant improvement in locomotion within the OC group. Among the 201 patients in the OC group, 97 received osteoporosis treatment, with 94 (97%) receiving zoledronic acid and 3 (3%) receiving denosumab. To reduce the frequency of hospital visits for older patients, we primarily opted for zoledronic acid as the treatment of choice, with denosumab reserved for those with impaired renal function. Subgroup analysis showed this improvement was significant only in those treated with anti-osteoporosis medications (AOMs), primarily zoledronic acid (Appendix Figure 4). Prior research indicates that certain AOMs may benefit muscle function [31, 32]. Thus, the high proportion of patients on AOM therapy may partly explain the significant locomotion improvements in the OC group. Further studies exploring the effects of AOMs on muscle function are warranted.
Our study demonstrated a significant improvement in visual capacity in the MIC group; however, few studies have examined the effects of multicomponent interventions involving the sensory domain. One non-randomised controlled study employed self-reported responses to the question of whether poor hearing or vision problems were a sensory domain to investigate the impact of the intervention [33], revealing no significant differences. Although this study assessed the sensory domain, hearing and vision were combined into a single sensory capacity. Consequently, we could not differentiate how the intervention individually influenced hearing or vision. In our study, the increased prevalence of vision impairment was likely attributable to the advanced mean age and increased incidence of hypertension and diabetes among the participants. We posit that the observed improvement in vision can be ascribed to our pharmaceutical care, specifically, the medication optimisation intervention aimed at mitigating the adverse effects associated with polypharmacy, notably the reduction of the anticholinergic burden (ACB) known for its impact on blurred vision [34]. However, we did not observe a reversal effect in the cognitive domain, despite the association between ACB and cognitive decline. The observed discrepancy in the reduced anticholinergic effect between vision and cognition domains may stem from pharmacological differences in how anticholinergic medications affect these functions. For vision, the effects of anticholinergic medication are often immediate, with blurred vision as a well-established, short-term risk that typically resolves soon after the drug is metabolised (onset within 30 minutes and recovery shortly after excretion). In contrast, cognitive effects tend to emerge with prolonged and higher-dose usage, making recovery more challenging. Evidence suggests that the cognitive impact of anticholinergics is both dose- and duration-dependent, with higher doses correlating with greater risk [35, 36]. In our study, approximately 50% of older adults used medications with anticholinergic properties, yet <20% had a high ACB. Additionally, the restoration of cognitive function is relatively difficult, and a longer observation period may be needed to observe improvements in cholinergic brain transmission after discontinuing anticholinergic medications [37–39]. Current evidence on the cognitive benefits of deprescribing anticholinergics is limited, and studies showing positive effects when ACB decreases remain scarce [37, 40]. Further research examining the impact of ACB reduction on cognitive recovery is essential.
In addition, the multicomponent intervention involved several interviews and interactions with research members, suggesting that older adults might have increased their social interactions during our intervention. Previous studies have indicated that a combined intervention has more sustained effects than any single-domain intervention in improving depressive tendencies in older adults [41]. The promotion of social interaction through exercise training programs or pharmaceutical care may be a crucial factor in improving mental capacity. Our study showed that the psychological domain did not change from baseline after the intervention. However, happiness exhibited different influences over time in the multicomponent group. Our subgroup analysis revealed that the MIC intervention did not demonstrate significant effects on happiness in individuals aged over 80 years. Several potential explanations could account for this finding. This population tends to have poorer health and is more prone to adverse events that may negatively impact well-being (Happiness). Additionally, previous literature has identified advanced age as a potential risk factor for reduced happiness. [42] Another possibility is the limited sample size in this subgroup, which may lack sufficient statistical power to detect meaningful effects. To address these gaps, future research focusing on this age group, with happiness as the primary outcome, is necessary to determine whether the MIC intervention is effective in this population. This supports the notion that psychological well-being is multidimensional and that the effect of the intervention on mental function might also include a positive mental element, especially when our target population comprises community-dwelling older adults who might be relatively mentally healthy.
Limitation
This study had some limitations. First, all participants during the following period could access healthcare services through national health insurance when necessary. The UC group may also have experienced aspects of integrated care, potentially leading to an underestimation of the effects of the multicomponent intervention. Second, the study’s inclusion criteria, which selectively enrolled older people who were able to receive services at CMS centres in the communities, might have limited the generalisability of these findings to the entire population. Third, self-reported responses might also introduce recall bias since older people tend to overestimate positive affect in emotional processes [43], which potentially overestimates the effectiveness of the intervention. Fourth, we did not calculate the sample using IC as an outcome; instead, we used an IC-related outcome, the institutionalisation rate, to estimate our sample size. However, we recognised that a study by Sánchez-Sánchez et al. has conducted an analysis to demonstrate the effect of a 12-week Vivifrail exercise program on IC [6]. The literature can provide data to help calculate the sample size regarding IC intervention. Besides, the study may be subject to the Hawthorne effect, where participants modify their behaviour simply because they know they are part of an experiment. However, as all three groups were aware of their involvement in the trial, any Hawthorne effect would likely be evenly distributed among them. Additionally, our use of the controlled group study design and difference in difference statistical analysis helps to mitigate this potential influence. In addition, we included objective outcomes—such as IC, fall rates and fracture events—that are less likely to be affected by participants’ subjective awareness or intentional behaviour. We did not conduct a full cost-effectiveness analysis in this study, although we acknowledge that cost considerations are critical for implementing and disseminating interventions to improve geriatric care in rural areas. However, we have included a preliminary cost estimate for the multicomponent intervention (see Appendix Table 4). Notably, the primary costs stem from the role of the case manager, referred to as the ‘Health and Welfare Manager for Community Older Adults’. This case manager is integral to the intervention model, coordinating all intervention aspects and serving as a liaison between the community and the professional healthcare team. They assist older adults with various interventions, including osteoporosis treatment, exercise training, nutritional support and pharmacological care as needed. A comprehensive cost-effectiveness analysis would be a valuable avenue for future research to assess the intervention’s broader economic impact. Finally, although happiness level was maintained in the MIC group, the minimal clinically significant change in the Chinese Happiness Inventory has not been established. Therefore, further research is needed to confirm whether this maintenance indeed confers a clinical benefit.
However, our study has some notable strengths. First, we conducted a study in 30 communities with a large sample size, providing empirical evidence of how IC might be affected by specific multifaceted intervention programs. Second, we used the IC composite score to measure the impact of different interventions on real-world practice, advocating for the benefits of the ICOPE framework and value-based healthcare in rural communities. Third, by measuring the positive elements of mental health to appraise intervention effectiveness, our study provides a different perspective that may guide future research and practice in communities.
Conclusion
Our findings affirm that incorporating multicomponent interventions, which are based on exercise training and nutritional support enhanced by osteoporosis, sarcopaenia and pharmaceutical care, into integrated primary health care could reverse IC and slow the decline in happiness compared to OC only and UC in rural community-dwelling older adults. This evidence provides insights for the future development of interventions aimed at healthy ageing in community settings.
Acknowledgements:
The authors would like to thank the following supporting members: S.P.F., W.Y.H., N.F.C., P.N.T., W.T.C., M.T.L., Y.C.L., N.H.S., C.H.T., Y.M.T., F.C.C., W.L.L., Y.H.L., C.K.C., M.T.L., R.S.Y., L.K.C., D.C.C., J.D.W., C.H.W., F.Y.H, for their efforts on data collection, participants manager, validation of this research project.
Declaration of Conflicts of Interest:
None.
Declaration of Sources of Funding:
This study was supported by grants from National Health Research Institutes (10.13039/501100004737) NHRI-11A1-CG-CO − 02-2225 − 1 to SHF and CG-111-GP-05 to CYW; and grants NTUHYL112-X021 to SHF, and NTUHYL112-F009 to SHF from the National Taiwan University Hospital Yunlin Branch.
Research Data Transparency and Availability:
The data used to support the findings of this study are available from the corresponding author upon reasonable request.
References
Author notes
S.-H. Fu and C.-Y. Wang contributed equally.

Comments