


Abstract
Medication review is integral in the pharmacological management of older inpatients.
To assess the association of in-hospital medication changes with 28-day postdischarge clinical outcomes.
Retrospective cohort of 2000 inpatients aged ≥75 years. Medication changes included the number of increases (medications started or dose-increased) and decreases (medications stopped or dose-decreased) for (i) all medications, (ii) Drug Burden Index (DBI)–contributing medications and (iii) Beers Criteria 2015 medications (potentially inappropriate medications, PIMs). Changes also included differences in (i) the number of medications, (ii) the number of PIMs and (iii) DBI score, at discharge versus admission. Associations with clinical outcomes (28-day ED visit, readmission and mortality) were ascertained using logistic regression, adjusted for age, gender and principal diagnosis. For mortality, sensitivity analysis excluded end-of-life patients due to higher death risk. Patients were stratified into : (i) ≤4, (ii) 5–9 and (iii) ≥10 discharge medications.
The mean age was 86 years (SD = 5.8), with 59.1% female. Medication changes reduced ED visits and readmission risk for patients prescribed five to nine discharge medications, with no associations in patients prescribed ≤4 and ≥ 10 medications. In the five to nine medications group, decreasing PIMs reduced risks of ED visit (adjusted odds ratio, aOR 0.55, 95% CI 0.34–0.91, P = .02) and readmission (aOR 0.62, 95% CI 0.38–0.99, P = .04). Decreasing DBI-contributing medications reduced readmission risk (aOR 0.71, 95% CI 0.51–0.99, P = .04). Differences in PIMs reduced ED visit risk (aOR 0.65, 95% CI 0.43–0.99, P = .04). There were no associations with mortality in sensitivity analyses in all groups.
Medication changes were associated with reduced ED visits and readmission for patients prescribed five to nine discharge medications.
Key Points
In-hospital medication changes in older inpatients are associated with reduced emergency department (ED) presentation and readmission for patients prescribed five to nine discharge medications.
In-hospital medication changes are not associated with ED presentation and readmission for patients on ≤4 and ≥10 discharge medications.
In-hospital medication changes are not associated with death in all groups, when end-of-life patients are excluded.
When evaluating association of medication changes with these outcomes, it is important to consider the direction of individual medication changes (medications increased and decreased) and the overall difference in number and type of medications at discharge compared to admission.
Introduction
As the population is ageing globally, a higher proportion of people are living with multimorbidity [1]. Medications are a core component of managing older adults with multimorbidity and polypharmacy, commonly defined as the use of five or more medications [2]. Whilst polypharmacy may be appropriate in some circumstances, it is important to identify instances of potentially inappropriate polypharmacy, which has been associated with adverse outcomes such as falls, cognitive and functional decline and unplanned hospitalisation [3–6]. Older adults have a higher likelihood of experiencing adverse outcomes due to age-related pharmacokinetic and pharmacodynamic changes [7, 8].
Medication review is a key strategy to ensure appropriate prescribing and deprescribing (supervised withdrawal of inappropriate medications) [9, 10]. An inpatient hospital admission presents a key opportunity to provide a comprehensive, multidisciplinary medication review. Previous systematic reviews demonstrated inconsistent findings regarding the impact of in-hospital medication review on emergency department (ED) presentations and readmissions and no impact on mortality [11–14]. A systematic review of literature from 2000 to 2019 assessing the impact of medication review in hospitalised or recently discharged older inpatients (n = 25, including studies from Europe, North America and Australia) found that medication review with co-interventions such as patient education was associated with lower risk of readmission compared to usual care [11]. The authors highlighted several limitations of existing research, such as under-representation of adults aged ≥75 years with multimorbidity and polypharmacy, who are at higher risk of medication-related harm [11]. Additionally, most studies reviewed did not report on in-hospital medication changes, including changes in medication appropriateness following medication review [11].
Medication review can result in short or long-term change(s) or no change(s) in medications. Changes may arise from a structured, comprehensive medication review or limited review in response to evolving clinical status [15]. In-hospital medication changes can be considered an indirect measure of in-hospital medication review. The aim of this study was to assess impact of medication changes during hospitalisation in adults aged ≥75 years, on clinical outcomes within 28 days (primary outcomes) and 1 year of hospital discharge (secondary outcomes).
Methods
Study design, setting and cohort
This was a retrospective cohort study of 2000 individuals aged ≥75 years, admitted to six metropolitan hospitals of varying sizes in two local health districts (LHDs), in Sydney, New South Wales (NSW), Australia from the ‘Towards Optimising Hospitalised Older adults’ MEdications’ (TO HOME) study. Details of the study design and population were published previously [16].
The following inclusion criteria were applied : (i) aged ≥75 years; (ii) consecutively admitted to Royal North Shore Hospital (n = 600), Ryde Hospital (n = 200), Hornsby Ku-ring-gai Hospital (n = 200), Concord Repatriation General Hospital (n = 700), Canterbury Hospital (n = 200) and Balmain Hospital (n = 100) for ≥48 hours under General Medicine, Geriatric Medicine and/or Rehabilitation; and (iii) survived the baseline hospital admission (hospitalisation resulting in inclusion in the study). Data for baseline admission was collected from July 2016 to June 2017.
Ethics approval
Ethics approval, including a waiver of consent, was obtained from the NSW Population and Health Services Research Ethics Committee (HREC/17/CIPHS/30).
Data measures, source and collection
Demographic and clinical characteristics
Patients meeting the inclusion criteria were electronically identified by each LHD’s performance unit (the department responsible for hospital data access, maintenance and performance monitoring) using consecutive sampling (each patient meeting the inclusion criteria was included until reaching the sample size). Demographic and clinical characteristics including medical conditions and diagnoses for baseline hospitalisation were obtained from the performance unit extract and electronic medical records (eMRs). The primary reason for baseline hospitalisation was categorised into 11 categories as published previously [16]. The Charlson Comorbidity Index (CCI), which is a validated predictor of mortality in older adults, was calculated to account for diseases [17–21]. End-of-life status was established based on (i) documentation of referral, review or being known to the community or inpatient palliative care team or (ii) the use of two or more crisis medications (Appendix 1).
Medication changes in hospital
Medications on admission and discharge, including drug name, Anatomical Therapeutic Classification (ATC) code, dose, frequency and duration were collated by trained clinical and research pharmacists from the ED assessments, inpatient progress notes, medication charts, Medication Management Plan documents [22] and discharge summaries in the eMR for baseline admission [16]. For medication-related variables, active ingredients of all regular medications were included (excluded ‘as-needed’ medications because administration was not recorded).
Medication changes in the hospital were assessed as (i) directions of medication change and (ii) differences in medications at discharge compared to admission (Table 1). Directions of medication change were defined as the number of increases (number of new medications started and number of medications with dose increases at discharge compared to admission) and the number of decreases (the number of medications ceased and the number of medications with dose decreases at discharge compared to admission). Three measures of directions of medication change were used: (i) the total number of increases and decreases, for all drug types; (ii) the number of potentially inappropriate medications (PIMs) according to the 2015 Beers Criteria [23] that were increased and decreased; and (iii) the number of Drug Burden Index (DBI)–contributing medications increased and decreased. The DBI is a measure of the cumulative exposure to anticholinergic and sedative medications [24]. These measures were chosen to describe the direct effects of medication review (the ‘journey’).
Different measures of in-hospital medication changes: directions of change and differences in medications at discharge compared to admission
| Directions of medication change | |
| Medications increased | Number of new medications started and number of medications with dose increases at discharge compared to admission (considering all drug classes) |
| Medications decreased | Number of medications ceased and number of medications with dose decreases at discharge compared to admission (considering all drug classes) |
| PIMsa increased | Number of new PIMs started and number of PIMs with dose increases at discharge compared to admission (PIMs were identified using Beers Criteria 2015) |
| PIMs decreased | Number of PIMs ceased and number of PIMs with dose decreases at discharge compared to admission |
| DBIb-contributing medications increased | Number of new DBI-contributing medications started and number of DBI-contributing medications with dose increases at discharge compared to admission (DBI is a measure of the cumulative exposure to anticholinergic and sedative medications) |
| DBI-contributing medications decreased | Number of DBI-contributing medications ceased and number of DBI-contributing medications with dose decreases at discharge compared to admission |
| Difference in medications at discharge compared to admission | |
| Difference in number of medications | Difference in overall number of medications at discharge compared to admission (considering all drug classes) |
| Difference in number of PIMs | Difference in number of PIMs at discharge compared to admission (based on Beers Criteria 2015) |
| Difference in DBI score | Difference in the DBI score at discharge compared to admission |
aPIMs, potentially inappropriate medications as per Beers Criteria 2015.
bDBI, Drug Burden Index.
Three measures for difference in medications at discharge compared to admission were used: (i) difference in overall number of medications at discharge compared to admission, for all drug classes; (ii) difference in number of PIMs at discharge compared to admission; and (iii) the difference in DBI score at discharge compared to admission. These measures were chosen to describe the overall impact of medication review (the ‘destination’). When grouping medications to report the most common medication classes in each measure, the third-level ATC code classification (pharmacological subgroup) was used.
As the effect of medication changes may differ depending on total number of discharge medications, patients were stratified by the number of discharge medications using existing definitions of polypharmacy [2] : (i) ≤4 medications, (ii) 5–9 medications (polypharmacy) and (iii) ≥10 medications (hyperpolypharmacy).
Clinical outcomes
Clinical outcomes included (i) ED presentation, (ii) unplanned hospital readmission and (iii) mortality, within 28 days of discharge from baseline hospitalisation. These outcomes were chosen as primary outcomes because these outcomes at 28 days postdischarge are common hospital key performance indicators, reflecting quality of care, patient safety and healthcare resource utilisation [25, 26]. The secondary outcome was unplanned hospital readmission within 1 year of discharge, whilst accounting for the competing risk of death, as adverse outcomes may manifest beyond 28 days. For the outcome of readmission, only unplanned readmissions were included by excluding elective admissions since these were likely not medication-related [27, 28]. Appendix 1 describes the sources of clinical outcome data and the process for restructuring readmissions from separate episodes of care to entire hospitalisations. Data from July 2016 to December 2018 were obtained for outcome analysis.
Statistical analysis
Descriptive data are presented as mean and standard deviation (SD). To examine differences in patient characteristics between different categories of the number of discharge medications, the chi-square test was used for categorical variables, and the Kruskal–Wallis test was used for continuous variables. Binary logistic regression was used to examine the association of directions of medication change and differences in medications at discharge compared to admission with the three primary outcomes. Competing risk analysis with subdistribution hazard ratios (Fine and Gray method) [29] was used to examine the effect of directions of medication change and difference in medications at discharge compared to admission on the secondary outcome. The proportional hazards assumption was tested using the Schoenfeld residuals test and graphs. Directions of medication change and differences in medications were included as continuous variables when undertaking logistic regression (for example, the number of medications increased) and binary categorical variables for competing risk analysis (for example, whether medications were increased or not). Results of logistic regression analysis are presented as odds ratios (ORs) with 95% confidence interval (95% CI) and competing risk analysis as subdistribution hazard ratios (SHRs) with 95% CI.
All analyses were adjusted for age at discharge, gender and principal diagnosis (reason for baseline hospitalisation) as these factors are known predictors of clinical outcomes postdischarge [30–32]. In a series of sensitivity analyses, the 28-day mortality models were rerun, excluding end-of-life patients. End-of-life patients likely had a higher risk of death, which may not reflect the risk of death in the broader population of older adults. All models including primary and secondary outcomes were also rerun replacing principal diagnoses by CCI (these variables are highly correlated but represent different aspects of overall health in older adults).
The results were reported in accordance with the Strengthening the Reporting of Observational Studies in Epidemiology statement for cohort studies [33]. Analyses were undertaken using the SPSS software version 27 (IBM SPSS Statistics for Windows, Version 27.0. Armonk, NY: IBM Corp. 2020) and SAS software, Version 9.4 (Copyright © 2012–2020, SAS Institute Inc., Cary, NC, USA).
Results
Patients (n = 2000) were on average 86.0 years old (SD = 5.8) with 59.1% (n = 1181) females (Table 2). The most common baseline hospitalisation presentation reason was musculoskeletal or connective tissue system disorders (n = 517, 25.9%). The mean number of medications on admission was 7.6 (SD = 4.2) and discharge was 8.7 (SD = 4.2).
Demographics, comorbidities, presentation reasons and medication changes in entire study cohort and stratified by number of discharge medications
| Characteristic | Number (%) or mean (SDa) | ||||
|---|---|---|---|---|---|
| Entire cohort (n = 2000) | ≤4 medications at discharge (n = 325) | 5–9 medications at discharge (n = 865) | ≥10 medications at discharge (n = 810) | P-valueb | |
| Demographics | |||||
| Age (years) | 86.0 (5.8) | 86.4 (6.2) | 86.5 (5.8) | 85.5 (5.6) | <.001* |
| Gender (female) | 1181 (59.1) | 199 (61.2) | 505 (58.7) | 477 (58.5) | .68 |
| Comorbidities and presentation reasons | |||||
| CCIC categories | <.001* | ||||
| 0 | 925 (46.3) | 191 (58.8) | 417 (48.2) | 317 (39.1) | |
| 1–2 | 740 (37.0) | 95 (29.2) | 336 (38.8) | 309 (38.1) | |
| 3+ | 335 (16.8) | 39 (12.0) | 112 (12.9) | 184 (22.7) | |
| Palliative status | 98 (4.9) | 22 (6.8) | 33 (3.8) | 43 (5.3) | .09 |
| Principal diagnosis for index admission | <.001* | ||||
| Musculoskeletal or connective tissue system | 517 (25.9) | 79 (24.3) | 214 (24.7) | 224 (27.7) | |
| Respiratory | 322 (16.1) | 35 (10.8) | 141 (16.3) | 146 (18.0) | |
| Neurological and psychiatric | 308 (15.4) | 65 (20.0) | 136 (15.7) | 107 (13.2) | |
| Cardiac and circulatory system | 220 (11.0) | 22 (6.8) | 99 (11.4) | 99 (12.2) | |
| Genitourinary system | 148 (7.4) | 19 (5.8) | 74 (8.6) | 55 (6.8) | |
| Gastrointestinal system | 122 (6.1) | 32 (9.8) | 54 (6.2) | 36 (4.4) | |
| Dermatological | 101 (5.1) | 19 (5.8) | 42 (4.9) | 40 (4.9) | |
| Infection | 79 (4.0) | 11 (3.4) | 30 (3.5) | 38 (4.7) | |
| Haematological and neoplasms | 61 (3.1) | 9 (2.8) | 25 (2.9) | 27 (3.3) | |
| Endocrine and metabolic disorders | 35 (1.8) | 11 (3.4) | 12 (1.4) | 12 (1.5) | |
| Other | 87 (4.4) | 23 (7.1) | 38 (4.4) | 26 (3.2) | |
| Directions of medication change | |||||
| Medications increased | 1684 (84.2) | 220 (67.7) | 714 (82.5) | 750 (92.6) | <.001* |
| Medications decreased | 1238 (61.9) | 157 (48.3) | 514 (59.4) | 567 (70.0) | <.001* |
| PIMsd increased | 149 (7.5) | 15 (4.6) | 48 (5.5) | 86 (10.6) | <.001* |
| PIMs decreased | 279 (14.0) | 40 (12.3) | 113 (13.1) | 126 (15.6) | .22 |
| DBIe medications increasedf | 404 (20.2) | 24 (7.4) | 145 (16.8) | 235 (29.0) | <.001* |
| DBI medications decreasedg | 408 (20.4) | 52 (16.0) | 169 (19.5) | 187 (23.1) | .02* |
| Difference in medications at discharge compared to admission | |||||
| Difference in number of medications | 1607 (80.4) | 235 (72.3) | 664 (76.8) | 708 (87.4) | <.001* |
| Difference in number of PIMs | 388 (19.4) | 58 (17.8) | 158 (18.3) | 172 (21.2) | .23 |
| Difference in DBI scoreh | 737 (36.9) | 81 (24.9) | 293 (33.9) | 363 (44.8) | <.001* |
aSD, standard deviation; bP-value <.05 indicated with *; cCCI, Charlson Comorbidity Index; dPIMs, potentially inappropriate medications as per Beers criteria 2015, eDBI, Drug Burden Index, fNumber and percentage of patients with at least one DBI-contributing medication increased at discharge compared to admission, gNumber and percentage of patients with at least one DBI-contributing medication decreased at discharge compared to admission, hNumber and proportion of patients with a difference in the DBI score at discharge compared to admission.
In-hospital medication changes were common. For example, for directions of medication change, 84.2% (n = 1684) had at least one medication increased and 61.9% (n = 1238) had at least one medication decreased. With differences in medications at discharge compared to admission, 80.4% (n = 1607) of the cohort had changes to the number of medications at discharge. The most common drug classes in each category of medication change are described in Appendix 2. For example, at the patient level, the most common drug class increased overall was drugs for constipation (n = 588, 34.9% of all patients with medications increased), and the most common drug class decreased overall was antithrombotics (n = 216, 17.4% of all patients with medications decreased).
The prevalence of most medication change variables increased significantly with an increasing number of discharge medications. For example, the percentage of patients with at least one medication decreased was 48.3% (n = 157) when taking ≤4 medications, 59.4% (n = 514) when taking 5–9 medications and 70.0% (n = 567) when taking ≥10 medications (P < .001).
At 28 days after discharge from the baseline hospitalisation, 20.4% (n = 408) presented to ED, 19.4% (n = 388) were readmitted and 5.5% (n = 110) had died. Figure 1 shows that the percentage of patients experiencing primary outcomes varied significantly between patients in different categories of the number of discharge medications (unadjusted analysis). For example, the proportion of patients experiencing 28-day ED presentation and readmission increased significantly with increasing categories of the number of discharge medications (P < .05). The most common reason for both 28-day ED presentation and 28-day readmission was musculoskeletal or connective tissue disorders, mostly due to falls or fractures (28-day ED presentations: n = 103/408 musculoskeletal, n = 62 falls/fractures; 28-day readmissions: n = 70/388 musculoskeletal, n = 30 falls/fractures). The most common reason for 28-day death was neurological and psychiatric disorders (n = 29/110), most commonly dementia (n = 16). One year after discharge, 66.4% (n = 1328) were readmitted and 25.3% (n = 506) died.
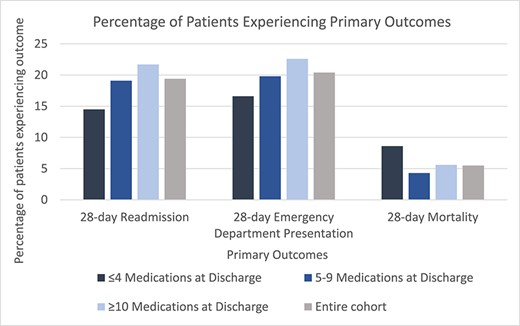
Percentage of patients experiencing primary outcomes in entire cohort and stratified by number of discharge medications
The odds of 28-day outcomes varied between outcomes, exposures and groups. In patients taking five to nine medications (but not in the other two groups), directions of medication change and difference in medications at discharge compared to admission were associated with odds of 28-day readmission and ED presentation (Table 3). Specifically, in terms of directions of change, for patients prescribed five to nine discharge medications, lowering the number of PIMs was associated with reduced odds of 28-day readmission [adjusted OR, aOR 0.62, 95% CI (0.38–0.99), P = .04], as was lowering number of DBI-contributing medications [aOR 0.71, 95% CI (0.51–0.99), P = .04]. In this group, lowering the number of PIMs also reduced the odds of 28-day ED presentation [aOR 0.55, 95% CI (0.34–0.91), P = .02]. Furthermore, in this group, the difference in number of medications at discharge compared to admission reduced the odds of ED presentation [aOR 0.86, 95% CI (0.77–0.96), P = .01], as did the difference in number of PIMs at discharge compared to admission [aOR 0.65, 95% CI (0.43–0.99), P = .04]. In terms of 28-day mortality, when including all patients, medication changes increased odds across all groups. However, when end-of-life patients were removed as a preplanned sensitivity analysis, directions of change and differences in medications at discharge compared to admission did not impact the odds of 28-day mortality in any group (Appendix 3).
Associations of directions of medication change and differences in medications at discharge compared to admission with clinical outcomes at 28 days stratified by number of discharge medications
| Medication change variable | Readmission | ED presentation | Mortalitya | |||||||
|---|---|---|---|---|---|---|---|---|---|---|
| ORb | 95% CIc | P-value | OR | 95% CI | P-value | OR | 95% CI | P-valued | ||
| Directions of medication change | ||||||||||
| ≤4 medications at discharge (n = 325) | ||||||||||
| Medications increased | Unadjusted | 0.95 | 0.72–1.26 | 0.72 | 0.93 | 0.72–1.22 | .62 | 0.70 | 0.46–1.05 | .08 |
| Adjustede | 0.99 | 0.74–1.31 | .93 | 0.99 | 0.75–1.31 | .92 | 0.65 | 0.42–1.00 | .05 | |
| Medications decreased | Unadjusted | 1.02 | 0.87–1.20 | .82 | 0.96 | 0.81–1.13 | .61 | 1.37 | 1.18–1.60 | <.001* |
| Adjusted | 1.01 | 0.85–1.20 | .88 | 0.95 | 0.80–1.14 | .60 | 1.40 | 1.18–1.67 | <.001* | |
| PIMsf increased | Unadjusted | 0.86 | 0.20–3.58 | .83 | 0.73 | 0.17–3.09 | .67 | 0.72 | 0.10–5.17 | .75 |
| Adjusted | 0.91 | 0.21–4.03 | .90 | 0.73 | 0.16–3.34 | .68 | 0.77 | 0.10–5.78 | .80 | |
| PIMs decreased | Unadjusted | 1.70 | 0.85–3.42 | .13 | 1.45 | 0.73–2.90 | .29 | 1.06 | 0.39–2.89 | .91 |
| Adjusted | 1.38 | 0.67–2.85 | .38 | 1.35 | 0.65–2.77 | .42 | 1.21 | 0.40–3.79 | .74 | |
| DBIg medications increasedh | Unadjusted | 0.96 | 0.38–2.41 | .93 | 0.44 | 0.12–1.72 | .24 | 2.44 | 1.15–5.19 | .02* |
| Adjusted | 1.04 | 0.41–2.63 | .93 | 0.48 | 0.12–1.91 | .30 | 2.92 | 1.28–6.68 | .01* | |
| DBI medications decreasedi | Unadjusted | 0.99 | 0.56–1.74 | .97 | 1.10 | 0.66–1.82 | .71 | 1.37 | 0.76–2.44 | .29 |
| Adjusted | 0.89 | 0.50–1.60 | .71 | 1.09 | 0.65–1.84 | .74 | 1.49 | 0.79–2.81 | .22 | |
| 5–9 medications at discharge (n = 865) | ||||||||||
| Medications increased | Unadjusted | 0.98 | 0.88–1.08 | .68 | 0.96 | 0.87–1.06 | .43 | 1.30 | 1.10–1.53 | .002* |
| Adjusted | 0.98 | 0.89–1.09 | .76 | 0.97 | 0.87–1.07 | .53 | 1.35 | 1.13–1.61 | .001* | |
| Medications decreased | Unadjusted | 0.98 | 0.89–1.08 | .68 | 0.94 | 0.84–1.04 | .21 | 1.40 | 1.22–1.60 | <.001* |
| Adjusted | 0.96 | 0.87–1.06 | .40 | 0.92 | 0.83–1.02 | .11 | 1.37 | 1.18–1.58 | <.001* | |
| PIMs increased | Unadjusted | 1.48 | 0.79–2.77 | .22 | 1.01 | 0.51–2.01 | .97 | 3.00 | 1.27–7.08 | .01* |
| Adjusted | 1.63 | 0.86–3.12 | .14 | 1.11 | 0.55–2.24 | .77 | 3.45 | 1.38–8.62 | .01* | |
| PIMs decreased | Unadjusted | 0.62 | 0.39–1.00 | .05 | 0.56 | 0.34–0.92 | .02* | 1.88 | 1.23–2.88 | .004* |
| Adjusted | 0.62 | 0.38–0.99 | .04* | 0.55 | 0.34–0.91 | .02* | 1.75 | 1.13–2.71 | .01* | |
| DBI medications increased | Unadjusted | 0.79 | 0.52–1.21 | .28 | 0.72 | 0.47–1.11 | .14 | 1.51 | 0.79–2.90 | .21 |
| Adjusted | 0.99 | 0.63–1.56 | .97 | 0.85 | 0.54–1.34 | .47 | 2.19 | 1.06–4.52 | .03* | |
| DBI medications decreased | Unadjusted | 0.71 | 0.51–0.99 | .04* | 0.73 | 0.53–1.00 | .05 | 1.57 | 1.10–2.24 | .01* |
| Adjusted | 0.71 | 0.51–0.99 | .04* | 0.73 | 0.53–1.01 | .06 | 1.56 | 1.08–2.25 | .02* | |
| ≥10 medications at discharge (n = 810) | ||||||||||
| Medications increased | Unadjusted | 0.95 | 0.88–1.02 | .18 | 0.97 | 0.91–1.05 | .48 | 1.05 | 0.92–1.18 | .49 |
| Adjusted | 0.95 | 0.88–1.03 | .21 | 0.98 | 0.91–1.05 | .57 | 1.05 | 0.92–1.20 | .44 | |
| Medications decreased | Unadjusted | 1.09 | 1.00–1.19 | .05 | 1.05 | 0.96–1.14 | .32 | 1.14 | 0.99–1.31 | .07 |
| Adjusted | 1.08 | 0.99–1.18 | .08 | 1.04 | 0.95–1.13 | .42 | 1.13 | 0.98–1.30 | .10 | |
| PIMs increased | Unadjusted | 0.93 | 0.59–1.46 | .74 | 1.01 | 0.51–2.01 | .97 | 1.86 | 1.05–3.27 | .03* |
| Adjusted | 1.03 | 0.65–1.63 | .92 | 0.95 | 0.60–1.50 | .82 | 2.34 | 1.25–4.38 | .01* | |
| PIMs decreased | Unadjusted | 0.91 | 0.63–1.31 | .61 | 1.06 | 0.75–1.50 | .74 | 0.74 | 0.35–1.59 | .44 |
| Adjusted | 0.92 | 0.63–1.34 | .65 | 1.04 | 0.74–1.48 | .82 | 0.84 | 0.39–1.79 | .65 | |
| DBI medications increased | Unadjusted | 0.84 | 0.64–1.11 | .22 | 0.82 | 0.63–1.08 | .16 | 1.33 | 0.90–1.96 | .15 |
| Adjusted | 0.94 | 0.71–1.24 | .64 | 0.91 | 0.69–1.21 | .51 | 1.72 | 1.14–2.59 | .01* | |
| DBI medications decreased | Unadjusted | 1.00 | 0.78–1.27 | .99 | 1.13 | 0.90–1.42 | .30 | 1.16 | 0.79–1.71 | .45 |
| Adjusted | 1.02 | 0.80–1.31 | .86 | 1.14 | 0.90–1.44 | .27 | 1.27 | 0.86–1.86 | .23 | |
| Difference in medications at discharge compared to admission | ||||||||||
| ≤4 medications at discharge (n = 325) | ||||||||||
| Difference in number of medications | Unadjusted | 0.96 | 0.82–1.11 | .56 | 0.95 | 0.82–1.09 | .44 | 1.27 | 1.11–1.45 | <.001* |
| Adjusted | 0.95 | 0.82–1.11 | .51 | 0.95 | 0.82–1.10 | .51 | 1.30 | 1.12–1.52 | <.001* | |
| Difference in number of PIMs | Unadjusted | 1.68 | 0.88–3.21 | .11 | 1.43 | 0.75–2.71 | .28 | 0.63 | 0.20–2.00 | .43 |
| Adjusted | 1.43 | 0.73–2.81 | .30 | 1.37 | 0.69–2.70 | .37 | 0.76 | 0.22–2.64 | .66 | |
| Difference in DBI scorej | Unadjusted | 0.99 | 0.41–2.42 | .98 | 0.58 | 0.28–1.22 | .15 | 0.77 | 0.28–2.13 | .62 |
| Adjusted | 1.32 | 0.52–3.38 | .56 | 0.65 | 0.30–1.44 | .29 | 0.58 | 0.18–1.94 | .38 | |
| 5–9 medications at discharge (n = 865) | ||||||||||
| Difference in number of medications | Unadjusted | 0.92 | 0.83–1.02 | .12 | 0.85 | 0.77–0.95 | .004* | 1.16 | 0.98–1.36 | .08 |
| Adjusted | 0.93 | 0.84–1.03 | .18 | 0.86 | 0.77–0.96 | .01* | 1.18 | 1.00–1.41 | .06 | |
| Difference in number of PIMs | Unadjusted | 0.80 | 0.55–1.17 | .26 | 0.66 | 0.43–1.00 | .05 | 1.94 | 1.25–3.01 | .003* |
| Adjusted | 0.80 | 0.55–1.16 | .24 | 0.65 | 0.43–0.99 | .04* | 1.86 | 1.20–2.90 | .01* | |
| Difference in DBI score | Unadjusted | 1.38 | 0.79–2.41 | .26 | 1.20 | 0.70–2.06 | .50 | 0.44 | 0.19–1.02 | .06 |
| Adjusted | 1.63 | 0.90–2.98 | .11 | 1.33 | 0.75–2.36 | .32 | 0.45 | 0.18–1.11 | .08 | |
| ≥10 medications at discharge (n = 810) | ||||||||||
| Difference in number of medications | Unadjusted | 0.91 | 0.84–1.00 | .05 | 0.95 | 0.88–1.02 | .17 | 0.97 | 0.84–1.11 | .62 |
| Adjusted | 0.92 | 0.85–1.00 | .05 | 0.96 | 0.89–1.04 | .30 | 0.98 | 0.84–1.13 | .73 | |
| Difference in number of PIMs | Unadjusted | 0.90 | 0.65–1.24 | .52 | 1.05 | .77–1.41 | 0.77 | 1.28 | 0.78–2.10 | .34 |
| Adjusted | 0.91 | 0.66–1.27 | .59 | 1.06 | 0.78–1.44 | .73 | 1.41 | 0.84–2.38 | .19 | |
| Difference in DBI score | Unadjusted | 0.79 | 0.51–1.24 | .31 | 0.78 | 0.50–1.21 | .26 | 1.33 | 0.60–2.99 | .49 |
| Adjusted | 0.87 | 0.54–1.39 | .55 | 0.85 | 0.54–1.35 | .50 | 1.80 | 0.72–4.46 | .21 | |
aIncludes patients with end-of-life status, separate sensitivity analysis excluding end-of-life patients for 28-day mortality shown in Appendix 3, bOR, odds ratio obtained from logistic regression models, cCI, confidence interval, dP-values <.05 indicated with *, eORs were obtained after running logistic regression models adjusted for age, gender and principal diagnosis, fPIMs, potentially inappropriate medications as per Beers criteria 2015, gDBI, Drug Burden Index, hNumber of DBI-contributing medications increased at discharge compared to admission, iNumber of DBI-contributing medications decreased at discharge compared to admission, jDifference in the DBI score at discharge compared to admission.
Similarly, changes made to medications during admission were associated with 1-year readmission, for patients prescribed five to nine medications at discharge but not in the other two groups (Table 4). For patients on five to nine medications, having medications increased was associated with a significantly reduced risk of 1-year readmission [adjusted SHR, aSHR 0.72, 95% CI (0.57–0.92), P = .01], as were having PIMs lowered [aSHR 0.77, 95% CI (0.60–0.98), P = .03] and having a difference in the overall number of medications at discharge compared to admission [aSHR 0.77, 95% CI (0.64–0.92), P = .01]. The sensitivity analyses that replaced presentation reason with CCI gave similar results in all models (Appendices 4 and 5).
Associations of directions of medication change and differences in medications at discharge compared to admission with 1-year readmission risk stratified by the number of discharge medications
| Medication change variable | SHRa | 95% CIb | P-valuec |
|---|---|---|---|
| Directions of medication change | |||
| ≤4 medications at discharge | |||
| Medications increased | 1.00 | 0.71–1.41 | .99 |
| Medications decreased | 1.15 | 0.86–1.54 | .35 |
| PIMsd increased | 0.68 | 0.40–1.17 | .16 |
| PIMs decreased | 1.14 | 0.75–1.73 | .54 |
| DBIe medications increasedf | 0.66 | 0.33–1.32 | .24 |
| DBI medications decreasedg | 0.92 | 0.61–1.38 | .70 |
| 5–9 medications at discharge | |||
| Medications increased | 0.72 | 0.57–0.92 | .01* |
| Medications decreased | 0.96 | 0.81–1.14 | .67 |
| PIMs increased | 0.82 | 0.60–1.13 | .23 |
| PIMs decreased | 0.77 | 0.60–0.98 | .03* |
| DBI medications increased | 0.88 | 0.68–1.15 | .35 |
| DBI medications decreased | 0.87 | 0.70–1.07 | .18 |
| ≥10 medications at discharge | |||
| Medications increased | 0.97 | 0.71–1.33 | .86 |
| Medications decreased | 1.17 | 0.97–1.41 | .10 |
| PIMs increased | 0.99 | 0.78–1.26 | .95 |
| PIMs decreased | 0.97 | 0.78–1.22 | .82 |
| DBI medications increased | 0.97 | 0.79–1.18 | .73 |
| DBI medications decreased | 1.02 | 0.83–1.24 | .86 |
| Difference in medications at discharge compared to admission | |||
| ≤4 medications at discharge | |||
| Difference in number of medications | 0.91 | 0.66–1.27 | .60 |
| Difference in number of PIMs | 1.10 | 0.77–1.56 | .60 |
| Difference in DBI scoreh | 1.11 | 0.79–1.56 | .55 |
| 5–9 medications at discharge | |||
| Difference in number of medications | 0.77 | 0.64–0.92 | .01* |
| Difference in number of PIMs | 0.83 | 0.66–1.03 | .09 |
| Difference in DBI score | 0.85 | 0.71–1.01 | .07 |
| ≥10 medications at discharge | |||
| Difference in number of medications | 0.98 | 0.77–1.25 | .87 |
| Difference in number of PIMs | 1.10 | 0.89–1.35 | .38 |
| Difference in DBI score | 0.98 | 0.82–1.18 | .87 |
aSubdistribution hazard ratios from competing risk analysis adjusted for age, gender and principal diagnosis, bCI , confidence interval, cP-values <.05 indicated with *, dPIMs, potentially inappropriate medications as per Beers criteria 2015, eDBI, Drug Burden Index, fHaving at least one DBI-contributing medication increased at discharge compared to admission (binary variable: yes/no), gHaving at least one DBI-contributing medication decreased at discharge compared to admission (binary variable: yes/no), hHaving a difference in the DBI score at discharge compared to admission (binary variable: yes/no).
Discussion
The results demonstrate that 28 days after discharge, in-hospital medication changes including deprescribing were associated with reduced ED presentation and readmission for patients taking 5–9 medications on discharge, but no associations were observed in patients prescribed ≤4 or ≥10 discharge medications. This suggests potential benefits of in-hospital medication changes on ED visit and readmission for patients prescribed five to nine medications specifically. Additionally, while in-hospital medication changes were associated with an increased risk of mortality across all groups, this association was not observed when end-of-life patients were excluded. These findings suggest overall safety of medication changes across all groups.
Previous systematic reviews evaluating the impact of in-hospital medication reviews concluded that there may be potential reductions in readmissions and ED visits and no impact on mortality, in older inpatients with polypharmacy, which are consistent with our findings [11–13]. In contrast, one systematic review concluded that there are no effects on readmission and ED visits [14]. Researchers have highlighted that existing studies use inconsistent polypharmacy definitions and different inclusion criteria regarding specific drug classes and comorbidities [11]. They emphasised the need for future reviews and meta-analyses to synthesise results according to consistent patient characteristics, including the number of medications, to gain an overall understanding of the impact of in-hospital medication reviews [11].
Unplanned 28-day readmission rates in older Australians vary from 7.4% to 24.9% [26, 34–37], consistent with the 19.4% prevalence in this study. A high percentage of older inpatients were, however, readmitted within a year. Different studies use different definitions of unplanned hospitalisation and include different age groups, making it challenging to make direct comparisons. The high 1-year readmission rate in the current study may be due to including adults aged ≥75 years. Additionally, whilst we reconstructed episodes of care to entire hospitalisations using indications of transfer and time difference, some transfers without documented indications of transfer may have been misclassified as readmission. One study concluded that failure to account for transfers in hospitalisation data can result in 7%–10% overestimation in the number of hospitalisations [38]. Future efforts to record administrative hospital data to closely reflect hospitalisations would facilitate more accurate identification of readmissions. Furthermore, our outcome was all-cause readmissions, which may be a clinically and economically important outcome of in-hospital medication changes. Whilst drug-related readmissions may represent a more direct outcome, they are not accurately captured in our administrative data [39]. Estimating drug-related readmissions from these data can result in significantly lower prevalence [40–42]. Future studies with a larger sample size or using alternative methods such as manual identification may facilitate inclusion of this outcome.
Our findings should be interpreted in the context of usual care provided during unplanned admissions, where the clinical focus is on managing the acute cause of admission, tailored to each patient [15]. For example, presenting with an infection may result in focusing on appropriate anti-infective prescribing, whereas presentation with a fall may prioritise identification and deprescribing of fall-increasing medications. In critically unwell patients, acute physiological changes such as hypotension may prompt clinicians to adjust antihypertensives to manage the immediate condition, rather than reviewing long-term blood pressure control. Therefore, unplanned hospital admission may be a good opportunity for some medication changes and not others.
Our findings may explain why some studies have not found an impact of medication review [9–11]. For example, when prescribed five to nine medications, differences in number of PIMs and DBI score at discharge compared to admission were not associated with 28-day readmission. However, when looking at directions of change, specifically lowering PIMs and DBI-contributing medications, these measures were associated with 28-day readmission. Therefore, our findings provide guidance for future studies to investigate both the journey (directions of medication change) and destination (differences in medications at discharge compared to admission).
Our findings have other implications for future research, by directing the design of future studies to optimise medications in older adults. For example, it may be particularly useful to target in-hospital medication reviews to patients taking five to nine medications. Future research comparing medication changes made in hospitals with those made postdischarge may provide guidance on whether the timing and setting of medication changes impact outcomes. Additionally, medications can change extensively postdischarge in older adults [43]. Future studies following the patient’s medication journey postdischarge may provide further insights.
We applied the 2015 Beers Criteria to identify PIMs, which was the latest version during our study period. The 2023 update includes several changes but these would not reflect contemporary, real-world prescribing practice for our cohort [44]. For example, opioids were the most common PIMs increased during admission in our study, identified based on their prescription in patients with a history of falls or fractures, as per 2015 criteria. The 2023 update, however, additionally includes opioids prescribed in delirium as PIMs. Incorporating these updates in future studies will ensure alignment with the latest available evidence.
The present study has several strengths. This study included a novel, in-depth analysis of in-hospital medication changes assessing directions of medication change and differences in medications at discharge compared to admission. The inclusion criteria of adults aged ≥75 years is another strength, as previous studies have particularly highlighted the need to study this age group [11]. The use of a consecutive sample means that the findings are representative of practice in the study setting.
Limitations firstly include the assumption that medication changes in the hospital are due to comprehensive medication review. Some changes may have been prescribing errors and not due to comprehensive review. We compared admission and discharge medications to identify in-hospital changes. It is possible that pre-admission medications may have been altered on admission, but those changes were not classified as in-hospital medication changes. We applied the 2015 Beers Criteria to identify PIMs, which does not reflect the 2023 updates. The sample was limited to patients who survived the baseline admission in three services from six hospitals, which may not be representative of other services or hospitals. Only medications prescribed for regular use were included, with the exclusion of ‘as-needed’ medications. We did not consistently have data on whether medications were short or long-term, and therefore, this was not considered. We did not investigate postdischarge adverse medicine events, which would provide further insights into the safety and efficacy of medication changes. It is possible that our study was underpowered to detect the impact of some of the variables in each of the groups. Some of our findings may have been chance findings from multiple comparisons. Other potential predictors of adverse clinical outcomes that were not considered include frailty, who manages medications postdischarge and social factors such as education level and health literacy. Lastly, we did not include the patient’s perspective of in-hospital medication changes.
Conclusions
We observed an association of in-hospital medication changes and reduced 28-day all-cause ED presentation and readmission for patients prescribed five to nine discharge medications. Our findings also provide guidance for future studies to consider the medication change journey and destination. Our findings inform development of future patient prioritisation criteria for in-hospital medication reviews.
Acknowledgements:
The authors acknowledge assistance with data collection from Sharon Chen, Linda Koria, Bonnie Liu, Mitchell Redston and Marissa Sakiris. We acknowledge assistance with data management from Terry Jin, Jessica Nguyen and Meggie Zhang. We also acknowledge Patrick J Kelly, David G. Le Couteur and Rosalie Viney’s contribution to conceptualisation of the study design. Open-access publishing was facilitated by The University of Sydney, via the Council of Australian University Librarians.
Data availability:
The data that support the findings of this study are available from the corresponding author upon reasonable request, within privacy/ethical restrictions.
Declaration of Conflicts of Interest:
None declared.
Declaration of Sources of Funding:
NSW Health Translational Research Grant 274; Northern Sydney Local Health District; Sydney Local Health District; Penney Ageing Research Unit, Royal North Shore Hospital; Rothwell Fellowship in Geriatric Pharmacotherapy.

Comments