


Abstract
Few studies have examined the associations between pain trajectories and cognitive function in older adults. This study explored the associations between pain trajectories and different cognitive domains in older adults from a network perspective.
Data on pain trajectories were derived from the Health and Retirement Study between 2010 and 2020 using latent class growth analyses. Measurements of key cognition domains, including memory, attention, calculation, orientation and language, were included. Linear regression and network analysis were performed to evaluate the associations between different pain trajectories and cognition.
A total of 9,551 older adults were included in this study and three trajectories of pain were identified. After controlling for the covariates, persistent severe pain trajectory was associated with poorer overall cognition, memory and calculation ability when compared to mild or non-persistent pain trajectory. In the pain and cognition network model, memory (expected influence (EI) = 0.62), language (EI = 0.58) and calculation (EI = 0.41) were the most central domains.
Pain trajectories appeared stable over time among older adults in this study. Severity of persistent pain was an important risk factor for poor cognition, especially in relation to memory and calculation domains. Interventions targeting memory, language and calculation domains might be useful in addressing cognitive decline in older adults with persistent pain.
Key Points
Pain trajectories appeared stable over time among older adults.
Severe persistent pain was an important risk factor for poor overall cognition, memory and calculation.
Interventions targeting memory, language and calculation may help address cognitive decline in older adults with persistent pain.
Introduction
Pain is a distressing experience involving a complex interplay of sensory input and emotions [1]. Pain that persists for >3–6 months is typically defined as chronic pain [2], which is common among older adults. The estimated prevalence of chronic pain ranged between 25 and 76% in community-dwelling older adults [3] and between 83 and 93% for older adults living in residential care settings [4]. Chronic pain is often comorbid with various geriatric syndromes such as physical dysfunction, falls and disability [5], and is associated with a substantial burden on the healthcare system [6].
With ageing, the prevalence of cognitive problems is steadily increasing in older adults [7]. In a previous meta-analysis, the prevalence of mild cognitive impairment among community-dwelling older adults was 5.56% (95% confidence interval (CI): 13.24–18.03%). The association between chronic pain and cognitive function in older adults has been explored in previous research, which showed mixed findings. For instance, a retrospective cohort study found that baseline chronic pain was associated with an increased risk of dementia among older adults [8]. In contrast, a 4-year follow-up study indicated that baseline pain was not a risk factor for future cognitive decline in older adults [9]. Moreover, the duration of pain may play an important role in its impact on cognition. A meta-analysis revealed that pain duration of ≥4.5 years was associated with pain-related cognitive changes [10]. To better understand the association between pain and cognition, it is thus important to focus on the effects of long-term pain (i.e. persistent pain) rather than short-term pain.
Previous studies have explored the association between persistent pain and cognitive function among older adults using different definitions of persistent pain [11–13]. Two studies defined persistent pain as moderate or severe pain across two consecutive assessment time points [12, 13], while another study assessed and combined various aspects such as the duration, degree and impact of pain into an overall score to indicate persistent pain [11]. However, persistent pain can be viewed as a longitudinal representation that involves not only the duration and degree of pain, but also the dynamic changes in pain severity over time. Neither of the two previous persistent pain studies considered the changes in the duration and degree of pain together. Therefore, it is important to consider the trajectory of pain in understanding its association with cognition function over time.
In addition, although persistent pain could affect cognitive function, the associations between pain and the various cognitive domains remain unclear. Cognitive domains exhibit a hierarchical structure, where lower levels of cognition encompass more fundamental sensory and perceptual processes, while higher levels of cognition usually involve executive functioning and cognitive control [14, 15]. A common approach to classifying cognitive domains is based on general abilities, such as memory, language and executive function [14]. These domains interact with each other and reveal complex patterns of cognitive performance. Therefore, it is important to elucidate the interrelationships between pain trajectory and different key cognitive domains [16]. Most studies have previously evaluated the associations between pain and cognition based on the total score of cognition measures [11]. However, each domain is a facet of cognition that can directly influence one another, even in the absence of obvious cognitive diseases. Network analysis is a novel and powerful method that could effectively map out the interconnections between specific domains [17]. By constructing a network model on pain trajectories and cognition, the interconnectedness between pain trajectories and individual cognitive domains could be examined [18]. Moreover, identifying the most influential domains within the network could help focus on the target areas to improve cognitive function based on different pain trajectories in older adults [17, 19].
The study objectives are (1) to examine the pain trajectories in community-dwelling older adults based on a 10-year follow-up study; (2) to investigate the association between pain trajectories and different cognitive domains (i.e. memory, attention, calculation, temporal orientation, language); (3) to construct pain and cognition network models, and to identify the most central nodes in relation to cognitive function in older adults with different pain trajectories.
Methods
Study design and participants
This study was based on a secondary analysis of the data from the Health and Retirement Study (HRS), which is a nationally representative cohort of adults aged ≥50 or above in the USA [20]. The HRS was initially conducted in 1992 (wave 1) based on face-to-face interviews. Subsequent waves were performed every 2 years using email and telephone interviews. The HRS was approved by the Institutional Reviewing Board at the University of Michigan and the National Institute on Aging (HUM00061128), and all participants provided written informed consent.
In this study, the pain trajectories were derived from the data collected between 2010 (wave 10) and 2020 (wave 15) since the data collected in these waves contained a relatively complete set of pain-related data compared to the HRS dataset in previous waves. To examine the associations between persistent pain trajectories and cognition, the data collected in the 2020 wave was used. Participants were included if they completed the assessment on pain from waves 10 to 15 and were not diagnosed with dementia or Alzheimer’s disease at wave 15. Following previous HRS research [21], missing data on cognition assessment and covariates were imputed using corresponding information of the same individual in the previous wave, and multiple imputation techniques were employed for the remaining missing values [22]. The flowchart of sample selection is shown in Figure S1.
Assessment of pain
Self-reported pain was assessed with two questions: ‘Are you often troubled with pain?’, answer ‘no’ was coded as 0, indicating the absence of pain. Participants who answered with ‘yes’ proceeded to the second question: ‘How bad is the pain most of the time: mild, moderate or severe?’, which assessed the severity of the pain, with 1 representing mild pain, 2 representing moderate pain and 3 representing severe pain. The self-reported pain status ranged from 0 to 3, with a higher score indicating more severe pain.
Assessment of cognition
Five cognition domains including memory, attention, calculation, orientation and language were measured with validated cognitive tests, all of which have been widely used to measure cognition in previous HRS studies [23–25]. The overall cognition score was calculated by summing the scores from the five cognitive domains, which ranged from 0 to 42, with a higher score indicating better cognition performance. More details of the cognition measurements are shown in supplemental material.
Covariates
The covariates included age, sex, education level, living status, drinking alcohol, smoking, number of chronic diseases, pain limited activity, use of pain medication, depressive symptoms and insomnia symptoms (supplemental methods).
Statistical analysis
The pain trajectories over 10 years were identified using latent class growth analyses (LCGA) [26]. Traditional approaches usually divide the whole population into subpopulations based on categorical variables at a point in time, such as individuals who may be classified as having depression or not, alcohol drinkers and non-drinkers. Of note, an individual’s health status is dynamic and can change over time. By using LCGA, participants with similar changes in pain status over a time course can be classified into a distinct group, which was identified as a trajectory.
To compare the differences between pain trajectories, two-sample independent t-test (between two groups) and ANOVA (between three or more groups) were conducted for continuous variables based on the number of pain trajectories identified in this study. Chi-square tests were performed for categorical variables. A two-sided significance test with a P value of 0.05 was considered statistically significant. In addition, linear regression models were performed to evaluate the associations between different pain trajectories and cognition. In this study, three models were adopted for controlling demographic data: depression, insomnia, and disease-related and pain-related variables.
Finally, network analysis was performed to explore the central nodes that could activate the interrelations between pain trajectories and cognition [27]. Mixed graphical modelling was applied to construct the network models, which was suitable for datasets containing mixed types of variables [28]. To assess the essential domains within the pain and cognition network, we used the measure of expected influence (EI). A higher EI value indicates that a node has a stronger influence on other nodes within the network [29]. The details of LCGA and network analysis are presented in the supplemental method. Moreover, after controlling for potential confounding factors, we generated two sensitivity network analyses to enhance the reliability of the network findings.
All the analyses were performed using R program [30]. Specifically, the LCGA method was performed using ‘lcmm’ packages [31], the linear regression was performed using ‘lme4’ package [32], while ‘mgm’ and ‘bootnet’ packages were used to construct the network model and test the stability of the network [28, 33], respectively.
Results
Different trajectories of pain and basic characteristics
A total of 9,551 older adults were included in the study. Based on the selection criteria shown in Table S1, three pain trajectories were identified (Figure 1): mild or non-persistent pain trajectory (N = 6,014), persistent moderate pain trajectory (N = 2,146) and persistent severe pain trajectory (N = 1,391). Table 1 shows the basic demographic characteristics. Compared with the other two trajectories, older adults with persistent severe trajectory were more likely to be younger and smoking, and less likely to be male, living with others and drinking alcohol, and had lower education levels. Moreover, those with persistent severe trajectory were more likely to have their activities limited by pain, use pain medicine in the past 3 months, and have a history of depression, insomnia and more than two types of chronic diseases. Compared with the other two groups, the 8-item Center for Epidemiological Studies Depression Scale and Jenkins Sleep Scale scores were significantly higher in the persistent severe pain trajectory group. Furthermore, older adults in persistent severe trajectory also exhibited the lowest scores across the cognition domains.
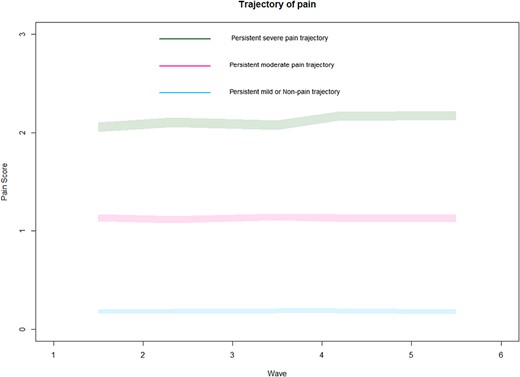
Trajectories of pain in older adults. Each colour represents a type of pain trajectory.
Characteristics of participants (N = 9,551)
| Characteristics | Persistent mild or non-pain trajectory (N = 6,014) | Persistent moderate pain trajectory (N = 2,146) | Persistent severe pain trajectory (N = 1,391) | P value | Effect size |
|---|---|---|---|---|---|
| N (%) | φ | ||||
| Male | 2,604 (43.3) | 798 (37.2) | 398 (28.6) | <0.001 | 0.107 |
| Living with others | 3,578 (59.5) | 1,156 (53.9) | 635 (45.7) | <0.001 | 0.099 |
| Higher level education | 5,136 (85.4) | 1,762 (82.1) | 1,048 (75.3) | <0.001 | 0.094 |
| Drink alcohol | 3,678 (61.2) | 1,201 (56.0) | 645 (46.4) | <0.001 | 0.105 |
| Smoking | 3,051 (50.7) | 1,214 (56.6) | 869 (62.5) | <0.001 | 0.087 |
| Pain limiting activity | 759 (12.6) | 992 (46.2) | 1,068 (76.8) | <0.001 | 0.522 |
| Used pain medication | 3,558 (59.2) | 1,625 (75.7) | 1,005 (72.3) | <0.001 | 0.155 |
| ≥2 types chronic diseases | 2,564 (42.6) | 1,187 (55.3) | 936 (67.3) | <0.001 | 0.182 |
| History of depression | 862 (14.3) | 598 (27.9) | 691 (49.7) | <0.001 | 0.299 |
| History of sleep disorder | 709 (11.8) | 423 (19.7) | 414 (29.8) | <0.001 | 0.176 |
| Mean (SD) | η2 | ||||
| Age (years) | 75.06 (9.42) | 75.41 (9.53) | 73.97 (8.71) | <0.001 | 0.002 |
| Total CESD-8 score | 0.96 (1.56) | 1.83 (2.12) | 2.83 (2.51) | <0.001 | 0.116 |
| Total JSS score | 1.48 (0.67) | 1.71 (0.72) | 1.95 (0.78) | <0.001 | 0.093 |
| Total cognition score | 26.13 (6.39) | 25.43 (6.20) | 23.98 (5.91) | <0.001 | 0.014 |
| Memory score | 10.29 (3.81) | 9.97 (3.73) | 9.27 (3.61) | <0.001 | 0.009 |
| Attention score | 1.86 (0.51) | 1.86 (0.51) | 1.82 (0.57) | 0.041 | 0.001 |
| Calculation score | 3.37 (1.87) | 3.17 (1.91) | 2.80 (1.93) | <0.001 | 0.011 |
| Temporal orientation score | 3.78 (0.51) | 3.77 (0.52) | 3.74 (0.52) | 0.010 | 0.001 |
| Language score | 6.82 (2.47) | 6.66 (2.38) | 6.35 (2.33) | <0.001 | 0.005 |
Notes: CESD-8, 8-item Center for Epidemiological Studies Depression Scale; JSS, Jenkins Sleep Scale; φ, effect size of chi-square test; η2, effect size of ANOVA test.
Association of persistent pain and cognition
Table 2 shows the association of different pain trajectories and overall cognition score. In Model 1, after adjusting for basic sociodemographic variables, participants in the persistent moderate pain trajectories had a significantly lower total cognition score (β = −0.32, 95% CI = −0.60, −0.05, P = 0.018). Similarly, participants in the persistent severe pain trajectory also had a lower overall cognition score (β = −1.48, 95% CI = −1.81, −1.15, P < 0.001). However, in Model 2, after controlling for pain-related factors and chronic diseases, the association between total cognition score and moderate pain trajectory was not significant (β = −0.17, 95% CI = −0.45, 0.11, P = 0.246), while the association between total cognition score and persistent severe pain trajectories remained significant (β = −0.98, 95% CI = −1.36, −0.61, P < 0.001). We further adjusted for depressive and insomnia symptoms in Model 3 and found that participants in the severe pain trajectory had a significantly lower overall cognition score compared to those with mild or non-persistent pain trajectory (β = −0.71, 95% CI = −1.09, −0.34, P < 0.001). Moreover, of the variables that were adjusted for, all except for insomnia symptoms (β = −0.05, 95% CI = −0.11, 0.01, P = 0.089) were significantly associated with overall cognition score in all the models (P < 0.001). Table 3 shows the associations between pain trajectories and different cognition domains. Compared with mild or non-persistent pain trajectory, participants in the severe pain trajectory had a lower memory (Model 3: β = −0.42, 95% CI = −0.54, −0.25, P < 0.001) and calculation score (Model 3: β = −0.19, 95% CI = −0.31, −0.06, P = 0.002).
Association between pain trajectories and total cognition score
| Depressive symptom trajectory group | Model 1 | Model 2 | Model 3 | |||
|---|---|---|---|---|---|---|
| β (95% CI) | P value | β (95% CI) | P value | β (95% CI) | P value | |
| Mild or non-persistent pain trajectory | Reference | Reference | Reference | |||
| Persistent moderate pain trajectory | −0.32 (−0.60, −0.05) | 0.018 | −0.17 (−0.45, 0.11) | 0.246 | 0.05 (−0.32, 0.23) | 0.718 |
| Persistent severe pain trajectory | −1.48 (−1.81, −1.15) | <0.001 | −0.98 (−1.36, −0.61) | <0.001 | −0.71 (−1.09, −0.34) | <0.001 |
| Age | −0.18 (−0.19, −0.19) | <0.001 | −0.17 (−0.18, −0.16) | <0.001 | −0.17 (−0.18, −0.16) | <0.001 |
| Male | −1.06 (−1.29, −0.82) | <0.001 | −0.89 (−1.13, −0.65) | <0.001 | −0.94 (−1.17, −0.70) | <0.001 |
| Higher level education | 5.02 (4.72, 5.32) | <0.001 | 4.89 (4.59, 5.18) | <0.001 | 4.75 (4.45, 5.05) | <0.001 |
| Living with others | 1.32 (1.09, 1.56) | <0.001 | 1.18 (0.95, 1.42) | <0.001 | 1.08 (0.85, 1.32) | <0.001 |
| Drink alcohol | 1.59 (1.36, 1.83) | <0.001 | 1.44 (1.20, 1.67) | <0.001 | 1.43 (1.19, 1.66) | <0.001 |
| Smoking | −0.81 (−1.05, −0.58) | <0.001 | −0.75 (−0.98, −0.52) | <0.001 | −0.74 (−0.97, −0.51) | <0.001 |
| ≥2 types chronic diseases | −0.89 (−0.51, −0.31) | <0.001 | −0.84 (−1.07, −0.61) | <0.001 | ||
| Pain limiting activity | −0.69 (−0.97, −0.40) | <0.001 | −0.38 (−0.67, −0.08) | <0.001 | ||
| Used pain medicine | 1.13 (0.79, 1.26) | <0.001 | 1.05 (0.82, 1.29) | <0.001 | ||
| Total CESD-8 score | −0.23 (−0.29, −0.16) | <0.001 | ||||
| Total JSS score | −0.05 (−0.11, −0.01) | 0.089 | ||||
Notes: CESD-8, 8-item Center for Epidemiological Studies Depression Scale; JSS, Jenkins Sleep Scale.
Model 1: after adjusting for sex, age, high-level education, living with others, current smoking, alcohol consumption; Model 2: Model 1+ chronic diseases + pain limited activity+ take pain medicine; Model 3: Model 2 + CESD-8 score + JSS score. Bolded values represents p value is less than 0.05.
Associations between pain trajectories and cognition domains
| Depressive symptom trajectory group | Model 1 | Model 2 | Model 3 | |||
|---|---|---|---|---|---|---|
| β (95% CI) | P value | β (95% CI) | P value | β (95% CI) | P value | |
| Mild or non-persistent pain trajectory | Reference | Reference | Reference | |||
| Memory | ||||||
| Persistent moderate pain trajectory | −0.20 (−0.37, −0.03) | 0.02 | −0.08 (−0.26, 0.10) | 0.38 | −0.01 (−0.19, 0.17) | 0.90 |
| Persistent severe pain trajectory | −0.89 (−1.10, −0.69) | <0.001 | −0.58 (−0.81, 0.35) | <0.001 | −0.42 (−0.54, −0.25) | <0.001 |
| Attention | ||||||
| Persistent moderate pain trajectory | 0.01 (−0.01, 0.03) | 0.38 | 0.02 (−0.005, 0.04) | 0.11 | 0.02 (−0.001, 0.05) | 0.06 |
| Persistent severe pain trajectory | −0.01 (−0.03, 0.02) | 0.56 | 0.01 (−0.017, 0.05) | 0.32 | 0.02 (−0.008, 0.06) | 0.14 |
| Calculation | ||||||
| Persistent moderate pain trajectory | −0.09 (−0.18, −0.01) | 0.03 | −0.08 (−0.17, 0.01) | 0.08 | −0.06 (−0.16, 0.03) | 0.17 |
| Persistent severe pain trajectory | −0.31 (−0.14, −0.20) | <0.001 | −0.23 (−0.35, −0.11) | <0.001 | −0.19 (−0.31, −0.06) | 0.002 |
| Orientation | ||||||
| Persistent moderate pain trajectory | −0.01 (−0.03, 0.01) | 0.42 | −0.01(−0.03, 0.02) | 0.63 | −0.01 (−0.03, 0.02) | 0.69 |
| Persistent severe pain trajectory | −0.03 (−0.06, −0.001) | 0.009 | −0.02 (−0.06, 0.01) | 0.10 | −0.02 (−0.05, 0.01) | 0.16 |
| Language | ||||||
| Persistent moderate pain trajectory | −0.03 (−0.03, 0.02) | 0.58 | −0.02 (−0.14,0.09) | 0.70 | 0.001 (−0.11, 0.12) | 0.975 |
| Persistent severe pain trajectory | −0.22 (−0.05, 0.10) | <0.001 | −0.15 (−0.30, −0.01) | 0.04 | −0.09 (−0.25, 0.05) | 0.205 |
Notes: CESD-8, 8-items Center for Epidemiological Studies Depression Scale; JSS, Jenkins Sleep Scale.
Model 1: after adjusting for sex, age, high-level education, living with others, current smoking, alcohol consumption; Model 2: Model 1 + chronic diseases + pain limited activity+ take pain medicine; Model 3: Model 2 + CESD-8 score + JSS score. Bolded values represents p value is less than 0.05.
Network analysis results
Figure 2 shows the network structure and centrality of pain and cognition domains in older adults (primary network model). Memory (EI = 0.62), language (EI = 0.58) and calculation (EI = 0.41) were the most central domains in the pain and cognition model. The associations between pain and these three domains were negative (edge weight < 0). In sensitivity network analyses shown in Figure S2 and Figure S3, after controlling for covariates that might influence the interrelationships of pain and cognition, the most central cognitive domains remained similar to those found in the primary network analysis. In terms of the stability and accuracy of primary network analysis, Figure S4 shows that the CS-coefficient of EI was 0.75, indicating the centrality values of networks were stable and accurate. Figure S5 illustrates the range of bootstrapped 95% CIs for estimated edge weights, indicating that edges were reliable and stable. Figure S6 and Figure S7 show that the EI and edges were significantly different within the network models.
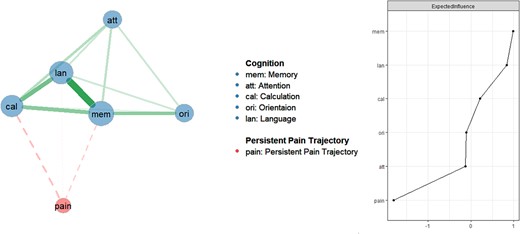
Network analysis of pain and cognition domains in older adults (primary network analysis).
Discussion
In this study, three distinct pain trajectories based on over 9,500 community-dwelling older adults were identified. Compared to mild or non-persistent pain trajectory, persistent severe pain trajectory was associated with poorer overall cognition, memory and calculation ability. Moreover, memory, calculation and language were the most influential domains in the pain and cognition network model among older adults.
Previous studies have identified different pain trajectories among specific populations (e.g. older adults, nursing home residents, older adults with knee pain or back pain) with varying patterns [34–36]. For example, one 17-year study conducted among older adults identified two activity-limiting pain trajectories: low-stable and moderate-increasing [37]. In addition, another study identified four distinct pain trajectories in nursing home residents, including consistent pain, decreasing-increasing pain, increasing-decreasing pain and persistent pain [34]. In contrast, our study identified three distinct pain trajectories. The variability in pain trajectories across studies might be due to differences in study samples, sample size and the pain measurements used. In addition, we found that the pain trajectories among older adults were stable over the 10-year period, which is consistent with studies conducted in older adults with knee pain and back pain [35, 38], as well as in patients with non-specific neck pain [39]. Therefore, stable pain trajectories might reflect the normal pain manifestations and patterns in the population.
Compared to those with mild or non-persistent pain trajectory, older adults with persistent severe pain trajectory had poorer overall cognitive performance, suggesting that the severity of persistent pain appears to be an important risk factor in poor cognition. Previous longitudinal studies found that compared with the non-persistent pain group, older adults who were exposed to more severe long-term pain had a significantly faster cognitive decline [13] and a higher risk of dementia [12]. Of note, we did not find any significant association between persistent moderate pain trajectory and overall cognitive function after controlling for the relevant confounders (e.g. pain limited activity, pain medicine use, chronic comorbidity, depressive and insomnia symptoms). It is possible that only persistent severe pain but not moderate pain might lead to alterations of brain, such as grey matter volume and anterior white matter tracts, which can disrupt the functioning of neural networks involved in cognition [40, 41]. In addition, changes of these brain structures might also implicate cognitive reserve, potentially resulting in a decline in cognitive function [41].
In this study, persistent severe pain trajectory was associated with poorer memory and calculation ability, implying that the negative relationship between severe pain trajectories and poor overall cognitive performance was mainly driven by the decline in these two domains. This finding was also supported by the network analysis results, in which memory and calculation were the most influential domains in the pain and cognition network. Previous studies have also found that individuals with chronic pain exhibited poorer memory function compared to healthy controls [12, 42, 43]. In a longitudinal study, older adults with persistent pain experienced accelerated memory decline [12]. Conversely, individuals with persistent pain were more susceptible to memory biases, which could further worsen or perpetuate the experience of pain [44]. These findings suggest that there may be a bidirectional relationship between pain and memory function. Some researchers proposed that these relationships could be partially mediated through psychological distress [45–47]. Therefore, psychological therapies that address symptoms such as depression or anxiety might be beneficial in reducing memory decline in people with persistent pain [48].
Compared with mild or non-persistent pain, persistent severe pain was significantly associated with lower calculation ability in this study. Calculation specifically relies on working memory capacity to store and manipulate information [49], and previous research found that pain could impede working memory function [42]. For instance, a meta-analysis indicated that individuals with chronic pain consistently showed deficits in working memory, regardless of the differences in terms of working memory tests or chronic pain populations [50]. In addition, although attention is a critical component of working memory [51], we did not find any significant association between persistent severe pain and attention in this study. This contrasts with previous studies that found that people with chronic pain often experienced difficulties in maintaining attention and concentration [52, 53]. However, through network analysis, we found that attention exhibited strong associations with calculation and memory, suggesting the relationships between attention and pain may be indirectly mediated through the memory or calculation ability. Overall, these findings highlight the detrimental effects of chronic pain on working memory and emphasise the need for targeted interventions to address such cognitive dysfunction in patients with persistent pain. For instance, a previous study found that acupuncture could improve both pain and working memory in pain patients with osteoarthritis [54].
Language was another influential domain with a higher EI value, suggesting its crucial role in maintaining the network model of pain and cognition. Language involves the ability to understand and produce language, which is closely connected with executive functions [55]. People with chronic pain may show mild to moderate impairment in executive function [56]. However, in the regression results, after controlling for depressive and insomnia symptoms, persistent severe pain trajectory was not significantly associated with language, thus the role of language in affecting pain and other cognitive functions requires further exploration.
This study has several strengths. We used a large sample size, which enhanced the generalizability of the findings. Furthermore, a 10-year observational period allowed us to examine changes and trends of persistent pain over time. Moreover, sensitivity analyses for both regression and network analyses were performed, which provided further validation and ensured the reliability of the results. However, there were several limitations in this study. First, pain status was self-reported rather than objectively measured, which might lead to recall bias. In addition, ‘no’ pain was defined by asking ‘Are you often troubled with pain?’; however, this question would not imply the absence of pain due to its description of ‘often’. Second, cognition function is a complex concept with multiple domains [57], and certain cognitive domains, such as processing speed and intelligence, were not assessed in the HRS. Third, due to insufficient data on the cause, nature, cause and site of pain, the course of relevant illnesses could not be included in the analyses. The association between cognition and pain trajectory in specific subgroups, such as persistent cancer pain, neuropathic pain and postsurgical pain, could not be evaluated [58]. Fourth, due to the observational design of this study, it was not possible to determine a causal relationship between pain trajectories and cognition.
In conclusion, this study highlighted the importance of identifying the pain trajectories in examining their associations with cognitive function in older adults. Severity of persistent pain was an important risk factor for poor cognition, especially in relation to memory and language function. Interventions targeting memory and calculation ability might be useful in addressing cognitive decline in older adults with persistent pain. The effects of pain management on cognitive decline in older adults need to be examined in future interventional research.
Acknowledgements
The authors are grateful to all participants and clinicians involved in this study.
Declaration of Conflicts of Interest
None.
Declaration of Sources of Funding
The HRS (Health and Retirement Study) is sponsored by the National Institute on Aging (grant number: NIA U01AG009740) and is conducted by the University of Michigan. The study was supported by the National Science and Technology Major Project for investigational new drug (2018ZX09201-014), the Beijing Hospitals Authority Clinical Medicine Development of special funding support (XMLX202128) and the University of Macau (MYRG2019-00066-FHS; MYRG2022-00187-FHS).
References
Author notes
He-Li Sun, Wei Bai, Pan Chen, Ling Zhang and Qinge Zhang contributed equally to this work.

Comments