


Abstract
The study explores whether frailty at midlife predicts mortality and levels of biomarkers associated with Alzheimer’s disease and related dementias (ADRD) and neurodegeneration by early old age. We also examine the heritability of frailty across this age period.
Participants were 1,286 community-dwelling men from the Vietnam Era Twin Study of Aging at average ages 56, 62 and 68, all without ADRD at baseline. The cumulative deficit frailty index (FI) comprised 37 items assessing multiple physiological systems. Plasma biomarkers at age 68 included beta-amyloid (Aβ40, Aβ42), total tau (t-tau) and neurofilament light chain (NfL).
Being frail doubled the risk of all-cause mortality by age 68 (OR = 2.44). Age 56 FI significantly predicted age 68 NfL (P = 0.014), Aβ40 (P = 0.001) and Aβ42 (P = 0.023), but not t-tau. Age 62 FI predicted all biomarkers at age 68: NfL (P = 0.023), Aβ40 (P = 0.002), Aβ42 (P = 0.001) and t-tau (P = 0.001). Age 68 FI scores were associated with age 68 levels of NfL (P = 0.027), Aβ40 (P < 0.001), Aβ42 (P = 0.001) and t-tau (P = 0.003). Genetic influences accounted for 45–48% of the variance in frailty and significantly contributed to its stability across 11 years.
Frailty during one’s 50s doubled the risk of mortality by age 68. A mechanism linking frailty and ADRD may be through its associations with biomarkers related to neurodegeneration. Cumulative deficit frailty increases with age but remains moderately heritable across the age range studied. With environmental factors accounting for about half of its variance, early interventions aimed at reducing frailty may help to reduce risk for ADRD.
Key Points
The cumulative deficit frailty index appears to be a sensitive and reliable indicator even in adults in their mid-50s.
Frailty at midlife predicted risk for higher levels of Alzheimer’s disease-related plasma biomarkers.
Results indicate that frailty comprises a modifiable risk factor that emerges relatively early in the life course.
Guidelines recommending frailty assessments at annual examinations in adults over age 65 may be too conservative.
Background
An estimated 11% of older adults experience frailty, representing considerable individual and societal burden [1, 2]. Frailty connotes weakness and loss of vitality associated with ageing-related physiological decline across multiple systems [3] and is associated with multiple adverse outcomes including disability, hospitalisation, mortality, cognitive impairment and Alzheimer’s disease and related dementias (ADRD) [4–12]. Biologically relevant pathways in frailty are understudied, especially in adults under 65 [13]. Such research would facilitate early identification of pre-morbid mechanisms linking frailty and ADRD [2].
Initially, frailty was conceptualised in terms of physical frailty and cumulative deficit frailty [14]. The unidimensional physical frailty model defined frailty in terms of signs and symptoms of reduced energy and weakness more common in elderly or chronically ill adults [3]. The multidimensional cumulative deficit frailty model defined frailty as reflecting ageing-related accumulation of multiple physical and mental health signs, symptoms, disabilities and diseases [3, 14–20]. Other forms of frailty have been examined (e.g. cognitive, oral, social, biopsychosocial, psychological, organ-specific [11, 21–25]), but examining these is beyond the scope of this manuscript. We focus here on expanding our understanding of persistence of cumulative deficit frailty and mechanisms underlying its association with ADRD.
Twin and family studies have shown that frailty is explained, in part, by significant genetic influences. In adults aged 40–99 years, heritability of cumulative deficit frailty ranged from 0.45 to 0.52 [26, 27]. Heritability of a ‘robustness index ratio’ in twins aged 75 and older was 0.43 [28]. Although some studies examine heritability of frailty in different age cohorts, we are aware of only one longitudinal genetic study [28–30]. Given the potential benefits of early detection of neurodegenerative disease risks, it is important to examine whether genetic and environmental influences on frailty are longitudinally stable versus age-specific [31–34].
In addition to the genetic aetiology of frailty, we also consider predictive validity. For instance, only a small number of studies examine mechanisms linking frailty with pathological ageing or ADRD-related risks. Most studies of frailty and ADRD-related biomarkers in older adults use positron emission tomography, cerebrospinal fluid (CSF) or autopsy data [35–42] and report no significant relationships between physical frailty and beta-amyloid (Aβ40 or Aβ42) [35, 40, 42] or neurofilament light chain (NfL) [35]. To our knowledge, no studies have examined associations between cumulative deficit frailty across midlife and biomarkers in early old age [43, 44].
Here we examined frailty in the Vietnam Era Twin Study of Aging (VETSA), a longitudinal study of middle-aged twins who were dementia-free at baseline. We first examined relationships between cumulative deficit frailty and mortality in order to validate the frailty index (FI) in this relatively young sample. We then explored liability for frailty over time by calculating genetic and environmental influences on frailty in genetically and developmentally informative twin models. Finally, we examined associations between frailty and plasma biomarkers, predicting that higher levels of midlife frailty would be predictive of more pathological levels of total tau (t-tau), Aβ40, Aβ42 and NfL in old age.
Methods
Participants
VETSA randomly recruited 1,291 participants from the Vietnam Era Twin Registry (VETR) [45], a nationally distributed registry of non-patient community-dwelling male–male twin pairs who all served in the US military at some time between 1965 and 1975 [46, 47]. VETSA wave 1 eligibility requirements included being between the ages of 51 and 59 at enrolment, and both members of a twin pair agreeing to participate in the baseline assessment. Details of ascertainment and data collection protocols are described elsewhere [48–50]. Wave 1 data collection occurred from 2003 to 2007, wave 2 from 2009 to 2014, wave 3 from 2016 to 2019 (see Supplementary Appendix 1). VETSA follow-ups included 82% of the original participants plus age-matched attrition replacement participants randomly recruited from the same VETR cohort.
Participants were age 56 years (range 51–61) at wave 1, 62 years (range 56–67) at wave 2 and 68 years (range 61–73) at wave 3 (Table 1). Henceforth, we refer to average age rather than wave. Average lifetime education was 13.88 (SD = 2.1) years. No participants had ADRD at age 56 or 62. The majority (90.8%) were non-Hispanic white. Most did not serve in Southeast Asia (~70%) and did not experience combat (~80%). Participants had comparable health, education and lifestyle characteristics to American men in their age cohort [51]. Ethnicity of the sample reflects the lack of diversity in the US military during the 1960s.
Descriptive characteristics.
| Wave 1 | Wave 2 | Wave 3 | |
|---|---|---|---|
| Years of data collection | 2002–07 | 2009–13 | 2016–19 |
| Participants with Frailty Index (FI) | 1,286 | 1,200 | 1,194 |
| Fraity Index | 0.15 (0.07) | 0.17 (0.08) | 0.19 (0.08) |
| Age (years) | 55.94 (2.43) | 61.72 (2.45) | 67.57 (2.53) |
| Age Range | 51–61 | 56–67 | 61–73 |
| Lifetime education (years) | 13.84 (2.09) | 13.83 (2.09) | 13.93 (2.09) |
| Ethnicity | |||
| White non-Hispanic | 91.68% | 91.08% | 90.54% |
| Other | 8.32% | 8.92% | 9.46% |
| Smoking pack years (if smoker) | 28.71 (23.14) | 30.03 (24.58) | 29.60 (25.69) |
| Smoking status | |||
| Current | 23.41% | 18.49% | 13.11% |
| Former | 45.10% | 47.36% | 51.51% |
| Never | 31.49% | 34.14% | 35.38% |
| Alcohol (drinks/14 days) | 12.30 (21.23) | 12.47 (24.87) | 11.75 (23.45) |
| Alcohol status | |||
| None | 34.27% | 37.86% | 39.46% |
| Light | 51.17% | 48.71% | 48.03% |
| Heavy | 14.56% | 13.43% | 12.51% |
Note. FI is the ratio of number of items divided by total items on scale (37). FI values are reported before any transformations were applied. Table values are presented as mean (SD) or %.
Procedures
Participants travelled to the University of California San Diego or Boston University to complete a day-long assessment. Institutional Review Boards at each university approved the study protocols that were performed in accordance with ethical standards laid down in the 1964 Declaration of Helsinki. Participants provided written informed consent. At all timepoints, assessments involved self-report psychosocial questionnaires, in-person medical history interviews, neuropsychological testing and functional tests. Blood specimens for biomarker assays were obtained at wave 3.
Measures
Cumulative deficit FI
The FI comprised 37 standard items based on previously established standards [52] and other cumulative deficit frailty indices (Supplementary Appendix 2) [17–19, 53]. We recoded each item using previously developed criteria so that 0 indicates no deficit and higher scores indicate that a deficit was present (Supplementary Appendix 3) [17–19]. Individuals with more than seven (20%) missing items were excluded from analysis (ns = 5, 7 and 2 at ages 56, 62 and 68, respectively) [19]. The final FI score was calculated as the ratio of total deficits to total items. For descriptive purposes (see Supplementary Appendix 4), we converted FI ratio scores to categories using previously developed criteria: non-frail (FI ≤ 0.1), pre-frail/vulnerable (0.1 < FI ≤ 0.21), frail (>0.21 ≤ 0.45) and most frail (FI > 0.45) [54]. Mean FI was not significantly different between follow-up participants and attrition replacements at wave 2 [0.19 vs 0.17; t (1,198) = 1.3047, P = 0.192] or wave 3 [0.20 vs 0.19; t (1,192) = 1.0844, P = 0.278].
Plasma biomarkers
Fasting began by 9:00 PM the night before the test day; phlebotomy occurred on the day of testing between 8:00 and 8:30 AM. Technicians aliquoted plasma immediately and placed specimens in −80°C degree freezers. At the end of wave 3 data collection (2019), we conducted biomarker assays for all participants using clinical trial standard operating procedures for sample handling and analysis [55–58]. The Alzheimer's Therapeutic Research Institute Biomarker Core at University of Southern California assayed NfL on a single-plex plate using the ultra-sensitive Simoa technology platform HD-1 (Simoa NFL Advantage Kit; Quanterix Corporation) [55] and t-tau, Aβ40 and Aβ42 with the high-throughput Simoa Human Neurology 3-plex A Quanterix HDX platform. Standard exclusion criteria included hemolysis and a coefficient of variance for plasma concentrations > 0.20, or mean t-tau > 80. We adjusted plasma biomarker values for site and storage time [59].
Other measures and covariates
All-cause mortality was determined by the National Death Index to 31 December 2017; 104 participants died between 2003 and 2017. Race/ethnicity was coded as White non-Hispanic versus other. Education reflected years of lifetime formal education completed. Pack-years equalled the number of cigarette packs smoked per day divided by number of years smoked. Alcohol consumption was total of self-reported number of days drank in past 14 days*number of drinks of wine, beer and/or hard alcohol per day.
Data analysis
Appropriate transformations were applied to normalise distributions. FI scores were cube-root transformed; pack-years were square-root transformed; NfL and t-tau were log-transformed. FI-biomarker analyses z-scored both variables. Fixed effects models were used to predict attrition and mortality. Non-twin analyses included age, race/ethnicity, education, smoking and alcohol consumption as covariates, and controlled for the random effect of family relatedness.
Twin analyses
We used OpenMx2.20.6.1 software [60] in R3.41 and R4.0 [61] to fit multivariate twin models to measure the contribution of genetic and environmental influences [62]. To examine the effects of age in the twin models, we created four age intervals (50–55; 56–60; 61–65; 66–73). In the univariate ‘ACE’ variance component model, total variation in FI in each age group was decomposed into additive genetic (A), common environmental (C) and unique environmental (E) variance components (Supplementary Appendix 5). Since monozygotic (MZ) twin pairs are genetically identical, whereas dizygotic (DZ) pairs share on average half of their genes, the expected MZ and DZ cross-twin covariances for additive genetic effects are fixed to 1.0 and 0.5, respectively. Assuming that C effects are the same across zygosity, MZ and DZ twin pair correlations for C are fixed to 1.0. By definition, E effects also include measurement error and are uncorrelated between twin pairs.
Univariate twin models were extended to multivariate models. We compared the fit of four developmentally meaningful multivariate models (Supplementary Appendix 6). The multivariate ACE ‘correlated factors’ model (a), served as a reference for choosing between the competing models. The autoregression model (b) examines whether time-specific random genetic or environmental effects persist over time and assumes that a trait measured at time t is a function of the same trait measured at a prior timepoint t-1, and of variation reflecting time-specific genetic or environmental influences. The common pathway model (c) predicts that covariance structure between FI in all four age groups is explained by a common liability, which can be decomposed into A, C and E influences. Finally, the independent pathway model (d) predicts that latent genetic and environmental risk factors operate independently to generate covariance between the frailty scores.
Determination of the best-fitting model was based on the optimal balance of complexity and explanatory power using Akaike’s information criterion (AIC) [63]. The significance of the A, C and E parameters was determined using the change in the −2 Log-Likelihood (Δ-2LL) between the competing models and the saturated correlated factors model, and the model with lowest AIC. For each best-fitting multivariate model, model parameters were successively fixed to zero and their significance determined using a likelihood ratio chi-square test.
Results
Descriptive data
FI scores correlated across the three timepoints, with phenotypic correlations ranging from r = 0.68 to 0.76 (all Ps < 0.001). FI scores increased significantly from age 56 to age 68 (t (2,464) = 12.17, P < 0.001). The number of frail participants increased over time (χ2 (1) = 76.39, P < 0.001). Greater FI at age 56 was associated with lower education (B = −0.003; P = 0.01) and more smoking (B = 0.0047; P < 0.001) but not with age, race/ethnicity or alcohol consumption (see Supplementary Appendix 7).
Age 56 FI significantly predicted any-cause attrition [B = 1.62 (0.79), z = 2.04, P = 0.04] and all-cause mortality [B = 4.28 (1.34), z = 3.20, P = 0.001] across 11 years. Compared with non-frail and pre-frail groups (collectively ‘not frail’), the frailty group had double the risk for mortality (OR = 2.44).
General versus age-specific liability of frailty
In multivariate twin analyses the autoregression model was the best-fitting longitudinal model based on the non-significant change in chi-square and lowest AIC (Supplementary Appendix 8). All C influences could be dropped without any significant deterioration in model fit, yielding a best-fitting AE model.
Heritability of FI ranged from 45 to 48% for the four age intervals (Figure 1) indicating a general liability for frailty that did not change substantively with increasing age. Most of the genetic variation in FI scores across time was present at the first age interval (A1, Figure 1). As shown by the high transmission coefficients (β = 0.93) from one time interval to the next, genetic variance at the first age interval was enduring and accounted for large portions of genetic variance at all three later intervals. Inspection of the 95% confidence intervals, however, revealed a small but significant dynamic or time-specific source of genetic variance at ages 61–65 (A3). Most of the environmental variation in FI was also present at the first time interval (E1, Figure 1) and accounted for environmental variance at the three later intervals. There was also a small but significant age-dependent source of environmental variance that emerged at ages 56–60 (E2, Figure 1). High genetic correlations across the four age groups (rg = 0.83–0.96; Supplementary Appendix 9) demonstrate that the same genes were largely influencing FI across time. In contrast, environmental correlations were moderate, ranging from re = 0.51 to 0.63, suggesting that environmental influences were unique to each age interval.
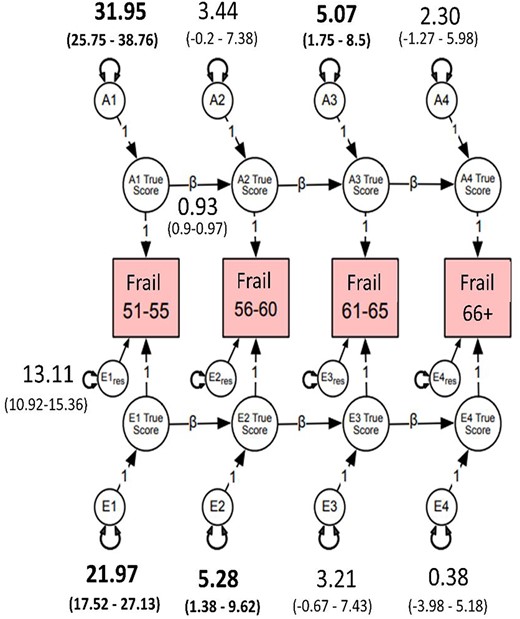
Autoregressive best-fitting model. Frail = cumulative deficit FI, cube-root transformed. A1–A4 estimate the cumulative additive genetic influences at each age group; E1–E4 estimate the cumulative unshared environmental influences at each age group; Ai1 estimates the additive influences at age 51–55, whereas Ai2–Ai4 represent the magnitude of new genetic information at ages 56–60, 61–65 and 66–73; Ei1 estimates the magnitude of unshared environmental influences at age 51–55; Ei2–Ei4 represent unshared environmental influences at ages 56–60, 61–65 and 66–73; res represents residuals or unexplained variance. Estimates on the directional paths between A1 and A4 and E1 and E4 represent βs for autoregressive relationships. Residuals and betas for all age groups were set to be equal without significant loss in model fit (Ps > 0.05). β (e.g. 0.93) for A and E pathways was set to be equal. Bolded numbers indicate statistical significance at 95% CI.
To explore qualitatively the observed genetic stability from age 51 to age 73, we calculated the frequency of frailty items at each age interval (Supplementary Appendix 10). Consistent with the heritability, stability and genetic correlations, the most frequently endorsed items remained consistently represented across age intervals (Table 2). However, frequencies for hypertension and joint pain increased substantially from the 56–60 to the 61–65 age interval. These changes may be related to activation of different genes that predispose individuals to frailty and suggest genetic control of sensitivity to the environment.
Most frequently endorsed cumulative FI items in each age interval.
 |
|
Most frequently endorsed cumulative FI items in each age interval.
|
|
FI and plasma biomarkers
Age 56 FI predicted age 68 Aβ40 (β = 0.13, P = 0.001, 95%CI 0.06, 0.21), Aβ42 (β = 0.09, P = 0.023, 95%CI 0.01, 0.16) and NfL (β = 0.09, P = 0.014, 95%CI 0.02, 0.09), but not t-tau (Table 3; Figure 2). Age 62 FI predicted all age 68 biomarkers: Aβ40 (β = 0.11, P = 0.002, 95%CI 0.04, 0.18), Aβ42 (β = 0.12, P = 0.001, 95%CI 0.05, 0.19), t-tau (β = 0.12, P = 0.001, 95%CI 0.05, 0.19), NfL (β = 0.08, P = 0.023, 95%CI 0.01, 0.15) (Table 3; Supplementary Appendix 11). Age 68 FI scores were associated with age 68 levels of Aβ40 (β = 0.12, P < 0.001, 95%CI 0.06, 0.18), Aβ42 (β = 0.11, P = 0.001, 95%CI 0.04, 0.17), t-tau (β = 0.10, P = 0.003, 95%CI 0.03, 0.16), NfL (β = 0.07, P = 0.027, 95%CI 0.01, 0.13). Higher FI scores were associated with higher biomarker levels. Associations between FI and the Aβ42/Aβ40 ratio were not significant. We re-ran these biomarker analyses including only participants who participated at all three waves (N = 814). Results were consistent with the above results (Supplementary Appendix 12).
Associations between cumulative deficit FI at each wave and age 68 plasma biomarkers.
| Parameter estimate | 95% CI | SE | df | t-value | P-value | |
|---|---|---|---|---|---|---|
| (a) FI wave 1 (age 56) with wave 3 plasma biomarkers (age 68) | ||||||
| NfL | 0.09 | [0.02, 0.17] | 0.04 | 317 | 2.48 | 0.014 |
| t-tau | 0.06 | [−0.02, 0.14] | 0.04 | 265 | 1.56 | 0.121 |
| Aβ40 | 0.13 | [0.06, 0.21] | 0.04 | 299 | 3.47 | 0.001 |
| Aβ42 | 0.09 | [0.01, 0.16] | 0.04 | 295 | 2.28 | 0.023 |
| Aβ42/40 ratio | 0.02 | [−0.04, 0.09] | 0.03 | 295 | 0.68 | 0.498 |
| (b) FI wave 2 (age 62) with wave 3 plasma biomarkers (age 68) | ||||||
| NfL | 0.08 | [0.01, 0.15] | 0.03 | 341 | 2.29 | 0.023 |
| t-tau | 0.12 | [0.05, 0.19] | 0.04 | 289 | 3.32 | 0.001 |
| Aβ40 | 0.11 | [0.04, 0.18] | 0.04 | 322 | 3.12 | 0.002 |
| Aβ42 | 0.12 | [0.05, 0.19] | 0.04 | 319 | 3.37 | 0.001 |
| Aβ42/40 ratio | 0.04 | [−0.02, 0.11] | 0.03 | 319 | 1.36 | 0.174 |
| (c) FI wave 3 (age 68) with wave 3 plasma biomarkers (age 68) | ||||||
| NfL | 0.07 | [0.01, 0.13] | 0.03 | 422 | 2.22 | 0.027 |
| t-tau | 0.10 | [0.03, 0.16] | 0.03 | 351 | 2.97 | 0.003 |
| Aβ40 | 0.12 | [0.06, 0.18] | 0.03 | 394 | 3.93 | 0.000 |
| Aβ42 | 0.11 | [0.04, 0.17] | 0.03 | 389 | 3.36 | 0.001 |
| Aβ42/40 ratio | 0.00 | [−0.06, 0.06] | 0.03 | 389 | −0.05 | 0.963 |
Note. Shown are standardised parameter estimates. FI = Frailty Index. FI was cube-root transformed. Values for NfL and t-tau were log-transformed first to address skewness. Biomarkers were then residualized for site and storage time. Finally, FI and plasma biomarker measures were z-scored. Plasma biomarkers: NfL = neurofilament light; t-tau = total tau; Aβ = beta amyloid. Models adjusted for fixed effects of age, White non-Hispanic versus other (race/ethnicity) and education, but used family as a random effect. Biomarker Ns range from (a) n = 725–791 and (b) n = 784–852 to (c) n = 960–1,048.
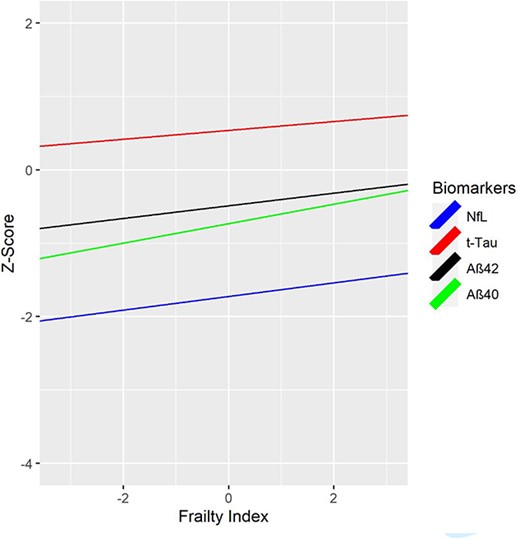
Cumulative deficit FI at age 56 and AD-related plasma biomarkers at age 68. FI = Frailty Index. FI was cube-root transformed; NfL and t-tau were log-transformed. Values for NfL and t-tau were log-transformed first to address skewness. Biomarkers were then residualized for site and storage time. Finally, both FI and plasma biomarker measures were z-scored. NfL = Neurofilament light chain; t-tau = total tau; Aβ40 = beta amyloid 40; Aβ42 = beta amyloid 42. Biomarker measures are z-scored for comparability; descriptive statistics for biomarker measures provided in Supplementary Appendix 16 and boxplots are shown in Supplementary Appendix 17. Higher FI scores are associated with higher biomarker levels. FI scores at age 56 significantly predicted age 68 plasma NfL (P = 0.014), Aβ40 (P = 0.001) and Aβ42 (P = 0.023), but not t-tau.
We conducted sensitivity analyses excluding participants with stroke at wave 1 or wave 2 (see Supplementary Appendix 13). Biomarker results predicting from wave 1 frailty to wave 3 biomarkers remained consistent after excluding participants with stroke at wave 1 (n = 11–12). For wave 2 frailty predicting wave 3 biomarkers, NfL was no longer significant (P = 0.0762) once participants with stroke by wave 2 (n = 27–29) were excluded (Supplementary Appendix 14). When all participants with stroke or ADRD at any time point were excluded (n = 64–70), associations between FI and NfL were no longer significant (Supplementary Appendix 15).
Discussion
In this community-dwelling sample of men without ADRD at baseline (99% of whom were in their 50s at baseline), cumulative deficit frailty doubled the risk of mortality by age 68. Nearly one-half of the variance in frailty was accounted for by genetic influences that were mostly stable with increasing age. Greater cumulative deficit frailty at average age 56 predicted higher levels of ADRD-related plasma biomarkers Aβ42 and t-tau (but not the Aβ42/Aβ40 ratio), and more pathological levels of Aβ40 and NfL by average age 68. These associations of frailty with mortality as well with multiple plasma biomarkers suggest that frailty at midlife is related to advanced ageing and possibly to increased risk for ADRD.
Whilst lower CSF Aβ42 is generally associated with higher brain amyloid deposition [64], in four independent samples as tau increased CSF Aβ increased and then later decreased, presumably reflecting early increases in production and later sequestration in amyloid plaques [65, 66]. In three studies, adults aged 45–70 showed a positive CSF Aβ-tau association, whereas adults aged 71–90 showed a negative association [60]. Based on their age, VETSA participants may still be within this first, positive association phase. The Aβ42/Aβ40 ratio was not significant, but this has not been consistently observed in CSF or plasma in younger adults [40, 67, 68]. Given the aforementioned inverted-U pattern, it may be that frailty will predict lower Aβ42 and a lower Aβ42/Aβ40 ratio at later ages. Identification of frailty in midlife may be important for understanding ageing processes prior to old age and for developing early interventions to reduce frailty that could possibly delay onset of dementia [69–71]. The results predicting mortality and attrition by age 68 also highlight the issue of selection bias and selective survival in studies that begin in old age, especially if exclusion criteria are based on health indices and may also account for mixed results in prior studies of frailty and biomarkers since those studies were all in older adults.
We also capitalised on our genetically informative twin sample. Heritability of frailty ranging from 0.45 to 0.48 suggests a general liability to become frail, representing a measure of biological age involving dysregulation of multiple interacting physiological systems [2]. Notably, frailty was longitudinally stable; this is consistent with the one previous study [27] with a broader age range. Small but significant new genetic influences emerged in the age 61–65 interval, consistent with one study showing significant change in frailty trajectories around age 65 [72]. The emergence of quantitatively distinct genetic and environmental risks appeared to coincide with the emergence of hypertension and joint pain.
Limitations
When our plasma biomarkers were assayed, plasma p-tau 181 or 217 was not obtained, which may provide better indicators of brain amyloid related to ADRD [73–75]. Our study comprised approximately 90% non-Hispanic White men. Future studies should evaluate women and diverse racial/ethnic groups. Mortality data from the National Death Index were only available to the end of 2017, thus, our mortality findings may provide conservative estimates. The FI comprised 20 diseases, 11 symptoms/signs, one laboratory abnormality and five functional impairments, a distribution consistent with other cumulative deficit frailty measures. Although this is imbalanced it does meet most criteria established by Searle et al. [52]. However, if the imbalance between symptoms, signs, diseases, functional impairments and laboratory abnormalities across time was significant or indicative of heterogenous syndromes, this would be inconsistent with our best-fitting multivariate twin model with the large beta causal coefficients (β = 0.93) between age intervals. Finally, we were unable to calculate the Fried physical FI. Therefore, we are unable to ascertain if our results are generalizable to physical frailty.
Conclusion
Cumulative deficit frailty—even in adults in their mid-50s—appears to be a sensitive and reliable indicator of multiple adverse outcomes in these community dwelling adults. Frailty at midlife predicted mortality by age 68, attrition and a tendency towards more pathological levels of plasma biomarkers across 11 years—signalling more advanced biological ageing. Taken together, the results indicate that frailty is a modifiable risk factor with potential ties to risk for ADRD and emerges relatively early in the life course. Guidelines recommending frailty assessments at annual examinations in adults over age 65 thus may be too conservative [1]. Greater attention needs to be paid to early interventions to reduce or prevent frailty well before old age [1, 2, 44].
Acknowledgements
The US Department of Veterans Affairs, Department of Defence; National Personnel Records Center, National Archives and Records Administration; National Opinion Research Center; National Research Council, National Academy of Sciences; and the Institute for Survey Research, Temple University provided invaluable assistance in the creation of the VETR. The Cooperative Studies Program of the US Department of Veterans Affairs provided financial support for development and maintenance of the VETR. We would also like to acknowledge the continued cooperation and participation of the members of the VETR and their families. Investigators within the Vietnam Era Twin Study of Aging (VETSA) contributed to the design and implementation of VETSA and/or data collection but did not participate in analysis or writing of this report.
Declaration of Conflicts of Interest
None.
Declaration of Sources of Funding
The content is the sole responsibility of the authors and does not necessarily represent official views of the National Institute on Aging, National Institutes of Health or the Veteran’s Administration. This work was supported by grants from the National Institute on Aging at the National Institutes of Health: R01 AG050595, ROI AG022381, ROI AG076838, ROI AG037985, ROI AG064955 and P01 AG055367.
Data availability
The data supporting the findings of this study are available on request from the corresponding author. Data are not downloadable from a public website because of privacy or ethical restrictions established by the Vietnam Era Twin Registry (VETR) at the Seattle, VA. VETSA data are available through a data request form available on the VETSA website: https://psychiatry.ucsd.edu/research/programs-centers/vetsa/index.html. Data request for VET Registry and VETSA data can also be made at the VETR; the access process is described at: https://www.seattle.eric.research.va.gov/VETR/Investigator_Access.asp.
References
Author notes
Erik Buchholz, Nathan A. Gillespie, William S. Kremen and Carol E. Franz contributed equally to manuscript.

Comments