


Abstract
the electronic frailty index (eFI) has been developed and validated using routine primary care electronic health record data. The focus of the original big data study was on predictive validity as a form of criterion validation. Convergent validity is a subtype of construct validity and considered a core component of the validity of a test.
to investigate convergent validity between the eFI and research standard frailty measures.
cross-sectional validation study using data from the Community Ageing Research 75+ (CARE 75+) cohort.
multi-site UK community-based cohort study.
three hundred fifty-three community-dwelling older people (median age 80 years, IQR 77–84), excluding care home residents and people in the terminal stage of life. Median eFI score of participants was 0.22 (IQR 0.14–0.31).
convergent validities between the eFI and: a research standard frailty index (FI); the phenotype model of frailty; Clinical Frailty Scale (CFS) and Edmonton Frail Scale were assessed using scatter plots and Spearman’s rank tests to estimate correlation coefficients (Spearman’s rho, ρ) and 95% confidence intervals.
results indicate strong correlation between the eFI and both the research standard FI (ρ = 0.68, 95% CI 0.62–0.74) and Edmonton Frail Scale (ρ = 0.63, 95% CI 0.57–0.69). There was evidence for moderate correlation between the eFI and both the CFS (ρ = 0.59, 95% CI 0.49–0.65) and phenotype model (ρ = 0.51, 95% CI 0.42–0.59).
This study provides evidence for convergent validity of the eFI, a core component of test validity.
Background
Frailty is a condition characterised by loss of biological reserves, failure of homeostatic mechanisms and vulnerability to adverse outcomes [1]. The UK and international consensus guidance recommends routine identification of frailty to enable provision of evidence-based interventions and a more holistic approach to care [2, 3].
To support routine frailty identification, an electronic frailty index (eFI) based on existing primary care electronic health record data has been made freely available to every general practice in the UK, supported by national guidelines [4, 5]. The widespread availability of the eFI in the UK has enabled the introduction of routine identification and management of frailty in NHS primary care as a key component of the 2017–18 general medical services (GMS) contract [6].
The focus of the original eFI study was on predictive validity as a form of criterion validation. Convergent validity is the demonstration of substantial and significant correlation between different instruments designed to assess a common construct [7]. It is a subtype of construct validity and considered a core component of the validity of a test [7]. However, investigation of convergent validity was not feasible as part of the original eFI validation, which used large datasets based on routinely available primary care electronic health record data.
Objective
To investigate convergent validity between the eFI and research standard frailty measures.
Methods
Design
Cross-sectional validation study using data from the Community Ageing Research 75+ (CARE 75+) cohort study.
Setting
CARE 75+ is a multi-site, prospective, community-based cohort study recruiting older people aged 75 years and over living in the UK, funded as part of the National Institute for Health Research Collaboration for Leadership in Applied Health Research and Care, Yorkshire & Humber (NIHR CLAHRC YH). CARE 75+ recruiting sites are Bradford, Leeds, Hull, Scarborough, Newcastle, Durham, Doncaster, Oswestry, Stafford, Wolverhampton, Exeter and Plymouth, spanning a range of urban and rural localities. Care home residents and people in the terminal stage of life are ineligible for the study.
Participants
Participants are recruited via general practices and undergo face-to-face assessments at baseline, 6, 12, 24 and 48 months. A wide range of health and sociodemographic data is collected at each of the assessment timepoints, including information on frailty, cognition, mood, activities of daily living, health-related quality of life, resilience, loneliness and pain. Consultee assent is obtained for participants who lack capacity, enabling inclusion of older people with coexisting frailty and cognitive impairment.
Measurements
We assessed convergent validity between the eFI and a range of research standard frailty measures.
The eFI is based on the cumulative deficit model of frailty, and includes 36 deficit variables (clinical signs, symptoms, diseases, disabilities, impairments) which are obtained from the primary care EHR. The eFI score is calculated as an equally weighted proportion of the number of deficits present in an individual relative to the total possible [4].
The research frailty measures were:
A research standard 60 item FI, based on a cumulative deficit model previously validated as part of the English Longitudinal Study of Ageing [8], enabling calculation of a FI score.
The phenotype model of frailty, based on the five physical characteristics as reported in the original Cardiovascular Health Study (weight loss, exhaustion, low energy expenditure, slow walking speed, weak grip strength) [9]. Those with no characteristics are identified as fit, one or two characteristics as pre-frail and three to five characteristics as frail.
The seven category Clinical Frailty Scale (CFS), which is a validated measure of frailty based on clinical descriptors and pictographs [10]. The CFS is an ordinal measure, with scores ranging from one (fit) to seven (severe frailty).
The Edmonton Frail Scale (EFS), as a validated frailty measure that records information on nine frailty domains (cognition, general health, functional independence, social support, medication use, nutrition, mood, continence, functional performance) [11]. The EFS is scored out of a total of 17, with higher scores indicating increasing frailty.
Trained researchers recorded the research measures during face-to-face assessments in a participant’s own home. Contemporaneous eFI scores were extracted separately and directly from the primary care electronic health record, ensuring that the face-to-face assessments were not influenced by prior knowledge of eFI scores.
Analysis
Anonymised cross-sectional data from CARE 75+ participant baseline assessments were analysed, including investigation of missing data, and cohort descriptive statistics generated. Convergent validity between the eFI and the research frailty measures at the baseline assessment was assessed using scatter plots and Spearman’s rank tests to estimate correlation coefficients (Spearman’s rho, ρ). Ordinal measures were treated as continuous for the analysis. 95% confidence intervals (CIs) were estimated by bootstrapping, using 1,000 bootstrap iterations. Correlation coefficients were interpreted as: 0–0.19 = very weak; 0.20–0.39 = weak; 0.40–0.59 = moderate; 0.60–0.79 = strong; 0.80–1.0 = very strong [12]. We used SPSS version 21 for all analyses [13].
Results
Participant characteristics
CARE 75+ cohort baseline characteristics from 353 participants are presented in Table 1.
CARE 75+ cohort participant characteristics
| Participant characteristics | |
|---|---|
| Number of participants | 353 |
| Age, median (IQR) | 80 (77–84) |
| Gender | |
| Female | 53% |
| Male | 47% |
| Ethnicity | |
| White | 85% |
| South Asian | 14% |
| Other | 1% |
| Marital status | |
| Married | 46% |
| Widowed | 43% |
| Single | 7% |
| Gait speed (m/s), median (IQR) | 0.6 (0.3–0.8) |
| Self-reported limitation | |
| Climbing one flight stairs | 43% |
| Bathing and dressing | 22% |
| eFI score, median (IQR) | 0.22 (0.14–0.31) |
| Phenotype model | |
| Fit | 7% |
| Pre-frail | 57% |
| Frail | 36% |
| Edmonton frail scale | |
| Not frail | 72% |
| Vulnerable | 18% |
| Mild frailty | 6% |
| Moderate frailty | 3% |
| Severe frailty | 1% |
| Clinical frailty scale | |
| Very fit | 18% |
| Well | 25% |
| Well, with treated comorbid disease | 25% |
| 14% | |
| Apparently vulnerable | 11% |
| Mildly frail | 6% |
| Moderately frail | 1% |
| Severely frail | 0% |
| FI score, median (IQR) | 0.18 (0.13–0.30) |
| Missing data, n (%) | |
| Phenotype model | 9 (2%) |
| Edmonton frail scale | 22 (6%) |
| Clinical frailty scale | 7 (2%) |
| FI | 8 (2%) |
| eFI | 0 (0%) |
Key: IQR, interquartile range; eFI, electronic Frailty Index; FI, frailty index.
Convergent validity of the eFI
Scatter plots showing the relationship between the eFI and research standard frailty measures are presented in Figure 1.
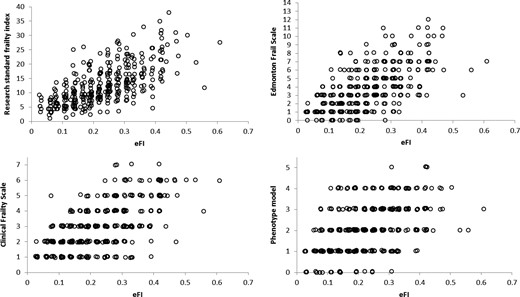
Scatter plots of the relationship between the electronic Frailty Index (eFI) and research standard frailty measures.
Results indicate a strong correlation between the eFI and both the research standard FI (ρ = 0.68, 95% CI 0.62–0.74) and EFS (ρ = 0.63, 95% CI 0.57–0.69). There was evidence of a moderate correlation between the eFI and both the CFS (ρ = 0.59, 95% CI 0.49–0.65) and phenotype model (ρ = 0.51, 95% CI 0.42–0.59).
Discussion
The study provides supportive evidence for the convergent validity of the eFI as a core component of test validity, with evidence of moderate to strong correlation between the eFI and a range of research standard frailty measures.
Although there was evidence of strong correlation between the eFI and the research standard FI, it might have been anticipated that correlation would be higher, as the two measures are based on the same underpinning theoretical framework. Comparison of the domains included in the two measures indicates that the research standard FI contains a greater number of functional deficits, based primarily around activities of daily living. Although the eFI also contains information on function, this in limited to a relatively small number of variables. Furthermore, as the eFI is based on routinely available primary care electronic health record data it is likely that these deficits will not be recorded as reliably in primary care as might be expected in an epidemiological study.
Functional impairment is a core component of frailty, whichever model is applied, and appears to be a key element of predictive validity in frailty models [14]. Although the cumulative deficit model typically assigns equal weights to the deficit variables, it is possible that weighting of the functional deficits contained within the eFI may increase the correlation between the two measures and further improve predictive validity, and is an area of ongoing investigation.
Correlation between the eFI and phenotype model was lower than for the other measures. Although based on different theoretical frameworks, previous studies have reported higher correlation estimates between a research standard cumulative deficit FI and phenotype model (ρ = 0.65) [15]. The lower estimates obtained in our study may also be a reflection of the lower relative weight given to functional measures in the eFI, and might be an area of future research to improve the validity and performance of the eFI.
Strengths of the study
The study used data from a community-based cohort of older people recruited from a range of urban and rural areas in the UK. Research standard frailty measures were completed without prior knowledge of eFI scores, reducing risk for potential bias in research assessments. eFI scores were extracted from primary care EHR systems using standardised protocols, ensuring consistency across sites.
The CARE 75+ cohort was designed to include a number of frailty measures, enabling detailed assessment of convergent validity by assessing correlation between the eFI and a range of validated frailty instruments. The demonstration of moderate to strong correlation between the eFI and a range of frailty measures adds weight to the evidence for convergent validity.
Limitations of the study
The CARE 75+ study does not include care home residents, so it is not possible to extrapolate results to this especially frail population. As the care home population is characteristically heavily dependent for activities of daily living it is possible that the correlation between the eFI and research standard frailty measures may be lower in this population, and requires further investigation.
The eFI is widely available in the UK, but frailty measures based on routinely available EHR data are not yet widely available internationally. Interest in the development of frailty measures based on routinely available data is growing, but the way in which EHR data is recorded in different international systems may differ from the UK. Evidence for convergent validity for novel international frailty measures based on EHR data cannot be extrapolated from this study and should instead be viewed as a key component of validation.
Conclusions
We have identified evidence for moderate to strong correlations between the eFI and a range of research standard frailty measures. This evidence is supportive of the convergent validity of the eFI as a core component of instrument validation. The lower proportion of functional deficits contained within the eFI may help explain lower correlation estimates than previously reported and future research to refine the eFI by focusing on functional impairment as a core component of frailty may help further increase convergent validity and performance.
convergent validity is considered a core component of the validity of a test.
we investigated convergent validity between the eFI and a range of research standard frailty measures.
there was a strong correlation between the eFI, a research standard FI and the Edmonton Frail Scale.
there was a moderate correlation between the eFI, the phenotype model and the CFS.
results indicate evidence for convergent validity of the eFI.
Acknowledgements
We are grateful to the National Institute for Health Research Clinical Research Networks (NIHR CRNs) in North East & North Cumbria; South West Peninsula; West Midlands; and Yorkshire & Humber for their support in recruiting participants to the CARE 75+ study.
Funding
The research was funded by the National Institute for Health Research Collaboration for Leadership in Applied Health Research and Care, Yorkshire and Humber (NIHR CLAHRC YH) www.clahrc-yh.nihr.ac.uk (IS-CLA-0113-10020). The views expressed are those of the author(s), and not necessarily those of the NHS, the NIHR or the Department of Health and Social Care.
Ethical approval
The Bradford and Leeds Research Ethics Committee granted ethical approval for the CARE 75+ study (ref: 14/YH/1120). The CARE 75+ study is registered at ISRCTN16588124.
Conflict of interest
None.

Comments