


Abstract
Astragalus polysaccharide (APS) is the major natural active component of Astragalus membranaceus, which has been recognized as one of the most popular herbal medicines worldwide. Enhancing the formation and function of brown adipose tissue increases energy expenditure and hence may potentially be used against obesity and type 2 diabetes. The aim of the present study was to explore the effect and mechanism of APS on brown adipocyte formation. Mouse C3H10T 1/2 cells were subject to APS, and both proliferation and brown adipogenic differentiation were determined. The results showed that APS exhibits a decreased proliferation ability, which is accompanied by downregulated proliferating cell nuclear antigen, cyclin D1, and cyclin-dependent kinase 4. APS promotes the differentiation of C3H10T 1/2 cells into brown adipocytes and induces the expressions of key brown adipogenic transcriptional factors, including CCAAT/enhancer-binding protein β, uncoupling protein 1, and PR domain-containing 16. Importantly, APS enables insulin sensitization in brown adipocytes, which may proceed through activation of the canonical phosphatidylinositol-3-kinase (PI3K)/protein kinase B (AKT) signaling pathway and AMP-activated protein kinase (AMPK). Furthermore, the level of cut-like homeobox 1 (CUX1) is positively related to brown adipogenic differentiation, while APS regulates Cux1 expression through interaction with miR-1258-5p. Notably, the promotional effect of APS on brown adipogenic differentiation was abolished by Cux1 knockout. Collectively, our results suggest that APS enhances the differentiation of C3H10T 1/2 cells into brown adipocytes through regulating Cux1 via miR-1258-5p.
Introduction
The worldwide epidemic of obesity has led to a dramatic increase in the incidence of type 2 diabetes. Brown adipose tissue (BAT) has been recognized as a major site of non-shivering thermogenesis, which is attributed to the uniquely presented uncoupling protein 1 (UCP1) in the mitochondria [1]. Notably, both obesity and type 2 diabetes are closely related to impaired BAT functions [2]. Previous studies demonstrated that the BAT activity is reduced in men who are overweight or obese [3], whereas activating BAT improves whole body insulin sensitivity and glucose homeostasis [4]. Hence, augmenting BAT mass or activation of BAT function could potentially be used against obesity and type 2 diabetes.
Cut-like homeobox 1 (CUX1) belongs to the homeodomain transcription factor family and is functionally and evolutionarily conserved from Drosophila to humans [5]. Physiologically, CUX1 has been implicated in various biological processes, including embryonic development and cell proliferation, differentiation, and migration in many tissues and organs [6]. Most recent studies on CUX1 have been focusing on its regulatory effect during tumor development, although whether it functions as a tumor suppressor or an oncogene remains controversial [7]. For example, Li et al. [8] proved that Cux1 can generate circ-CUX1 to promote neuroblastoma progression, while Cux1 knockout leads to the activation of PI3K–AKT–mammalian target of rapamycin (mTOR) signaling pathway [9]. However, whether CUX1 plays a regulatory role in brown adipogenesis remains undefined.
Astragalus membranaceus has been recognized as one of the most popular herbal medicines worldwide [10], and Astragalus polysaccharide (APS) is the major natural active component. Till now, the pharmacological effects of APS have been thoroughly explored, including immunomodulatory, anti-inflammatory, antioxidation, antitumor, antihypertensive effects, etc. [11]. A recent study reported that formononetin which was extracted from A. membranaceus effectively increased Ucp1 expression in mouse primary adipocytes [12]. It is well-established that microRNAs (miRNAs) play vital roles in regulating differentiation and function of BAT [13]. Notably, previous studies have shown that APS exerts regulatory effects by regulating miRNA expression [10,14]; moreover, APS attenuates insulin resistance in rats with type 2 diabetes mellitus via regulation of miR-203a-3p [15] and improves insulin sensitivity through AMP-activated protein kinase (AMPK) activation in 3T3-L1 adipocytes [16]. However, whether APS regulates brown adipogenesis and thermogenesis remains unclear.
Considering that BAT is an effective target for treatment of obesity-associated disorders, if APS affects BAT mass and activity, it may provide a potential therapeutic approach for obesity and related metabolic diseases. Therefore, we aimed to investigate the role and potential mechanisms of APS on brown adipogenesis. We found that APS enhances brown adipogensis of C3H10T 1/2 cells through miR-1258-5p-regulated Cux1.
Materials and Methods
Cell culture and brown adipogenic differentiation
Mouse C3H10T 1/2 mesenchymal stem cells were purchased from American Type Culture Collection (ATCC, Manassas, USA). Cells were cultured in Dulbecco’s modified Eagle’s medium (Hyclone, Logan, USA) supplemented with 10% fetal bovine serum (Gibco, Gaithersburg, USA) and 1% penicillin–streptomycin at 37°C with 5% CO2. Brown adipogenic differentiation induction was performed using the protocol established in our lab [17]. Briefly, C3H10T 1/2 cells were induced at 100% confluence by addition of brown adipogenic medium containing 0.5 mM isobutyl-1-methylxanthine (Sigma, St Louis, USA), 1 µM dexamethasone (Sigma), 1 nM triiodothyronine (T3; Sigma), 125 nM indomethacin (Sigma), and 1 mg/ml insulin (Sigma). After 48 h, cells were switched to medium containing 1 nM T3 and 1 mg/ml insulin, and the medium was refreshed every 2 days until day 6.
Antibodies, chemicals, and plasmid
The antibodies against proliferating cell nuclear antigen (PCNA; bs-0754R), cyclin-dependent kinase 4 (CDK4; bs-0633R), β-actin (bs-0061R), UCP1 (bs-1925R), peroxisome proliferator-activated receptor γ (PPARγ; bs-0530R), CCAAT/enhancer-binding protein β (C/EBPβ; bs-1396R), peroxisome proliferator-activated receptor γ coactivator 1α (PGC1α; bs-1832R), insulin receptor substrate 1 (IRS1; bs-0172R), phosphorylated IRS1 (p-IRS1; bs-2736R), and AMPKα1 (AMPKα1; bs-10344R) were purchased from Biosynthesis Biotechnology (Beijing, China). p-AMPKα (2535), Akt (9272), p-Akt (2146), glucose transporter 4 (GLUT4; 2213) and anti-rabbit fluorescent secondary antibody (4412) were purchased from Cell Signaling Technology (Danvers, USA). The anti-PR-domain containing 16 (PRDM16; PA5-20872) was from Thermo Fisher Scientific (Waltham, USA). The anti-CUX1 (11733-1-AP) was purchased from Sanying Biotechnology (Wuhan, China). The goat anti-mouse secondary antibody (926-68070) and anti-rabbit secondary antibody (926-32211) were from LICOR Biosciences (Lincoln, USA). Unless otherwise indicated, all chemicals were purchased from Sigma. APS (98% purity) was purchased from YuanYe Biotechnology (Shanghai, China). The pXJ42-p200 Cux1 (100813) and pCux1.1.0-gDNA (112434) were purchased from Addgene (Cambridge, USA). The miR-1258-5p mimics (sense 5′-UGCUGAGCUAAUUCCCUAACUG-3′ and antisense 5′-GUUAGGGAAUUAGCUCAGCAUU-3′), negative control (NC; sense 5′-UUCUCCGAACGUGUCACGUTT-3′ and antisense 5′-ACGUGACACGUUCGGAGAATT-3′), miR-1258-5p inhibitor (5′-CAGUUAGGGAAUUAGCUCAGCA-3′), and miR-1258-5p inhibitor NC (5′-CAGUACUUUUGUGUAGUACAA-3′) were purchased from Jima Pharmaceutical Technology (Shanghai, China).
Protein preparation and western blot analysis
Mouse C3H10T 1/2 cells grown in 12-well plates were harvested and lysed in 100 μl of ice-cold lysis buffer (Beyotime Biotechnology, China). Then, the lysates were centrifuged for 15 min at 12,000 g and 4°C, and a total of 30 μg of soluble proteins were subject to 10% sodium dodecyl sulfate-polyacrylamide gel electrophoresis for protein separation (80 V for 30 min, followed by 120V for 90 min). The separated proteins were transferred to nitrocellulose membranes (4°C, 100 V for 2 h) and blocked with 5% skim milk powder (Sangon Biotech, Shanghai, China). Subsequently, the nitrocellulose membranes were incubated with primary antibodies (1:1000, 4°C, overnight), followed by incubation with secondary antibody (1:20,000, room temperature, 1 h). The immunoblotting bands were scanned and analyzed using the Odyssey Infrared ImaANOging System (LI-COR Biosciences, Lincoln, USA). Band density was normalized to the β-actin content.
RNA preparation, library construction, and high-throughput sequencing
Total RNA was extracted using TRIzol reagent (Sigma) according to the supplier’s protocol. The concentration and integrity of isolated RNA were evaluated using NanoDrop 2000 instrument (Nanodrop Instruments, Delaware, USA). The miRNA-seq libraries were prepared using NEB Ultra RNA Library Prep Kit for Illumina (7530; New England Bio-Labs, Beverly, USA) according to the manufacturer’s protocol, and the generated library fragments were sequenced on an Illumina HiSeq 4000 platform (Gene Denovo, Guangzhou, China).
Bioinformatics analysis
The original data were transformed into raw reads by base calling. After filtering, reads were compared against ribosomal RNAs, transfer RNAs, small cytoplasmic RNAs, small nuclear RNAs (snRNAs), and small nucleolar RNAs (snoRNAs) deposited in the GenBank (http://www.ncbi.nlm.nih.gov) and the Rfam database (http://rfam.xfam.org) using blastall software (http://www.kegg.jp/) to annotate the small RNA sequences. Then, the clean reads were mapped to the mouse genome using bowtie software (http://bowtie-bio.sourceforge.net/index.shtml) to analyze their expression and distribution on the genome. Differentially expressed miRNAs was screened by |log2 Fold change|>1, P<0.05 and the target genes were predicted by RNAhybrid (v2.1.2)+svm light (http://bibiserv.techfak.uni-bielefeld.de/rnahybrid/), Miranda (http://www.microrna.org/microrna/home.do), and TargetScan software (http://www.targetscan.org).
Real-time quantitative reverse transcription PCR
Total RNA was extracted using the TRIzol reagent. For miRNA quantification, first-strand complementary DNAs (cDNAs) were synthesized using M5 miRNA cDNA Synthesis Kit (Juhemei Biotech, Beijing, China), and amplifications were performed with following steps: 95°C for 10 min; 40 cycles: 95°C for 15 s, 60°C for 1 min, 60°C for 1 min by using M5 miRNA qPCR Assay Kit (Juhemei Biotech). The forward primer for miR-1258-5p was 5ʹ-GGCGCGTGCTGAGCTAATTCA-3ʹ. The primer sequences for U6 were 5ʹ-GGAACGATACAGAGAAGATTAGC-3ʹ (forward) and 5ʹ-TGGAACGCTTCACGAATTTGC-3ʹ (reverse). For mRNA expression analysis, cDNAs were synthesized using a reverse transcription kit (Takara, Dalian, China), and qPCR was performed with following steps: 95°C for 20 s; 40 cyles: 95°C for 20 s, 60°C for 30 s, 60°C for 20 s by using the CFX qRT-PCR detection system (Bio-Rad, Hercules, USA) and a SYBR Green qRT-PCR kit (Takara) according to the manufacturer’s instructions. Relative mRNA content was normalized to either U6 or 18S rRNA content, and the 2−ΔΔCt method was used to determine relative changes in gene expression. The primer sequences are shown in Table 1.
Sequences of primers used in this study
| Name | Sequence (5′→3′) | Accession No. |
| PCNA | F: GAACCTCACCAGCATGTCCA | NM_011045.2 |
| R: TGGGATTCCAAGTTGCTCCA | ||
| cyclin D1 | F: AAAATGCCAGAGGCGGATGA | S78355.1 |
| R: CAGGGCCTTGACCGGG | ||
| Ki67 | F: ACCATCATTGACCGCTCCTT | NM_001081117.2 |
| R: TTGACCTTCCCCATCAGGGT | ||
| Ucp1 | F: ACTGCCACACCTCCAGTCATT | NM_009463.3 |
| R: CTTTGCCTCACTCAGGATTGG | ||
| Prdm16 | F: CAGCACGGTGAAGCCATTC | NM_001291029.1 |
| R: GCGTGCATCCGCTTGTG | ||
| PGC1α | F: CCCTGCCATTGTTAAGACC | NM_008904.2 |
| R: TGCTGCTGTTCCTGTTTTC | ||
| Cidea | F: TGCTCTTCTGTATCGCCCAGT | NM_007702.2 |
| R: GCCGTGTTAAGGAATCTGCTG | ||
| Elvol 3 | F: CGTAGTCAGATTCTGGACCT | XM_006526624.1 |
| R: CCAGAAGAAGTGTTCCGTTG | ||
| Cox7a | F: CAGCGTCATGGTCAGTCTGT | NM_009944.3 |
| R: AGCCCCCCGTGTGGCAGAGA | ||
| Cux1 | F: AGATGTGGCCATAGAGGTGCT | NM_001291233.1 |
| R: GGAGTCGCTGCACATCTTCC | ||
| 18S RNA | F: GTAACCCGTTGAACCCCATT | M35283.1 |
| R: CCATCCAATCGGTAGTAGCG |
Immunocytochemical staining
Mouse C3H10T 1/2 cells grown on coverslips were differentiated into brown adipocytes with addition of APS (0.2 mg/ml and 0.4 mg/ml). After washing with cold phosphate-buffered saline (PBS, pH 7.4), the cells were fixed with cold methanol, permeabilized with 0.25% Trition X-100, and blocked with 3% bovine serum albumin (Sigma). Subsequently, the cells were incubated with anti-UCP1 antibody (1:200) at 4°C overnight, followed by incubation with anti-rabbit fluorescent secondary antibody at room temperature for 1 h. Finally, cells were mounted, and images were captured with a DMi8 fluorescence microscope (Leica, Wentzler, Germany).
Dual-luciferase reporter assay
A fragment of mouse Cux1 3ʹ-untranslated region (UTR) sequence spanning from 3464 to 4102 bp was cloned into psiCHECK-2 dual-luciferase reporter plasmid (HanBio, Shanghai, China) to generate psiCHECK-2-Cux1-3′UTR wild type. The psiCHECK-2-Cux1-3′UTR mutant was generated by mutating the seed region of predicted miR-1528-5p site (5ʹ-AAGCTCAGCAG-3ʹ to 5ʹ-CGAACTGTTCA-3ʹ) using the Mut Express II Rapid Mutagenesis Kit V2 (Nuoweizan Biotechnology, Nanjing, China). The primer sequences were 5ʹ-TTCTAGGCGATCGCTCGAGACATCTGCCCACTCACTTCCAC-3ʹ (forward) and 5ʹ-TTATTGCGGCCAGCGGCCGCGGCTTTCACAGCTACACAACCT-3ʹ (reverse).
For luciferase assay, human HEK 293T cells (gift from Dr Guoqing Cao’s Lab in Shanxi Agricultural University, Taiyuan, China) grown in 96-well plates were transfected with psiCHECK-2-Cux1-3′UTR plasmid, mutant, or psiCHECK plasmid, together with synthetic miR-1258-5p precursor or NC (GenePharma, Shanghai, China) using Lipofectamine 3000 reagent (Thermo Fisher Scientific). Cells were harvested 48 h after transfection, and luciferase activity was measured using a dual-luciferase assay kit (Promega, Madison, USA) following the manufacturer’s instruction. Luminescence was measured using a Synergy H1 microplate reader (Biotek, Winooski, USA).
Oil Red O staining
Differentiated adipocytes were washed twice with ice-cold PBS and fixed with 10% formaldehyde for 10 min at room temperature. Subsequently, cells were washed with PBS and 60% isopropyl alcohol and incubated with 0.2% (v/v) Oil Red O (Sigma) at room temperature for 30 min. After that, cells were rinsed with 60% isopropanol for 15 s and washed twice with PBS. Images were captured under the DMi8 fluorescence microscope. The dye was solubilized with isopropanol and absorbance was measured with a Synergy H1 microplate reader (Biotek).
Cell viability assay and LDH assay
Cell viability assay was performed using a Cell Counting Kit 8 (CCK8; Solarbio, Beijing, China). Briefly, mouse C3H10T 1/2 cells seeded in 96-well plate (1×10³ cells/well) were exposed to either APS (0.2 mg/ml and 0.4 mg/ml) or vehicle for 24 h. Upon completion, 10 μl of CCK8 solution was added into each well and incubated for 3 h before the test. The absorbance at 450 nm was measured with the Synergy H1 microplate reader.
Cell toxicity was measured using a lactate dehydrogenase (LDH) assay kit (CK28; Dojindo, Kumamoto, Japan) according to the manufacturer’s instructions. Briefly, C3H10T 1/2 cells were cultured in a 96-well plate overnight, and then APS at different concentrations (0, 0.1, 0.2, 0.4, 0.6, 0.8, and 1.0 mg/ml) were added to the medium and incubated for 24 h. Cell suspension was then removed to a new 96-well plate and mixed with 100 μl of working solution for 30 min in the dark at 25°C, followed by addition of 20 μl of lysis buffer for 30 min at room temperature. After that, 50 μl of stop solution was added, and optical density (OD) value was monitored at 490 nm with the Synergy H1 microplate reader. The activity of LDH was calculated based on the formula provided by the manufacturer.
EdU staining
The 5-ethynyl-2′-deoxyuridine (EdU) staining was performed using Cell-LightTM EdU DNA cell proliferation kit (C10310-1; RiboBio, Guangzhou, China). Briefly, C3H10T 1/2 cells at logarithmic phase were treated with APS (0.2 mg/ml and 0.4 mg/ml) for 24 h. After exposure to 50 μM EdU for 2 h, cells were fixed with 4% paraformaldehyde, permeabilized by 0.5% Triton X-100, and incubated with 1× Apollo reaction cocktail. The EdU-labeled cells were visualized under the DMi8 fluorescence microscope.
Statistical analysis
All data were analyzed using GraphPad Prism 7 software package (Monrovia, USA). Data were expressed as the mean±standard error of mean (SEM), while homogeneity of variance and normality were evaluated using Brown–Forsythe test and Shapiro–Wilk test, respectively. Both Student’s t-test with a two-tailed distribution and one-way analysis of variance were used where appreciated, and P<0.05 was considered as statistically significant.
Results
APS inhibits C3H10T 1/2 cell proliferation
To determine the effect of APS on C3H10T 1/2 cell proliferation, the LDH assay was employed to evaluate cellular cytotoxicity of APS. As shown in Fig. 1A, the LDH contents did not vary significantly among cells receiving APS at different concentrations (from 0 to 1 mg/ml). The CCK8 assay results suggested that APS inhibited C3H10T 1/2 cell proliferative ability in a dose-dependent manner (Fig. 1B). Meanwhile, both 0.2 mg/ml and 0.4 mg/ml of APS decreased the number of EdU-positive staining cells (Fig. 1C). Compared with control cells, 0.2 mg/ml of APS was sufficient to reduce both CDK4 and PCNA protein levels (P<0.05, Fig. 1D). Consistently, mRNA expressions of PCNA, cyclin D1, and Ki67 were downregulated in cells treated with both 0.2 mg/ml and 0.4 mg/ml of APS (P<0.05, Fig. 1E). These data indicated that APS inhibited C3H10T 1/2 cell proliferation ability.
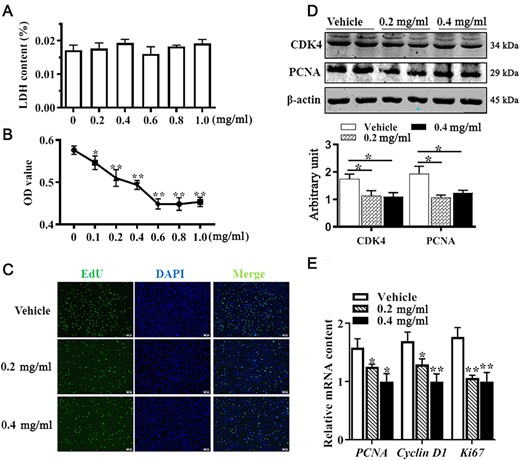
APS inhibited C3H10T 1/2 cell proliferation Mouse C3H10T 1/2 cells were treated with ASP or vesicle for 24 h. (A) Cellular cytotoxicity under different concentrations of APS was determined by LDH assay. (B) Cell viability determined by CCK8 assay. (C) EdU staining. (D) PCNA and CDK4 protein abundances analyzed by western blot analysis. (E) mRNA expressions of PCNA, cyclin D1, and Ki67. Data are presented as the mean±SEM, n=6. *P<0.05 and **P<0.01 vs control.
APS promotes the differentiation of C3H10T 1/2 cells into brown adipocytes
We further observed the effect of APS on the differentiation of C3H10T 1/2 cells into brown adipocytes by using Oil Red O staining, immunocytochemical staining, western blot analysis, and qRT-PCR. As shown in Fig. 2A, both 0.2 mg/ml and 0.4 mg/ml of APS increased lipid accumulation after 6 days of differentiation compared with control cells. Brown adipocytes were quantified by UCP1 immunocytochemical staining. As shown in Fig. 2B, the number of UCP1-positive cells was elevated by APS addition, consistent with the increased protein level of UCP1 (Fig. 2D, P<0.05). Moreover, protein levels of key transcription factors, including PRDM16, PPARγ, C/EBPβ, and PGC1α were all elevated in APS-treated cells (Fig. 2C,D, P<0.05). Furthermore, mRNA expressions of brown adipogenic markers, including UCP1, PRDM16, Cidea, Cox7a, and PGC1α were upregulated when cells were subject to APS treatment (Fig. 2E, P<0.05), which further confirmed the enhanced brown adipogenic differentiation by APS. These data indicated that APS promotes brown adipogenesis of C3H10T 1/2 cells.
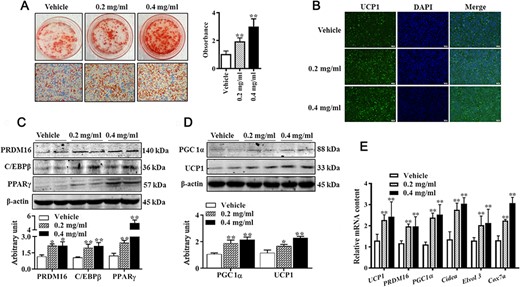
APS promoted brown adipocytes formation (A) Cells were induced to brown adipogenesis for 6 days with or without APS (0.2 mg/ml and 0.4 mg/ml), and adipocytes were visualized by Oil Red O staining (100× magnification). (B) Immunocytochemistry staining of UCP1 after 6 days of differentiation. (C,D) Protein abundances of PRDM16, C/EBPβ, PPARγ, PGC1α, and UCP1. (E) Relative mRNA expressions of brown adipogenic markers. Data are presented as the mean±SEM, n=6. *P<0.05 and **P<0.01.
Effect of APS on insulin sensitivity and AMPK activity
In order to determine whether APS regulates insulin sensitivity in C3H10T 1/2 cells, we quantified proteins involved in insulin sensitivity. As shown in Fig. 3A, phosphorylated Akt content was increased by APS treatment in a dose-dependent manner (P<0.01). Compared with control cells, phosphorylated IRS1 contents were also increased in APS-treated cells (Fig. 3B, P<0.05), and no alteration of total IRS1 was observed among groups. Consequently, increased GLUT4 content was observed in APS-treated cells (Fig. 3C, P<0.01). In addition, cells treated with APS exhibited elevated p-AMPK level (Fig. 3D, P<0.05). These data indicated that APS improves insulin sensitivity in C3H10T 1/2 cells.
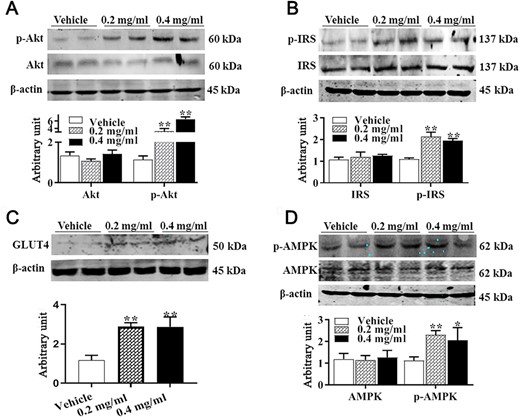
Effect of APS treatment on IRS1, Akt, and AMPK contents (A) Akt and p-Akt protein contents. (B) IRS1 and p-IRS1 protein contents. (C) GLUT4 protein content. (D) AMPK and p-AMPK. Data are presented as the mean±SEM, n=6. *P<0.05 and **P<0.01.
miR-1258-5p directly targets 3ʹUTR of Cux1
Previous studies indicated that the pharmacological effects of APS are exerted by regulating miRNA expression. To test whether APS regulates brown adipogenesis through interacting with miRNAs, differentially expressed miRNAs were identified by sequencing. The reads statistical results of each sample mapped to the reference genome are shown in Supplementary Table S1. Based on the applied criteria (|log2 Fold change|≥1, P<0.05), 40 miRNAs were identified to be differentially expressed between control and APS-treated cells, of which 18 miRNAs were upregulated and 22 miRNAs were downregulated (Fig. 4A). Furthermore, a potential binding site of miR-1258-5p was predicted in the 3′UTR of Cux1 (Fig. 4B); therefore, we validated the expression of both miR-1258-5p and Cux1. The qRT-PCR results confirmed that miR-1258-5p content was significantly lower in APS-treated cells (Fig. 4C, P<0.05). To identify whether miR-1258-5p regulates brown adipocyte differentiation, we treated cells with miR-1258-5p inhibitor, and data showed that UCP1 level was elevated in miR-1258-5p inhibitor-treated cells (Fig. 4D). Moreover, APS treatment increased CUX1 content at both mRNA (Fig. 4E, P<0.05) and protein levels (Fig. 4F, P<0.01). Luciferase assay results suggested that mimics of miR-1258-5p led to lower luciferase activity than that in NC-transfected cells (Fig. 4G, P<0.05). Compared with control cells, CUX1 protein abundance was decreased in miR-1258-5p mimics-treated cells (Fig. 4H, P<0.01) and elevated in miR-1258-5p inhibitor-treated cells (Fig. 4I, P<0.01). These data indicated that APS regulates brown adipogenesis through interaction with miR-1258-5p and Cux1.
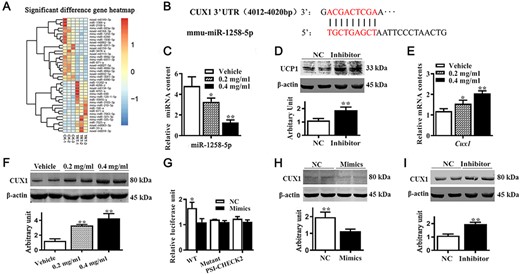
APS affected miRNAs and CUX1 expression (A) miRNA expression profiles of the vehicle group (CK-1 to CK-3) and 0.4 mg/ml of APS treatment group (TRT-1 to TRT-3), with 40 miRNAs identified as differentially expressed between control and APS-treated cells. (B) Binding site of the miR-1258-5p on 3′UTR of Cux1. (C) mRNA expression of miR-1258-5p. (D) UCP1 protein abundances after cells were transfected with miR-1258-5p inhibitor. (E) mRNA expression of Cux1. (F) CUX1 content. (G) Human 293 T cells were transfected with plasmids with or without 3′UTR of Cux1 luciferase reporter, together with miR-1258-5p mimics or NC. Relative luciferase activities are shown. (H–I) CUX1 protein abundances after cells were transfected with miR-1258-5p mimics and inhibitor. Data are presented as the mean±SEM, n=3 for sequencing and n=6 for other tests. *P<0.05 and **P<0.01.
CUX1 regulates brown adipogenesis in C3H10T 1/2 cells
To further determine the regulatory role of CUX1 on brown adipogenesis, we detected CUX1 expression pattern at different time points of brown adipogenesis. As shown in Fig. 5A, the CUX1 protein level was gradually increased within the first 3 days of differentiation and began to decrease on the fourth day of differentiation. Overexpression of Cux1 promoted lipid droplet accumulation (Fig. 5B), and conversely, less lipid droplet accumulation was observed in Cux-knockout adipocytes (Fig. 5C). As expected, protein abundances of those brown adipogenic markers, including UCP1, PRDM16, and PPARγ, were upregulated in Cux1-overexpressing cells (Fig. 5D), and downregulated when Cux1 was knockout (Fig. 5E). These data indicated that CUX1 regulates brown adipogenesis in C3H10T 1/2 cells.
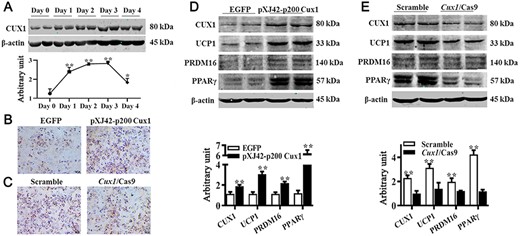
CUX1 regulated brown adipogenesis (A) CUX1 protein expression pattern during brown adipogenic differentiation. C3H10T 1/2 cells transfected with either pXJ42-p200 Cux1 or scramble were induced to brown adipogenesis. (B) Adipocytes were visualized by Oil Red O staining. (C) Results of Oil Red O staining. (D) Protein abundances of CUX1, UCP1, PRDM16, and PPARγ. (E) Protein contents of CUX1, UCP1, PRDM16, and PPARγ. Cux1 was knocked out by Cux1 CRISPR/Cas9, and cells were induced to brown adipogenesis. Data are presented as the mean±SEM, n=6. *P<0.05 and **P<0.01.
APS regulates brown adipogenesis via CUX1
To investigate whether APS regulates brown adipogenesis through CUX1 in mouse C3H10T 1/2 cells, Oil Red O staining was employed to assess lipid accumulation in brown adipocytes. As shown in Fig. 6A, the promoting effect of APS on lipid accumulation was compromised when Cux1 was knocked out. Moreover, western blot analysis results suggested that Cux1 knockout attenuated the promoting effect of APS on the abundance of key brown adipogenic markers, including UCP1, PRDM16, C/EBPβ, PGC1α, and PPARγ (Fig. 6B). These data indicated that APS might perform the regulatory role in brown adipogenesis through interacting with CUX1.
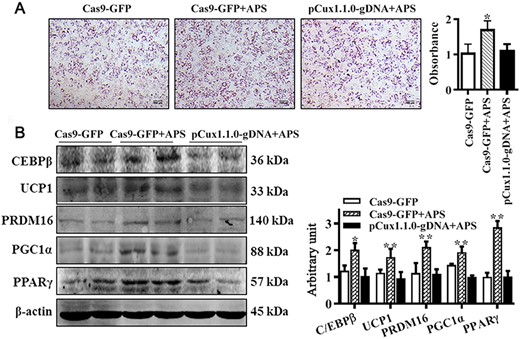
APS facilitated brown adipogenic differentiation through CUX1 C3H10T 1/2 cells were treated with 0.4 mg/ml of APS or vehicle, and simultaneously, the Cux1-knockout cells were subject to treatment with 0.4 mg/ml of APS. (A) Brown adipogenic differentiation was evaluated by Oil Red O staining after 6 days of differentiation. The number of brown adipocytes was compromised when Cux1 was knocked out. (B) C/EBPβ, UCP1, PRDM16, PGC1α, and PPARγ protein contents among different groups. Data are presented as the mean±SEM, n=6. *P<0.05 and **P<0.01.
Discussion
BAT is recognized as an antidiabetic tissue owing to its ability to oxidize glucose and lipids and dissipate energy in the form of heat [18]. Therefore, increasing energy expenditure through adipocyte thermogenesis is generally accepted as a potential therapeutic strategy for preventing obesity and improving metabolic health [19,20]. However, the available pharmacological approaches to promote adipocyte thermogenesis have limited use owing to their limited efficacy, possible side effects, and drug interactions [21]. Thus, identifying safe and effective thermogenic potential agents that can stimulate brown adipogenesis is needed. Numerous studies have recently explored the effects of naturally occurring components on adipocyte differentiation and lipid accumulation [22,23]. Owing to its low toxicity and side effects, APS has been widely utilized in clinical settings [24]. The LDH activity has been widely applied in determining cytotoxicity. In the presence of APS, LDH activity remained constant in C3H10T 1/2 cells, which further suggested its potential safety and therapeutic application in clinics.
Adipogenesis involves two major events: preadipocyte proliferation and adipocyte differentiation. Numerous studies have demonstrated that APS affects cell proliferation, and the effect of suppression or stimulation varies depending on cell type examined and APS concentration [25,26]. In the present study, we found that APS exhibited an antiproliferative effect on mouse C3H10T 1/2 cells, which might be attributed to the effect of APS on PCNA, a standard marker of cell proliferation [27]. Similarly, a decreased PCNA content was observed in APS-treated rat C6 glioma [28], and mechanisms of how APS affects PCNA expression need to be further studied. Furthermore, the cyclin D1/CDK4 complex has been strongly implicated in the control of cell proliferation [29], while downregulation of cyclin D1 is important for cell cycle exit and initiation of differentiation [30]. Therefore, by downregulating CDK4 and cyclin D1, APS exerts an antiproliferative effect on C3H10T 1/2 cells.
APS has been recognized as an antidiabetic agent. Most recently, APS was proposed to alleviate high-fat-diet-induced metabolic disorders in mice [31], and meanwhile, APS increases terminal differentiation of 3T3-L1 preadipocytes [32], which promoted us to hypothesize that APS may regulate brown adipogenesis. In the present study, APS was found to effectively increase the number of brown adipocytes, which was accompanied by elevated PRDM16 and C/EBPβ contents. Considering that both PRDM16 and C/EBPβ are key transcriptional factors involved in brown adipogenesis, we suggest that APS may directly regulate brown adipogenesis of C3H10T 1/2 cells. The UCP1 uncouples the substrates of oxidation and adenosine triphosphate formation during the process of mitochondrial electron transport [1] and thus serves as an effector of BAT. Therefore, the elevated UCP1 level further suggests the regulatory effect of APS on brown adipogenesis.
It is well-established that BAT positively regulates whole-body glucose homeostasis and insulin sensitivity [2]; meanwhile, BAT has been shown to be a highly insulin-sensitive tissue [33]. Within the canonical PI3K/Akt signaling pathway, binding of insulin to its receptor induces IRS1 phosphorylation, which further activates PI3K and Akt, leading to GLUT4 translocation and glucose uptake [34]. Here, APS was shown to increase phosphorylation of IRS1 and Akt, suggesting that APS enables insulin sensitization in brown adipocytes, which might proceed through the activation of insulin/Akt signaling pathway. Indeed, APS functions to alleviate glucose toxicity by increasing liver glycogen synthesis and skeletal muscle glucose translocation in the type 2 diabetes mellitus patients (T2DM) rat model [35]. Moreover, APS treatment effectively activates AMPK, in agreement with previous studies showing that APS activates AMPK in both L6 myotubes and 3T3 L1 adipocytes [16,36]. Considering that activation of AMPK promotes Glut4 transcription through the histone deacetylase 5 transcriptional repressor [37], and enables GLUT4 translocation and glucose transportation [38], we believe that activation of AMPK by APS may provide an alternative explanation for APS-enhanced insulin sensitivity in brown adipocytes.
The next question is how APS regulates brown adipocytes formation. miRNAs are small non-coding RNAs that post-transcriptionally regulate gene expression. Several miRNAs have been identified to participate in the regulation of brown adipogenesis [13]. Likewise, some of the physiological effects of APS are proposed to implement through the regulation of miRNAs [39]. Our miRNA expression profile results identified 40 differentially expressed miRNAs, and miR-1258-5p was selected for further experiments. DNA methylation is an epigenetic event that plays critical roles in gene expression regulation. With Gene Set Enrichment Analysis, a previous study revealed that APS causes promoter DNA methylation changes of many genes [40]. Therefore, APS might affect miRNA expression via DNA methylation during brown adipocytes differentiation, which needs to be further identified. Based on the predictions from three software, a miR-1258-5p-specific binding site was identified in the 3′UTR of Cux1. Here, we validated that APS downregulated miR-1258-5p expression and upregulated CUX1 expression. Moreover, administration of miR-1258-5p mimics or inhibitor markedly influenced CUX1 expression. Collectively, these data suggest that APS may affect Cux1 expression through interacting with miR-1258-5p.
The transcription factor CUX1 functions as regulator of cell proliferation and differentiation. A previous study demonstrated that CUX1 facilitates fat mass and obesity associated (FTO) expression [41]. Interestingly, FTO expression is upregulated during adipogenesis, whereas Fto knockdown attenuates 3T3-L1 preadipocyte differentiation [42]. Moreover, FTO expression is necessary for the maintenance of C/EBPβ expression in murine and human adipocytes in vitro [42]. Since C/EBPβ plays vital roles in regulating brown adipogenesis, we hypothesize that CUX1 may be positively related to brown adipogenesis in C3H10T 1/2 cells. In the present study, we demonstrated that Cux1 ablation attenuates brown adipogenesis, whereas Cux1 overexpression enhances brown adipogenic potential. To the best of our knowledge, this is the first report revealing the relation between CUX1 and brown adipogenesis. To further elucidate whether APS regulates brown adipogenesis via the interaction with CUX1, we treated Cux1-KO cells with APS. The compromised effect of APS on brown adipogenesis in Cux1-KO cells suggested that the regulatory effect of APS might be, if not all, through the interaction with CUX1. Therefore, our data suggest that CUX1 builds a bridge between APS and brown adipocytes formation. In conclusion, APS exerts an antiproliferative effect, enhances brown adipocytes formation, and improves insulin sensitivity in C3H10T 1/2 cells. The regulatory effect of APS on brown adipogenesis might be through the interaction with CUX1.
Supplementary Data
Supplementary Data is available at Acta Biochimica et Biophysica Sinica online.
Funding
This work was supported by the grant from the National Natural Science Foundation of China (No. 31972559).
Conflict of Interest
The authors declare that they have no conflict of interest.
References
Author notes
Yuxin Cao,Buhao Deng contributed equally to this work.
