


Metabolic reprogramming has been recognized as one of the 10 new hallmarks of cancer cells [1]. Increased glycolysis (Warburg effect) under normoxic conditions and glutamine metabolism has been well recognized as the main characteristics of human malignancies [2]. Cumulative evidence supports the concept that dysregulation of lipid metabolism is also one of the key metabolic markers of cancer cells [3]. Cancer cells with highly proliferating rate can obtain more lipids by enhancing lipid uptake, lipolysis, and de novo fatty acid synthesis. Studies have revealed the importance of lipid metabolic reprogramming in carcinogenesis [4]. Lipid metabolism is tightly related to the proliferation, invasion, migration, radiosensitivity, and chemosensitivity of several tumors, including lung and breast cancers [4,5].
Pathways related to lipid metabolism in the Reactome database
| Pathways | Database | Gene count |
|---|---|---|
| Regulation of lipid metabolism by peroxisome proliferator activated receptor alpha PPARalpha | Reactome | 119 |
| Metabolism of lipids | Reactome | 738 |
| Sphingolipid metabolism | Reactome | 89 |
| Transcriptional regulation of white adipocyte differentiation | Reactome | 84 |
| Glycerophospholipid metabolism | KEGG | 77 |
| Fatty acid metabolism | Reactome | 177 |
| Sum | 1284 (unique: 776) | |
Papillary thyroid cancer (PTC) is a common malignant tumor with sharp increase worldwide [6]. Although most of PTCs have good prognoses, ~10% of patients lack the response to radioactive iodine therapy, and patients with poorly differentiated or undifferentiated tumors are more likely to face disease recurrence and death [7]. In thyroid cancer, the association between lipid metabolism and tumor progression has less been explored. Previously, we reported that lysine methyltransferase 5A (KMT5A), a lipid-modulating gene, could modulate oncogenesis of PTC cells through regulating lipid metabolism [8]. Other studies also showed that the alteration of fatty acid metabolism influences the energy stores, affects drug resistance, modulates cell proliferation and survival, and stimulates the extracellular environment [9]. As a regulatory population, the differential distribution of different lipid metabolism-related genes (LMRG) can reflect the malignant characteristics of tumors to a certain extent. Systematic exploration of the lipid metabolism may shed new light on the mechanistic understanding of PTC.
In the present study, we aimed to detect the association between LMRG and clinical features in patients with PTC. We collected LMRG expression data from The Cancer Genome Atlas (TCGA) databases and identified two molecular subtypes of PTC with distinct clinicopathological characteristics.
A total of 497 PTC patients with RNA-seq data and clinical information from TCGA thyroid carcinoma (THCA) dataset (all are PTC) were collected. A total of 776 genes related to lipid metabolism from six LMRG sets (Table 1) were collected from the Molecular Signature Database v7.0 (MSigDB). Among them, only genes with average fragments per kilobase per million value greater than zero in >50% samples were included for the analysis. Finally, 740 genes were used for the subsequent analysis.
The molecular clusters were identified through non-negative matrix factorization (NMF), and the optimal number of clusters was determined according to the indicators such as cophenetic correlation [10], residual sum of squares (RSS), dispersion, and silhouette. Silhouette coefficient can be used to select the appropriate number of clusters. According to the line chart, the point with the largest coefficient change range can be found intuitively, and the point with the largest distortion range is the best number of clusters. An RSS is a statistical technique used to measure the amount of variance in a dataset that is not explained by a regression model. Thus, RSS value negatively reflects the clustering performance of the model. We identified two molecular subtypes (Cluster 1 and Cluster 2) in PTC based on lipid metabolism-related genes (Fig. 1A,B). The expression of recurrence-related LMRG in both clusters is shown in Fig. 1C. Our results revealed a trend that the expression level of recurrence-related LMRG in Cluster 2 was higher than that in Cluster 1. Then we analyzed the relationship of the two clusters with recurrence risk, which showed that Cluster 1 has a significantly worse time to relapse (TTR) than Cluster 2 (Fig. 1D, log-rank P=0.037, Harzard ratio=1.813).

Identification of molecular subtypes in papillary thyroid cancer (A) Consensus map of NMF clustering. (B) NMF rank survey of cophenetic, RSS and dispersion. (C) Heat map of 740 LMRGs in both subtypes. (D) Kaplan-Meier curves showed the relapse survival (time to relapse, TTR) curve of patients in the two subtypes. (E) The proportions of B cell, CD4+T cell, CD8+T cell, Neutrophil, Macrophage, and Dendritic cell (DC) in the two subtypes. (F) Distribution of the tumor immune estimation resource, tumor stromal, immune and estimate scores between the two subtypes. (G) Volcano map of differentially expressed genes between Cluster 2 and Cluster 1. (H) Heat map of differentially expressed genes expression profile and the distribution of clinicopathological parameters between Cluster 2 and Cluster 1.
We then analyzed the difference on immune scores between the two subtypes by using the TIMER (tumor immune estimation resource) tool (Supplementary Table S1). Next, we calculated the immune and matrix scores and tumor purity of each sample by using R package Estimate (Supplementary Table S2). Except macrophage, CD8+ T cell, neutrophil, and dendritic cell showed higher immune scores in Cluster 1 than in Cluster 2; the immune scores of B cell and CD4+ T cell were significantly lower in Cluster 1 than those in Cluster 2. In addition, the immune and matrix scores and tumor purity of in the Cluster 1 were significantly higher than those in the Cluster 2 (Fig. 1E,F). These results indicated that Cluster 1 and Cluster 2 had distinct immune and matrix microenvironment. Furthermore, DESeq2 was used to calculate differentially expressed genes (DEGs) in the clusters (false discovery rate <0.05 and |log2FC|>1). Results showed that there were 979 deregulated genes between Cluster 1 and Cluster 2, and most LMRG were upregulated in Cluster 2 compared with those in Cluster 1 (Fig. 1G–H and Supplementary Table S3). We also compared the difference in clinicopathological parameters between the two subtypes and found that patients with advanced T stage, N stage, and TNM stage tended to appear in the Cluster 1 subtype with poorer TTR (Fig. 2A). Then, weighted gene correlation network analysis (WGCNA) co-expression algorithm was used to find the co-expressed coding genes and co-expressed modules. First, we extracted the transcripts per kilobases of exon model per million mapped reads (TPM) profiles of protein-coding genes from the TCGA PTC datasets. By hierarchical clustering the expression profiles of protein-coding genes, we found no samples with outliers in the TCGA PTC datasets (Fig. 2B). Then, we calculated the distance between each gene using the ‘Pearson’ correlation coefficient, constructed a weighted co-expression network, and screened the co-expression modules. To ensure that the co-expression network constructed by WGCNA is scale-free, we set the soft threshold as 7 (Fig. 2C). The topology overlapping matrix (TOM) was then constructed from the adjacency matrix to avoid the influence of noise and spurious associations. On the basis of TOM, average linkage clustering using the dynamic tree cut method was subsequently conducted to define co-expression modules. The size of genes in a module should be more than 30. Module eigengenes were further calculated to explore the relationship among modules. Modules with highly correlated eigengenes were merged together and eventually formed a new module network. The cut-off values of module integration parameters were set as height=0.25, deepSplit=2, and minModuleSize=30. We then merged modules with highly correlated eigengenes together and finally obtained 24 modules in WGCNA, as showed in Fig. 2D, gray modules represent gene sets could not be merged. The correlation between the 24 modules and patients’ clinical pathological parameters as well as molecular phenotype showed that Cluster1 and Cluster2 were significantly correlated with the purple (148 genes) and blue (2690 genes) module, respectively (Fig. 2E). Next, to get the module most relevant to each phenotype, we analyzed the correlation between genes and phenotypes by integrating the correlation between module and phenotype, which showed good correlation between purple module and Cluster 1, as well as blue module and Cluster 2 (Fig. 2F and Supplementary Table S4). Then, we intersected all 979 DEGs and genes in co-expression modules and finally obtained 182 differentially co-expressed genes (DCEGs).
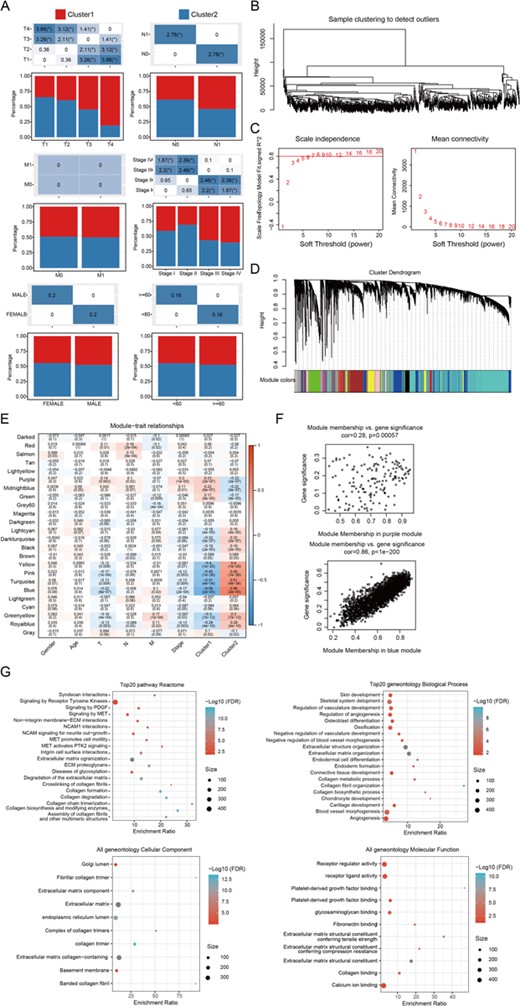
WGCNA co-expression analysis (A) The distribution of the clinicopathological factors in the two subtypes. (B) Hierarchical clustering for identification of samples with outliers. (C) Analysis of network topology with various soft-thresholding powers. (D) Gene dendrogram and module colors. (E) Relationship between the 24 modules and the clinical phenotypes, as well as molecular subtypes. (F) The correlation of purple module with Cluster 1 (upper), and blue module with Cluster 2 (down) in the TCGA dataset. (G) Enriched top 20 Reactome pathways and geneoncology biological processes, cellular component, and molecular function of the 182 DCEGs. The color from red to blue represents the significance of P value, and redder color represents smaller P value; the dot size represents the number of genes enriched into the pathway, and larger number represents larger value.
A functional enrichment analysis of these DCEGs was carried out using the R software package WebGestaltR. A Kyoto Encyclopedia of Genes and Genomes (KEGG) analysis showed 24 significant Reactome pathways and Gene Ontology (GO) analysis showed 42 significant categories. The top 20 Reactome pathways and GO categories are shown in Fig. 2G. The most significant Reactome pathways include protein digestion and absorption, ECM-receptor interaction, and thyroid hormone synthesis.
In summary, we performed a transcriptome analysis of LMRG in PTC. We described the first, to our knowledge, use of LMRG to assess their ability on PTC classification that improves the current tumor stratification. The biological relevance of these two subtypes is illustrated by significant differences in tumor immunity and matrix microenvironment and patients’ outcomes. However, further prospective studies are needed and the predictive capacity of the gene panel regarding lipid metabolism should be tested for clinical application.
Funding
This work was supported by the grant from the National Natural Science Foundation of China (No. 81702649 to N.Q.).
References
Author notes
These authors contributed equally to this work.
