


Abstract
Cancer stem cells (CSCs) contribute to the relapse and development of new neoplasm lesions. While most available clinical approaches, such as chemical and radiation therapies, will kill the majority of cancer cells, they do not kill them all. Some resisting cells, like CSCs, are able to survive due to their excellent self-maintaining capabilities, even in challenging environments. In the present study, we investigated the mRNA level of DNA repair genes of colon CSCs from the HT29 cell line in response to single-strand damage and double-strand breaks, as well as the evident upregulation of key genes in base excision repair, mismatch repair, non-homologous end-joining, and homologous recombination pathways in these cells. Digital gene expression analysis identified upregulated genes in CD44+ HT29 cells that may play important roles in DNA repair. Our results reveal that colon CSCs bear efficient DNA repair abilities, which might explain the survival of colon CSCs after repeated chemical and radiation therapy.
Introduction
Globally, colorectal cancer is one of the most lethally malignant, leading to 698,000 deaths in 2012 [1]. Surgery combined with chemotherapy and radiotherapy is recommended for most patients with high grade (stage III and IV) colon cancer. Although severe injury to normal rectal tissue may also result from these procedures, radiation and chemotherapeutics that trigger carcinoma cell DNA damage are still suggested as the most effective approaches for the treatment of colon cancer.
Cancer stem cells (CSCs) are a small subpopulation of tumor cells with strong self-renewal and metastasis properties which contribute to their radio- and chemotherapy resistance. For colon CSC collection, cellular surface antigens, such as epithelial cell adhesion molecule (EpCAM) and CD44, have been used previously as colon CSC markers [2]. Furthermore, the remarkable DNA polymerase activity of ovarian CSCs was associated with their strong resistance to DNA damage following respective cisplatin and DNA cross-linker treatment in vitro and in vivo [3–5]. In addition, the excellent capability of CSCs to resist DNA damage assists their survival and their progeny under tumor microenvironments of inflammation, hypoxia, low pH, and poor nutrient supply [6]. In human colon cancer, caffeine, an inhibitor of phosphatidylinositol 3-kinase (PI3K), has been shown to decrease CSC subpopulations and chemoresistance, suggesting a crosstalk between tumorigenicity and DNA damage response [7,8]. Even in healthy bodies, hematopoietic stem cells show radiation resistance by entering the quiescent state and minimizing DNA exposure to damage [9,10].
Following single-strand damage and double-strand breaks, cells employ DNA repair that consists of base excision repair, nucleotide excision repair, mismatch repair [11–13], non-homologous end-joining, microhomology-mediated end-joining, and homologous recombination [14–16]. Previous research has demonstrated that APE1/Ref-1, the mammalian apurinic/apyrimidinic endonuclease protein, functions as a scavenger to remove reactive oxidative species promoting DNA damage under CSC microenvironments (e.g. hypoxia, inflammatory cytokines). Attenuation of APE1/Ref-1 signals sensitizes prostate cancer, breast cancer and osteosarcoma cells to DNA damage agents [17]. Double-strand breaks are the most harmful type of DNA damage. The Rad50, MRE11, and Nbs1 (MRN) complex efficiently responds to double-strand breaks by binding to and stabilizing broken DNA ends [18,19]. Cancer cells also repair double-strand breaks by homology-directed recombination or non-homologous end-joining [20,21]. Non-homologous end-joining is an error-prone DNA repair mechanism that utilizes DNA end-binding proteins Ku70/Ku80 [22]. BRCA1, a tumor suppressor, also stabilizes the genome following DNA lesions, mutations, and deletions in cooperation with RAD51, which binds to double-strand break sites and actualizes cell cycle checking [23–25].
In this study, we performed magnetic isolation of CD44+ colon CSCs for digital gene expression (DGE) profiling of the DNA repair pathway. Functional analysis of the genes related to DNA repair showed integral activation of base excision repair and mismatch repair for single-strand damage, and non-homologous end-joining and homologous recombination for double-strand breaks. Our study revealed that colon CSCs possessed excellent DNA repair capacity, which could explain, at least in part, their resistance to chemical and radiation therapy-induced DNA damage in colon cancer patients.
Materials and Methods
Cell culture
Colon cancer cell line HT29 was provided by Dr Qiangming Sun of the Institute of Medical Biology, Chinese Academy of Medical Sciences (Kunming, China) and cultured in Dulbecco's modified Eagle's medium (DMEM; Gibco, Shanghai, China) supplemented with 10% fetal bovine serum (FBS; Biological Industries, Wentworthville, Australia) in an incubator with 5% CO2 at 37 °C. The CD44+ colon CSCs from the HT29 cell line were maintained in DMEM/F12 medium (Gibco) containing 20 ng/ml epidermal growth factor (EGF; Miltenyi Biotec, Bergisch Gladbach, Germany), 10 ng/ml fibroblast growth factor 2 (FGF2; Miltenyi Biotec) and 2% B27 (Miltenyi Biotec). The CD44+ HT29 cell-derived tumorspheres were cultured in suspension cell culture plates (Beaver Bio, Suzhou, China). The CD44− HT29 cells were cultured in DMEM with 10% FBS, as described above.
Isolation of CD44+ colon CSCs
The CD44+ subpopulation of HT29 cells was isolated using magnetic beads according to standard procedures. In brief, HT29 cells were trypsinized to obtain an individual cell suspension and incubated with magnetic beads and anti-human CD44 antibodies (Miltenyi Biotec) for 10 min at 4°C. Cells were loaded onto LS columns and CD44+ HT29 cells were separated from other cells using a QuadroMACS™ Separator (Miltenyi Biotec).
RNA extraction
RNA samples of CD44+ and CD44− HT29 cells were prepared using an RNeasy Mini Kit (QIAGEN, Hilden, Germany). Briefly, RLT lysis buffer was added to cells, and the lysate was then well mixed with 70% ethanol by pipetting. The mixture was loaded into a spin column for RNA binding. The column was washed twice with 500 μl RW1, then washed twice with 500 μl PRE buffer. Finally, RNA was dissolved in RNase-free water for further use.
Quantitative real time fluorescence polymerase chain reaction (qPCR)
Reverse transcription (RT) reactions were conducted to obtain cDNAs using a Prime Script TM RT Reagent Kit (TaKaRa, Dalian, China). SYBR Primix Ex Taq TM (TaKaRa) was used for quantitative real time fluorescence polymerase chain reaction (qPCR). Experiments were carried out using a real-time PCR machine (Applied Biosystems, Alameda, USA). Sequence of primers is listed in Table 1.
Sequence of primers used in qPCR
| Gene | Sequence of sense primer | Sequence of anti-sense primer |
|---|---|---|
| UNG1 | 5′-GAGCCACATCGCAACTAC-3′ | 5′-GGGCACCACTCACTTCTG-3′ |
| MBD4 | 5′-CTGCTCAGTTTGGTGCTA-3′ | 5′-ATCTTCCTGCTGTCTTCC-3′ |
| SMUG1 | 5′-GAGCCACATCGCAACTAC-3′ | 5′-GGGCACCACTCACTTCTG-3′ |
| POLσ | 5′-CGGAAATCAGCATCTTGTCA-3′ | 5′-GGCGAAAGTCGGTATGGTAG-3′ |
| MLH1 | 5′-TACCTTCTCAACACCACCAA-3′ | 5′-GCATCTCAGCCTTCTTCTTC-3′ |
| RFC1 | 5′-TGACGAAGCCTACAAGAT-3′ | 5′-GTTCACTCCTTCCGCTAT-3′ |
| MSH2 | 5′-ACGATGGATTTGGGTTAG-3′ | 5′-CCAGGGCTTTCTGTTTAG-3′ |
| LIG1 | 5′-CCCATCGGTCACATCCTT-3′ | 5′-ATCCACCTCCTTGCGTTT-3′ |
| KU70 | 5′-CTCTTGGCTGTGGTGTTC-3′ | 5′-AGTAGTCAGATCCGTGGC-3′ |
| RAD50 | 5′-TGTGGCGAAGTACCTAT-3′ | 5′-TTTGTTGTTGGCTCATC-3′ |
| POLλ | 5′-ATCTTCAGCCGCCTCCTT-3′ | 5′-GGCACCACGATGATGTCC-3′ |
| RAD51 | 5′-GCAGCACAGCAGAGGAAG-3′ | 5′-GAGCAGAGTCCACCGAAG-3′ |
| RAD52 | 5′-GGCTCAGTGTTATGCTTTGG-3′ | 5′-TGCGGCTACTTATGTATTCT-3′ |
| TOP3 | 5′-CCCGAACAGAAACAAACA-3′ | 5′-GGAAATGGCGAACAATAA-3′ |
| EME1 | 5′-CACCTGTCCCAGAAATAG-3′ | 5′-TTGAGCCAGAGGAATAAA-3′ |
| XPC | 5′-GAACCACCCTCTGTATGCC-3′ | 5′-TTCTCCAAGCCTCACCACT-3′ |
| XPD | 5′-TGCCGTTTCTGGGACTGG-3′ | 5′-TACTGCGCCCGCACATAG-3′ |
| DDB2 | 5′-GGACAAACCCACCTTCAT-3′ | 5′-GACCACCATTCGGCTACT-3′ |
| POLε | 5′-CAGTGGACGGATAAGATGGA-3′ | 5′-CCTTTCTGGTCGCAATGTAG-3′ |
Digital gene expression profiling
DGE profiling was performed according to the manufacturer's protocols (Illumina, San Diego, USA). Total RNAs were pooled from two types of cells as described above, that is, the CD44+ CSCs (CD44+) and CD44− control cells (CD44−), separately. Two sequencing libraries were generated according to the manufacturer's recommendations. The mRNAs were purified from total RNAs using poly-T oligo-attached magnetic beads. Fragmentation was carried out in NEB proprietary fragmentation buffer. First strand cDNA synthesis was performed using random hexamers. Second strand cDNA synthesis was performed using dNTPs, RNase H, and DNA polymerase I. The remaining overhangs were converted into blunt ends using a QiaQuick PCR kit (QIAGEN). After adenylation of the 3′ ends of the cDNA fragments, adaptor oligonucleotides were ligated to the cDNA fragments. The cDNA fragments with ligated adaptor molecules on both ends were then size-selected using agarose gel electrophoresis and amplified by PCR. Each library was sequenced on an Illumina HiSeqTM 2500 platform (Illumina).
Mapping and analysis of DGE reads
For each DGE library, clean reads were obtained by filtering out low-quality reads and rRNAs and removing adaptor sequences. The DGE reads were mapped onto the human reference genome using TopHat v 2.0.11 (http://ccb.jhu.edu/software/tophat/index.shtml) [26]. The gene expression level was analyzed using Cufflinks v 2.1.1 (http://cole-trapnell-lab.github.io/cufflinks/releases/v2.1.1/) [27] and measured by reads per kilobase per million mapped reads (RPKM) [28]. An RPKM threshold value of 0.1 was established to determine whether or not the given genes were expressed. EBSeq (Bioconductor 3.3; http://www.bioconductor.org) was used for differentially expressed gene analysis [29]. The P-values were corrected by the Benjamini-Hochberg method [30]. Genes with more than a 2-fold change (FDR < 0.01) were identified as differentially expressed genes.
Functional analysis of differentially expressed genes
The differentially expressed genes were annotated using the non-redundant (NR), Swiss-Prot [31], Gene Ontology (GO) [32], Cluster of Orthologous Groups (COG) [33], and Kyoto Encyclopedia of Genes and Genomes (KEGG) [34] databases with BLAST searching [35]. Enrichment analysis was performed on different types of gene annotations for various gene lists using the Fisher's exact test [36] adjusted by the Bonferroni correction [37].
Results and Discussion
Digital gene expression sequencing of CD44+ colon CSCs
To obtain comprehensive transcripts of the CD44+ colon CSCs and an overview of their gene expression profiles, total RNAs were isolated from the CD44+ colon CSCs (CD44+) and CD44− control cells (CD44−). DGE profiling was performed using the Illumina platform. A total of 9,957,439 and 8,463,165 reads were obtained for CD44+ and CD44−, respectively, corresponding to more than 1.7 billion base pairs of sequence data (Table 2). Sequence quality and GC content distribution were inspected (Supplementary Figs. S1 and S2), and results showed that DEG sequencing possessed high quality score and exactly matched GC content distribution.
DGE data statistics
| Sample | Total reads | Total nucleotides | GC percentage | Q30 percentage | Mapped | Unique mapped | Multiple mapped |
|---|---|---|---|---|---|---|---|
| CD44+ | 9,957,439 | 914,801,339 | 50.66% | 91.19% | 7,602,588 | 7,390,377 | 212,211 |
| CD44− | 8,463,165 | 854,779,665 | 51.66% | 89.72% | 7,045,272 | 6,846,050 | 199,222 |
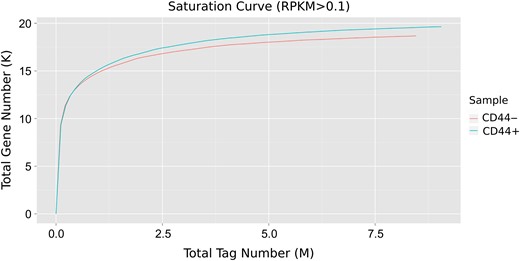
Saturation curve analysis of the digital gene expression profiling of CD44+ and CD44− samples
Identification of differential gene expression
Gene expression levels of CD44+ and CD44− populations of HT29 cells were calculated and normalized using RPKM. The RPKM distribution and density distribution were compared and were shown in Supplementary Figs. S5 and S6, respectively. Correlation testing between CD44+ and CD44− samples (Supplementary Fig. S7) showed that few differentially expressed genes existed between the CD44+ and CD44− samples. Fold-changes and P-values were used to compare the gene expression levels between the two samples. Comparative analysis identified a total of 6249 differentially expressed genes. Among them, 3115 were upregulated and 3134 were downregulated in CD44+ compared with CD44− subpopulation of HT29 cells.
Functional analysis of differentially expressed genes
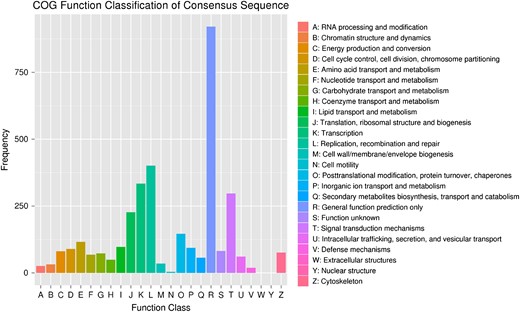
COG function classification of differentially expressed genes The function categories are listed on the right.
Functional annotation statistics of differentially expressed genes
| Total | NR | Swiss-Prot | GO | KEGG | COG |
|---|---|---|---|---|---|
| 6249 | 6233 | 6201 | 6111 | 3391 | 2379 |
| Total | NR | Swiss-Prot | GO | KEGG | COG |
|---|---|---|---|---|---|
| 6249 | 6233 | 6201 | 6111 | 3391 | 2379 |
Functional annotation statistics of differentially expressed genes
| Total | NR | Swiss-Prot | GO | KEGG | COG |
|---|---|---|---|---|---|
| 6249 | 6233 | 6201 | 6111 | 3391 | 2379 |
| Total | NR | Swiss-Prot | GO | KEGG | COG |
|---|---|---|---|---|---|
| 6249 | 6233 | 6201 | 6111 | 3391 | 2379 |
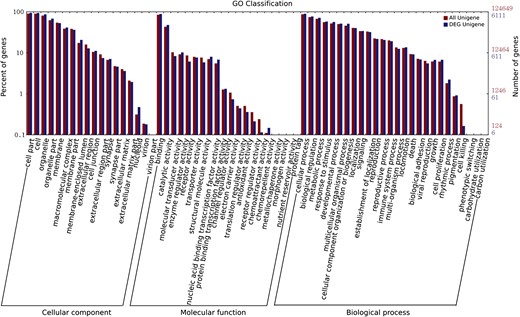
GO functional enrichment of differentially expressed genes The distribution of all genes encoded in the reference genome is shown in red. The distribution of differentially expressed genes is shown in blue.
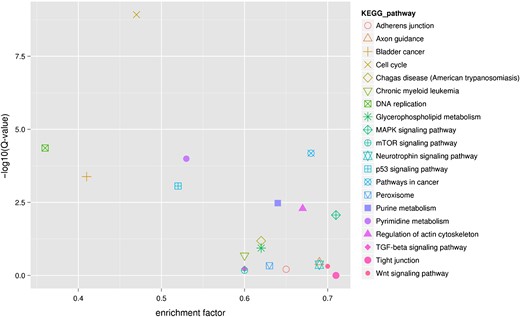
KEGG pathway enrichment of differentially expressed genes The top right corner shows the most enriched KEGG pathways.
GO functional enrichment (biological process) of differentially expressed genes
| GO term | Number | Correlated P-value |
|---|---|---|
| G1/S transition of mitotic cell cycle (GO:0000082) | 104 | 1.49E-06 |
| Organ development (GO:0048513) | 226 | 1.63E-06 |
| Regulation of DNA-dependent DNA replication initiation (GO:0030174) | 20 | 3.84E-06 |
| DNA replication initiation (GO:0006270) | 39 | 1.51E-05 |
| Single-organism developmental process (GO:0044767) | 353 | 1.67E-05 |
| Chromosome segregation (GO:0007059) | 88 | 2.25E-05 |
| Cell division (GO:0051301) | 272 | 0.001320845 |
| DNA replication (GO:0006260) | 93 | 0.001664745 |
| Gene silencing (GO:0016458) | 29 | 0.001893301 |
| DNA strand elongation involved in DNA replication (GO:0006271) | 33 | 0.002818764 |
| Activation of protein kinase activity (GO:0032147) | 42 | 0.003097855 |
| Pyrimidine nucleoside salvage (GO:0043097) | 16 | 0.003181955 |
| Cell cycle process (GO:0022402) | 80 | 0.006871153 |
| Regulation of cell cycle (GO:0051726) | 109 | 0.007973628 |
| Cell cycle arrest (GO:0007050) | 108 | 0.008742882 |
| Negative regulation of transcription from RNA polymerase II promoter (GO:0000122) | 433 | 0.018076542 |
| Neurotrophin TRK receptor signaling pathway (GO:0048011) | 226 | 0.020824833 |
| Regulation of phosphorylation (GO:0042325) | 26 | 0.023171996 |
| Immune system process (GO:0002376) | 83 | 0.024763176 |
| G2/M transition of mitotic cell cycle (GO:0000086) | 127 | 0.028641706 |
DNA single-strand damage repair provision in colon CSCs
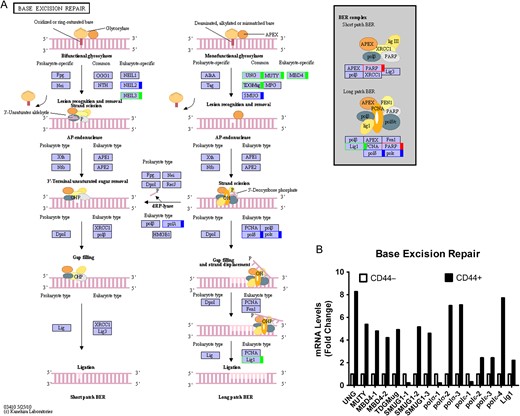
Base excision repair pathway in colon CSCs (A) KEGG pathway. Green, upregulated; Red, downregulated; Blue, mix regulated. (B) Histogram of mRNA levels of base excision repair genes. ENST number (UNG, ENST00000242576; MUTY, ENST00000354383; MBD4-1, ENST00000503197; MBD4-2, ENST00000515266; TDGMug, ENST00000266775 SMUG-1, ENST00000508394; SMUG-2, ENST00000337581; SMUG-3, ENST00000401977; polσ-1, ENST00000376930; polσ-2, ENST00000262266; polσ-3, ENST00000395803; polε-1, ENST00000376577; polε-2, ENST00000320574; polε-3, ENST00000216367; polε-4, ENST00000374171; Lig1, ENST00000263274).
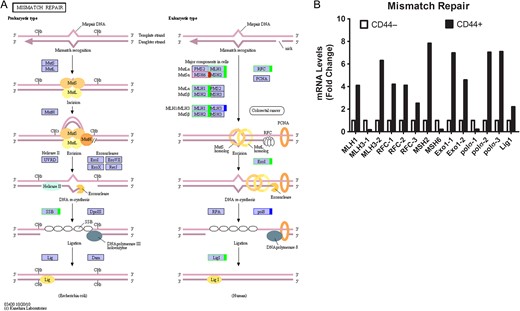
Mismatch repair pathway in colon CSCs (A) KEGG pathway. Green, upregulated; Red, downregulated; Blue, mix regulated. (B) Histogram of mRNA levels of mismatch repair genes. ENST number (MLH1, ENST00000458205; MLH3-1, ENST00000355774; MLH3-2, ENST00000238662; RFC-1, ENST00000449502; RFC-2, ENST00000463194; RFC-3, ENST00000454402; MSH2, ENST00000394794 MSH6, ENST00000445503; Exo1-1, ENST00000366547; Exo1-2, ENST00000423397; polσ-1, ENST00000376930; polσ-2, ENST00000262266; polσ-3, ENST00000395803; Lig1, ENST00000263274).
High capacities of colon CSCs to repair DNA double-strand breaks
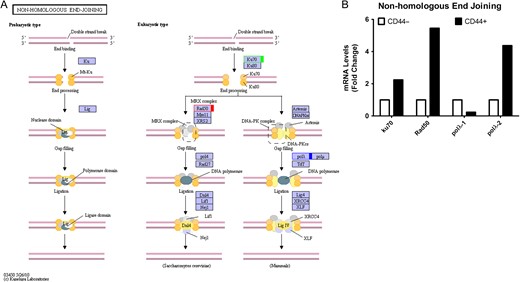
Non-homologous end-joining pathway in colon CSCs (A) KEGG pathway. Green, upregulated; Red, downregulated; Blue, mix regulated. (B) Histogram of mRNA levels of non-homologous end-joining genes. ENST number (ku70, ENST00000402580; Rad50, ENST00000453394; polλ-1, ENST00000429502; polλ-2, ENST00000456836).
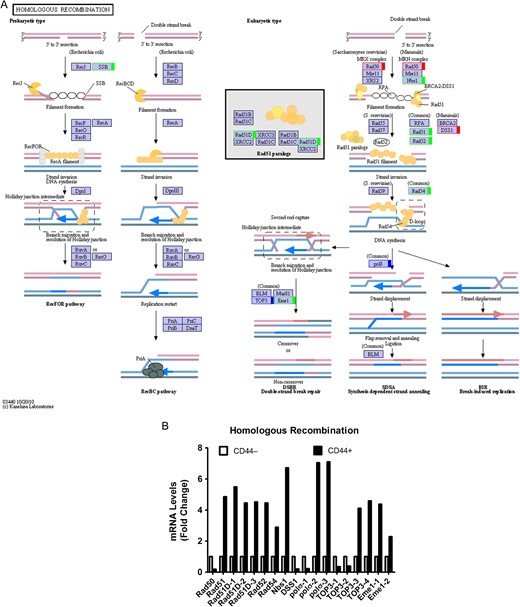
Homologous recombination pathway in colon CSCs (A) KEGG pathway. Green, upregulated; Red, downregulated; Blue, mix regulated. (B) Histogram of mRNA levels of homologous recombination genes. ENST number (Rad50, ENST00000453394; Rad51, ENST00000423169; Rad51D-1, ENST00000360276; Rad51D-2, ENST00000394589; Rad51D-3, ENST00000494406; Rad52, ENST00000481052; Rad54, ENST00000371975; Nbs1, ENST00000265433; DSS1, ENST00000482389; polσ−1, ENST00000376930; polσ−2, ENST00000262266; polσ−3, ENST00000395803; TOP3-1, ENST00000424393; TOP3-2, ENST00000457270; TOP3-3, ENST00000357179; TOP3-4, ENST00000403680; Eme1-1, ENST00000510246; Eme1-2, ENST00000511519).
Further qPCR confirmation and nucleotide excision repair pathway analysis
Previous studies have shown that activation of CD44 is associated with DNA repair activities [56–58]. In this study, 186 DNA repair-related genes were found to be significantly upregulated in CD44+ cells, and part of them playing key role in DNA repair was shown in this study (Figs. 5–8 andSupplementary Fig. S9). They were distributed in various DNA repair pathways, including base excision repair, nucleotide excision repair, mismatch repair, homologous recombination and non-homologous end-joining. Further qPCR analysis also confirmed that CD44 antigen positive population in HT29 cells exhibit excellent DNA repair capacity (Supplementary Fig. S9).
Core basal transcription factor 2 (TFIIH), which is composed of TTDA, XPB, XPD and TFIIH proteins, is complexed to CAK. When UV damage occurs, the Xeroderma Pigmentosum Group C (XPC) complex initiates damage recognition and opens complex formation. The heterodimeric DNA damage-binding (DDB) complex binds to recognized DNA, followed by repair protein complex formation [59,60]. We found that DDB1, XPB, CDK7 and CCNH (Supplementary Fig. S8A,B, labeled in red) which provide vital function in initiation of nucleotide excision repair are downregulated. This result showed that colon CSCs do not burden preponderant capacity of nucleotide excision repair, suggesting that colon CSCs may depend on base excision repair and mismatch repair to fix single-strand breaks instead of nucleotide excision repair.
In summary, our study suggests that colon CSCs activate DNA repair-related signaling, including base excision repair, nucleotide excision repair, mismatch repair, non-homologous end-joining and homologous recombination for their genomic stability. Our results provide new insights into our understanding of radiation and chemotherapy resistance in colon CSCs.
Supplementary Data
Supplementary data is available at ABBS online.
Funding
This work was supported by the grants from the National Basic Research Program of China (973 Program) (No. 2013CB127500), the National Natural Science Foundation of China (Nos. 31270131, 31160021, 81271330, 31160237, and 31260276), the Yunnan Province Science and Technology Innovation Team (No. 2011CI123), the Talent Program of Yunnan Province (No. W8110305), the Foundation of School of Life Sciences of Yunnan University (No. 2012S301), the Natural Science Foundation of Yunnan Province (No. 2011BC003), the Science Foundation of Education Department of Yunnan Province (No. ZD2015002), and the Yunnan Province New Academic Talent Award 2014 (No. YN201418).
References
Author notes
These authors contributed equally to this work.
