


Abstract
The evolution of colouration and patterns is a captivating aspect of biological research shaped by multiple factors. Pachyrhynchus weevils, known for their unpalatable nature owing to their tough elytra, inhabit the tropical regions of the Philippines and display intricate elytral patterns that contribute significantly to species diversity. To investigate the evolution of patterns in Pachyrhynchus weevils, we used the ultraconserved elements method to construct a phylogeny encompassing 99 species and to assess pattern evolution. These weevils exhibit flexibility in pattern expression, with a trend towards pattern retention and diversification rather than pattern loss, as indicated by the analyses of evolutionary transition rates. Furthermore, using phylogenetic generalized linear regression, we found that patterns are associated with specific geographical regions, suggesting that convergent evolution of patterns occurs among weevils. Finally, our analysis revealed that speciation rates are not consistent with the rates of pattern diversification. These results highlight the complexity of pattern evolution and suggest that varying selection pressures in different areas, such as predation, combined with frequent transitions in patterns, might contribute to the evolution of these patterns, potentially leading to a rich diversity among these island-dwelling insects.
Introduction
Through adaptive processes, selection pressures, such as sexual selection, predation, and environmental factors, shape the diverse colour patterns observed in animals, significantly driving their diversification across species (Cuthill et al. 2017). The diversification of colour patterns can be facilitated by sexual selection, because these patterns are essential for communication signals in mate choice (Maan and Sefc 2013). Speciation is closely linked to sexual selection, as evidenced by the positive association between speciation rates and trait evolution in avian species (Cooney et al. 2019, Beltrán et al. 2021). Colour patterns can also adapt to specific ecological conditions under predation pressure. In particular, mimicry between different genera further contributes to pattern transitions among lineages (Davis Rabosky et al. 2016, Miller et al. 2019). Additionally, geological events, such as those on oceanic islands and during climatic events, can lead to habitat changes that promote local adaptation and speciation (Borregaard et al. 2017, Folk et al. 2019). Therefore, understanding the mechanisms behind colour pattern diversification is crucial for comprehending the development of varied colour patterns in organisms.
Among highly diversified invertebrates, some insect species, such as tiger beetles and butterflies, display a wide variety of conspicuous colour patterns, and the evolutionary mechanisms of these colour patterns in insects have been studied (Tsuji et al. 2016, Tian et al. 2019, Moest et al. 2020). Pachyrhynchus Germar, 1824, which display varied and conspicuous colour patterns on their elytra, provide a unique system for investigating the evolution of their colour patterns. These weevils are well known for their hard bodies, which serve as a secondary defence (Wang et al. 2018). Therefore, their vivid colour patterns might function as aposematic signals, indicating their unpalatable nature to predators, particularly to the lizard Diploderma swinhonis (Tseng et al. 2014, Lee et al. 2018). Additionally, the similar colour patterns observed among species might suggest potential mimetic relationships (Schultze 1923, Yoshitake 2017).
Over the past decade, several studies have investigated the diversity of colour patterns in Pachyrhynchus weevils using comparative phylogenetic methods. In the Taiwan–Luzon Volcanic Belt, Pachyrhynchus weevils found on the same island display similar colour patterns, suggesting potential Müllerian mimicry among these island species (Ye et al. 2022); the Pachyrhynchus orbifer complex exhibits pattern variation ranging from blocks to checkered patterns, indicating rapid evolution of colour patterns in these weevils (Tseng et al. 2018), although the taxonomy of the P. orbifer complex requires further revision. A recent study by Van Dam et al. (2023) was the first to reveal the evolution of colour patterns across ~50 species and identified convergent evolution in these patterns, which was suggested to be driven by frequency-dependent selection. Nonetheless, how these patterns change across species and what factors might drive the diversity of these patterns remain unclear.
This study uses extensive sampling, including representatives from 99 Pachyrhynchus species (covering ~60% of known species within the genus), and comparative phylogenetic methods to explore pattern evolution in Pachyrhynchus weevils. Although Van Dam et al. (2023) suggested that the most common spot pattern represents the ancestral character in Pachyrhynchus weevils, ancestral characters among other major clades might vary owing to broader sampling. Specifically, we aim to investigate: (i) the ancestral patterns in major clades, whether pattern evolution depends on phylogenetic relationships among species; (ii) how patterns transition between species; (iii) whether the speciation rate of weevils corresponds to the rate of pattern diversification; and (iv) whether there is a correlation between patterns and geographical regions. Based on observed associations between patterns and geographical regions in prior studies (Yoshitake 2017, Ye et al. 2022, Van Dam et al. 2023), we predict that certain patterns (e.g. spots, checker) might be correlated with specific geological regions, supporting a mimicry hypothesis from a broader perspective. Through extensive sampling and genome-wide analysis, this study aims to uncover the potential mechanisms driving pattern diversification.
Materials and methods
Taxon sampling
This study included a total of 134 specimens, comprising 99 valid species of Pachyrhynchus weevils, 27 specimens representing subspecies or populations, and 5 unidentified specimens, along with 3 outgroup taxa. The outgroup taxa, chosen based on the relationships inferred by Van Dam et al. (2023), include Pantorhytes quadripustulatus Gestro, 1875 and Metapocyrtus (Orthocyrtus) mansaka Cabras, Bollino & Medina, 2018, belonging to Pachyrhynchini, and Eupyrgops Berg, 1898, which is a sister genus of Pachyrhynchini. Most specimens were obtained from the National Museum of Natural Science in Taichung, Taiwan, and some were sourced from personal collections. These samples included 77 dry/pinned specimens and 57 fresh specimens preserved in 95% ethyl alcohol.
UCE sequencing
Genomic DNA was extracted from tissues of the head and thorax using the NautiaZ Tissue DNA Extraction Mini Kit (Nautiagene, Taipei, Taiwan) and stored at −20°C. For the library preparation, we used a NEBNext Ultra II DNA Library Prep Kit (NEB #E7103; New England Biolabs Inc., Ipswich, MA, USA) and NEBNext Multiplex Oligos for Illumina (NEB #E7600). Ultraconserved element (UCE) enrichment was performed using the myBaits Coleoptera 1.1Kv1 kit (Faircloth 2017), which targets 1172 loci, and we followed the standard protocol outlined in version 5 (Arbor Biosciences Inc., Ann Arbor, MI, USA). The sequencing was performed on the Illumina NovaSeq 6000 for paired-end reads of 150 bases.
Demultiplexed sequence data were processed using the PHYLUCE v.1.7.1 pipeline (Faircloth 2016). We used Illumiprocessor v.2.0, a wrapper for Trimmomatic to remove adapters and low-quality nucleotides (Lohse et al. 2012, Del Fabbro et al. 2013, Faircloth 2013, Bolger et al. 2014). Next, we assembled the contigs using SPADES v.3.14.1 (Bankevich et al. 2012). We manually removed most sequences of <120 bp and >1500 bp to improve the recovery of UCE loci, because residual excess adaptors could affect the efficiency of downstream analyses (Costello et al. 2018). After matching the probes and UCEs, we aligned these UCE sequences using MAFFT v.7.475 and performed edge-trimming with TrimAl (Capella-Gutiérrez et al. 2009, Katoh and Standley 2013). We assembled UCE supermatrices for 10%–90% taxon coverage to assess the impacts of missing data on phylogenetic analyses.
Phylogenetic analyses
For phylogenetic analyses, we partitioned the UCE loci using Sliding-Window Site Characteristics (SWSC-EN) and performed the concatenation-based maximum likelihood (ML) method in IQ-TREE v.2.2.0 (Nguyen et al. 2015, Tagliacollo and Lanfear 2018). Node supports were estimated using ultrafast bootstrapping (UFBoot) (Hoang et al. 2018) and SH-aLRT (Guindon et al. 2010) with 1000 replicates. The substitution model was selected using ModelFinder (Kalyaanamoorthy et al. 2017). To evaluate genealogical concordance, gene concordance factors (gCFs) and site concordance factors (sCFs) were inferred using the default settings in IQ-TREE, using ML trees derived from the datasets with 10%–90% taxon coverage as reference trees. Individual gene trees used for the concordance analyses were constructed using UFBoot approximation for node support estimation, along with additional search parameters based on the methodology suggested by Cohen et al. (2021) to improve the phylogenetic inference. The Robinson–Foulds distances were calculated using the function of RF.dist in R package phangorn (Robinson and Foulds 1981, Schliep 2011).
Divergence dating
We used BEAST2 v.2.6.6 (Bouckaert et al. 2019) to estimate the divergence times based on a dataset covering 70% of the known taxa, comprising samples from 110 individuals, excluding most population-level samples. To reduce the time required for analysis, we selected the 550 UCE loci with the highest number of parsimony-informative sites from the dataset of 586 UCE loci with 70% taxon coverage, then randomly paired these loci into 10 subsets of 55 loci each, following McCullough et al. (2019) and Brady et al. (2022). Each subset was run independently three times, with each run consisting of 200 million generations and trees sampled every 10 000 generations. All replicates were combined after discarding 25% as burn-in. Site rate variation was estimated using the HKY model with four-category gamma distribution with ‘empirical’ frequency, and the relaxed lognormal clock model with a clock rate prior of 1 × 10⁻⁹ was used (Kronforst and Papa 2015). The birth–death tree prior was applied because Ritchie et al. (2017) suggested that this model produced more stable recovered ages for the datasets containing both interspecific and intraspecific sampling. Based on the 70% ML tree reconstructed from 134 specimens, we extracted the subtree comprising 110 individuals to serve as the starting tree. The weight of the tree topology search parameters was set to zero. Because fossils are unavailable in our taxa, secondary fossil calibration points from Letsch et al. (2020) and Van Dam et al. (2023) were used to estimate divergence times in this study. Letsch et al. (2020) used eight genes and five fossils to calibrate Curculionidae divergences, estimating that Pantorhytes and Pachyrhynchus diverged ~34.2 Mya (note: Pachyrhynchus was misspelled as ‘Pachyrrhynchus’ in the original publication). Van Dam et al. (2023) applied geological calibration from emergence of the Philippine proto-islands, estimating that Pantorhytes diverged from the Metapocyrtus–Pachyrhynchus clade at ~36.2 Mya and that Metapocyrtus and Pachyrhynchus split at ~26.3 Mya. Based on previous studies, two calibration points were used in this study: the split between Pantorhytes and the remaining sampled taxa was set with a mean value of 35.2 Mya and σ 4; and the split between Pachyrhynchus and Metapocyrtus was set with a mean value of 26.3 Mya and σ 1. Both points were set with a normal distribution.
Comparative analyses of the evolution of patterns
Pattern analyses included evaluating the evolution of patterns over time, the level of phylogenetic signal for each pattern category, pattern transition rate, and the association between patterns and geographical regions. To mitigate computational bias, most specimens from population and subspecies levels were excluded. As a result, a total of 107 specimens (Supporting Information, Table S1) were included in pattern analyses, incorporating unidentified specimens to explore the potential diversity within Pachyrhynchus weevils.
Based on the dorsal view of the elytra (Fig. 1), we classified all the patterns into six categories. Although these categories might seem simple, they represent the fundamental pattern types that form the foundation for pattern identification and are methodologically robust, making them applicable to a wide range of species. The following six patterns can be defined: (i) ‘blocks’, irregular scaly patches or thicker scaly bands that appear as large colour patches scattered across the elytra; (ii) ‘checker’, a continuous or discontinuous horizontal line on the median part of the elytra, flanked on both sides by vertical lines or vertically elongated ovals on both sides, which may be connected or not connected to the horizontal line; (iii) ‘patternless’, characterized by a lack of any noticeable pattern, these elytra can feature a smooth surface with indiscernible colour variations or a complete absence of scales in certain areas, resulting in a uniformly coloured appearance; (iv) ‘reticulation’, characterized by scale lines that form a net-shaped pattern, consisting of irregular unfilled elongated ovals or hollow circular patterns with <12 circles, and the pattern can vary from dense and intricate to more spaced out, with scales interwoven like threads in a network; (v) ‘spots’, featuring numerous filled or unfilled spots arranged across the elytra, which can vary in size and shape, sometimes overlapping or spaced unevenly; and (vi) ‘stripe’, featuring filled or unfilled vertical bands, lines, or elongated oval shapes present across the elytra, which, unlike the checker pattern, do not include horizontal lines. Among the 99 species, ~15% of the species exhibited intraspecific pattern variations (Supporting Information, Table S1), indicating the presence of two distinct patterns within the same species. Except for the reconstruction of ancestral characters and the analysis of pattern transition, we treated these pattern variations as separate pattern categories for subsequent pattern analyses involving phylogenetic signals, pattern diversification rates, and pattern–distribution correlation, owing to limitations in our analytical methods. To conduct all comparative analyses, we used the molecular dating tree for each analysis.
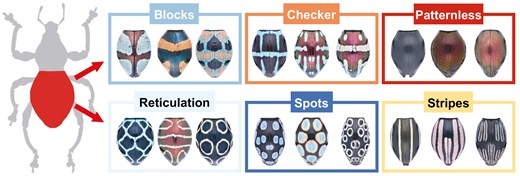
Six categories of dorsal pattern on elytra of Pachyrhynchus.
Ancestral character states of patterns across the Pachyrhynchus weevils were inferred to observe the evolution of patterns over time, which was reconstructed through stochastic mapping to simulate trait evolution. The evolutionary models, including equal rate (ER), symmetric (SYM), and all-rates-different (ARD), were tested before ancestral state reconstructions. Because some Pachyrhynchus weevils displayed pattern variations, we selected the best-fitting model based on Akaike information criterion scores using the function fitpolyMk in R package phytools v.1.0.1 (Revell 2012). The ancestral state was estimated using the function make.simmap for 1000 simulations of stochastic character mapping under the best-fitting model (ER model; Supporting Information, Table S2).
To evaluate the evolutionary relationships of patterns of Pachyrhynchus weevils, we estimate the level of phylogenetic signal for each character. The phylogenetic D-statistic (phylogenetic dispersion) for binary characters was calculated by using the function phylo.d in the caper package in R (Orme et al. 2013). We performed 1000 permutations to test whether D was significantly different from the stimulation of Brownian motion or phylogenetic randomness.
To investigate pattern transitions in Pachyrhynchus weevils, we used the multistate function in BayesTraits v.4.0.0 to assess the transition relationships among the six pattern categories (Pagel and Meade 2006). We estimated the prior parameter through ML analyses, using the BOBYQA ML algorithm five times with default settings. To reduce the uncertainty and arbitrariness of choosing priors, we ran the hyper prior method (Pagel and Meade 2006). The exponential prior and the uniform prior were set between 0 and 100 based on the ML estimation, and the mean and variance of the gamma prior from a uniform distribution were set to the interval 0–10 in the analysis. We used reverse jump Markov chain Monte Carlo (RJMCMC), with 10 million generations and a burn-in of 1 million. Branch lengths were scaled to have a mean of 0.1 using the command ‘ScaleTrees’. The transition between two patterns was evaluated using z-scores. If the z-scores were >50% of RJMCMC iterations, the patterns were relatively difficult to change; if the z-scores were <50%, the patterns were relatively likely to change.
Furthermore, we assess the potential contribution of geographical distribution to pattern variation. We defined five discrete biogeographical areas, including four regions (Luzon, Mindanao, Mindoro, and Negros-Panay) based on the Pleistocene Aggregate Island Complex hypothesis (Brown and Diesmos 2002, Brown et al. 2013). The fifth area comprised the northern islands of Luzon, encompassing Ishigaki, Iriomote, Green, Orchid, Batanes Islands, and Babuyan Islands. This area was included owing to the potential of the flightless Pachyrhynchus weevils for multiple long-distance dispersal through abiotic or biotic factors (e.g. ocean currents and endozoochory) across the Taiwan–Luzon volcanic belt (Tseng et al. 2018, Yeh et al. 2018, Lin et al. 2021). Based on phylogenetic generalized linear regression with the function phyloglm in the R package phylolm, we tested associations between geographical distribution and patterns under the ‘logistic_IG10’ method, running for 1000 bootstrap replicates to obtain 95% confidence intervals for both the alpha and effects parameters (Tung Ho and Ané 2014). The discrete data included the five geographical regions and six pattern categories (Supporting Information, Table S1), and each sample was assigned to one of two states, where zero indicated absence and one indicated present.
Speciation rates, pattern diversification rates, and correlation analysis
To investigate the speciation rates, we implemented the cladogenetic diversification rate shift (ClaDS) in the R package RPANDA, which uses the Bayesian method to estimate branch-specific diversification rates under the birth–death diversification process (Morlon et al. 2016, Maliet et al. 2019). We implemented a constant turnover rate model (ClaDS2) using the function fit_ClaDS, which suggested that extinction rates vary across lineages. The three MCMC chains were run for 2 million iterations. Pattern diversification rates were estimated using the function RRphylo with the R package RRPHYLO, which was based on phylogenetic ridge regression that calculated the phenotype and branch lengths to estimate phenotypic diversification rates (Castiglione et al. 2018). We also tested the rate shifts using the function search.shift. This analysis aimed to identify potential significant shifts in the rates of trait evolution.
To evaluate the relationship between species diversification and pattern evolution, we performed a correlation analysis between log-transformed ClaDS speciation rates and log-transformed RRPHYLO trait evolution rates using a modified version of the R code provided by Beltrán et al. (2021). We implemented ES-sim, a semi-parametric test that calculates tip-rate correlation using Pearson’s correlation coefficient and conducts a simulation-based significance test on trait evolution under the Brownian motion model that compares the observed data with a null distribution of trait evolution data (Harvey and Rabosky 2018).
Results
Phylogeny and evolutionary history
Among all specimens, an average of 655 UCE loci were recovered (minimum = 94; maximum = 782), representing ~50% of the loci targeted by the kit. Based on different taxon coverage of datasets, 306–922 UCE loci with 25 127–62 035 parsimony-informative sites were obtained (Supporting Information, Table S3). The results of ML analyses supported the monophyly of Pachyrhynchus weevils and revealed the evolutionary relationships of two major lineages: lineage A, which included the morotaiensis, amabilis, decussatus, and orbifer clades, and lineage B, which included the erichsoni, gammatus, congestus, and pinorum clades (Fig. 2). The ML topologies of major clades were consistent across the 10%–90% datasets, with most clades showing high support values (SH-aLRT/ultrafast bootstrap = 100/100), except for lower support between the decussatus and orbifer clades (SH-aLRT/ultrafast bootstrap = 65.9/91). The eight major clades demonstrated low gCFs, with most <20% (mean gCF: 14.6%), particularly in the decussatus and orbifer clades, which had gCFs of <10%. In contrast, these clades presented moderate sCFs, with a mean of 47.9% (Fig. 2; Supporting Information, Figs S1 and S2).
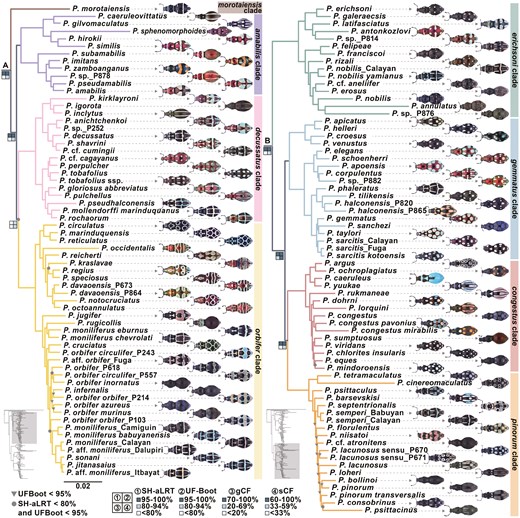
Phylogeny of Pachyrhynchus weevils inferred from the 70% taxon coverage ultraconserved element dataset. Inverted triangles represent ultrafast bootstrap (UFBoot) support values of <95, and dots indicate both UFBoot support of <95 and SH-aLRT support of <80. At major root nodes, four squares represent the support values for SH-aLRT, UFBoot, gene concordance factor (gCF), and site concordance factor (sCF), with gCF and sCF thresholds defined by Cohen et al. (2021).
The molecular dating analysis indicated that the two lineages in Pachyrhynchus weevils split at 24.4 Mya (95% credibility interval = 21.3–27.6 Mya), during the late Oligocene and early Miocene (Fig. 3; Supporting Information, Fig. S3). In lineages A and B, the major clades diversified during the Miocene (16.5–20.1 Mya) and the early to middle Miocene (14.6–21.0 Mya), respectively. Meanwhile, most species diversified during the Pliocene and Pleistocene.
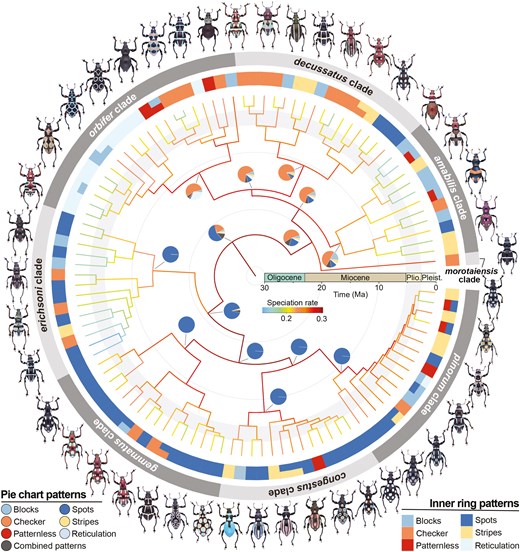
Evolutionary relationships, speciation rates, and pattern evolution of Pachyrhynchus weevils. In the phylogenetic tree of 107 Pachyrhynchus weevils, the colours of branches indicate speciation rates estimated using the cladogenetic diversification rate shift (ClaDS). The inner ring colours represent the pattern categories observed in the weevils, with species displaying two patterns also indicated. The outer ring colours represent the eight major clades. Pie charts at the nodes of major clades illustrate ancestral pattern reconstructions, with colours representing pattern categories. The estimated combined patterns (i.e. all cases of pattern variation) are shown in grey.
Pattern evolution among weevils
The results showed that the same patterns evolved independently and repeatedly in distantly related lineages. Ancestral state reconstruction at the root of Pachyrhynchus weevils indicated that the spot pattern was the most probable ancestral pattern (Fig. 3; Supporting Information, Fig. S4). The ancestral pattern at the root of lineage A was most likely to be checker, with moderate probabilities also for the spot pattern. Within lineage B, the spot pattern was retained from its basal lineage until other patterns evolved more recently, during the Pliocene.
We observed varying levels of phylogenetic conservatism among different pattern categories. The D-statistic results indicated strong phylogenetic conservatism for spot and reticulation patterns and moderate conservatism for checker, stripe, and block patterns (Table 1). In contrast, patternless weevils appeared to evolve with greater phylogenetic randomness, as evidenced by a weaker signal.
The statistics for the phylogenetic signal of patterns in Pachyrhynchus weevils.
| Phylogenetic dispersion, D | Blocks | Checker | Patternless | Spots | Stripes | Reticulation |
|---|---|---|---|---|---|---|
| Estimated D | 0.605 | 0.348 | 0.781 | 0.080 | 0.352 | −0.806 |
| Random model, P-value | .013 | 0 | .183 | 0 | .002 | 0 |
| Brownian model, P-value | .026 | .155 | .031 | .404 | .174 | .962 |
Asymmetrical transition among patterns
Multistate analyses of pattern transitions showed similar logarithmic marginal likelihood values and transition parameters (Supporting Information, Table S4). The analyses indicated that transitions among the six patterns are asymmetrical (Fig. 4; Supporting Information, Table S5), particularly for the patternless form, which readily changed into the other four patterns but showed fewer reversions to patternless from the others. Conversely, checker and stripes easily evolved into other remaining patterns, except reticulation, and both demonstrated a high rate of transition to blocks (z% values < 25%). Blocks and spots were more likely to evolve into checker and stripes; however, transitions between blocks and spots were not observed. The reticulation pattern displayed the simplest transition relationships among the six patterns, primarily evolving into blocks and evolving exclusively from patternless.
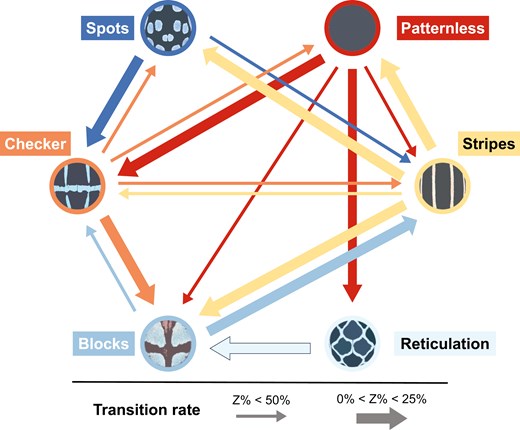
Transition rates among the six pattern categories. The thickness of the arrows indicates the strength of the transitions. Arrows representing transitions with z-values of <25% are thicker than those for transitions with z-values between 25% and 50%.
Association between patterns and geographical distribution
Pattern composition varies across islands, although the spot and checker patterns were observed across all geographical regions (Supporting Information, Table S1). The spot pattern predominated on Luzon and Mindoro, whereas stripes were secondary on Luzon and checker patterns were secondary on Mindoro. The checker pattern was most prevalent on Panay and the northern islands of Luzon, with spots being secondary on the northern islands of Luzon. The block pattern was most common on Mindanao, followed by spots and reticulation. The results of correlation analyses indicated that stripes were significantly associated with the presence of species in Luzon (P = .037), whereas spots and checker were close to significant with Mindoro (P = .086) and the northern islands (Ishigaki, Iriomote, Green, Orchid, Batanes Islands, and Babuyan Islands; P = .054) (Table 2).
Correlation between each pattern and distribution.
| Distribution | Pattern | α | Estimate ± SE | z-value | P-value |
|---|---|---|---|---|---|
| Luzon | Blocks | 1.933 | −0.094 ± 0.424 | −0.222 | .825 |
| Checker | 1.279 | −0.797 ± 0.493 | −1.616 | .106 | |
| Patternless | 1.743 | 0.644 ± 0.634 | 1.015 | .310 | |
| Spots | 1.908 | −0.028 ± 0.399 | −0.071 | .944 | |
| Stripes | 1.864 | 1.154 ± 0.554 | 2.083 | .037 | |
| Reticulation | 1.904 | 0.514 ± 0.751 | 0.685 | .493 | |
| Mindanao | Blocks | 0.612 | 0.397 ± 0.388 | 1.022 | .307 |
| Checker | 0.564 | 0.058 ± 0.295 | 0.198 | .843 | |
| Patternless | 0.610 | −0.097 ± 0.403 | −0.24 | .810 | |
| Spots | 0.576 | −0.084 ± 0.278 | −0.301 | .764 | |
| Stripes | 0.618 | −0.096 ± 0.330 | −0.291 | .771 | |
| Reticulation | 0.608 | 0.033 ± 0.548 | 0.061 | .952 | |
| Mindoro | Blocks | 0.756 | −0.367 ± 0.461 | −0.795 | .426 |
| Checker | 0.376 | 0.339 ± 0.419 | 0.808 | .419 | |
| Patternless | 0.750 | −0.626 ± 0.760 | −0.823 | .410 | |
| Spots | 4.255 | 1.397 ± 0.813 | 1.719 | .086 | |
| Stripes | 0.613 | −0.719 ± 0.569 | −1.264 | .206 | |
| Reticulation | 0.714 | −0.666 ± 0.883 | −0.755 | .45 | |
| Northern islands | Blocks | 3.957 | −0.451 ± 0.935 | −0.482 | .63 |
| Checker | 4.508 | 1.397 ± 0.726 | 1.926 | .054 | |
| Patternless | 4.635 | 0.776 ± 0.944 | 0.822 | .411 | |
| Spots | 3.563 | 0.253 ± 0.723 | 0.350 | .727 | |
| Stripes | 4.065 | −1.366 ± 1.463 | −0.934 | .350 | |
| Reticulation | 3.804 | −1.450 ± 1.967 | −0.737 | .461 | |
| Panay | Blocks | 0.310 | 0.062 ± 0.247 | 0.252 | .801 |
| Checker | 0.099 | 0.239 ± 0.301 | 0.794 | .427 | |
| Patternless | 0.208 | −0.811 ± 0.707 | −1.148 | .251 | |
| Spots | 0.290 | −0.055 ± 0.227 | −0.243 | .808 | |
| Stripes | 0.338 | −0.089 ± 0.299 | −0.298 | .765 | |
| Reticulation | 0.134 | −1.519 ± 0.917 | −1.656 | .098 |
α represents the phylogenetic correlation parameter estimate. Positive estimates with a P-value of <.1 are indicated in bold.
Rates of speciation and pattern evolution
The speciation rates were initially high but showed a decreasing trend over time (Fig. 5A). The ClaDS model inferred high variation in speciation rates among Pachyrhynchus weevils, with rates ranging from 0.152 to 0.262 species/Myr. Except for the morotaiensis clade, which comprises Pachyrhynchus morotaiensis exclusively, the pinorum clade demonstrated the highest average speciation rate (0.231 species/Myr), followed by the congestus clade (0.219 species/Myr), the decussatus clade (0.211 species/Myr), the gemmatus clade (0.210 species/Myr), the orbifer clade (0.208 species/Myr), the amabilis clade (0.189 species/Myr), and the erichsoni clade (0.180 species/Myr). In comparison to speciation rate, pattern evolution rates revealed heterogeneity across the clades of Pachyrhynchus weevils. Lineage A exhibited relatively high rates of pattern evolution in comparison to lineage B (Fig. 5B). Within lineage B, the pinorum clade displayed the highest average pattern evolution rates, whereas the gemmatus clade showed the lowest average rates. The analysis identified one shift towards higher rates of pattern evolution within the pinorum clade (Fig. 5B). Regarding the relationship between speciation and pattern evolution rates, the results showed no significant correlation between the rates of pattern evolution and speciation (Pearson’s ρ = 0.145; P = .378).
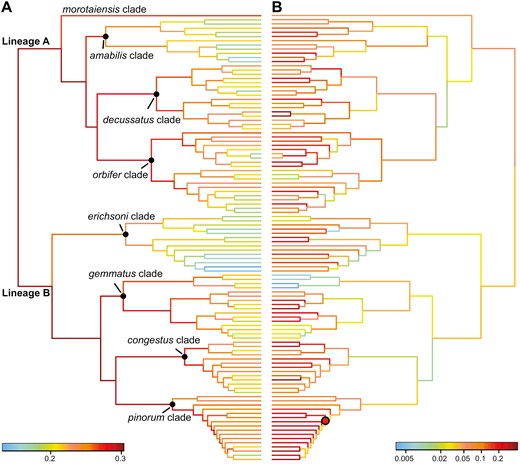
Evolutionary rates of speciation and pattern in the phylogenetic tree. A, speciation rates are estimated using the cladogenetic diversification rate shift (ClaDS). B, pattern evolution rates are estimated using RRPHYLO. A red dot on the node indicates a positive rate shift in pattern evolution.
Discussion
We use phylogenetic comparative methods to explore the diversity of colour patterns in Pachyrhynchus weevils. Different evolutionary transition pathways are observed within each pattern category, with most patterns exhibiting medium to high phylogenetic signals. Nevertheless, we find that transitions between patterns are frequent among weevils and show an asymmetrical transition across different patterns. This study identifies associations between geographical distribution and specific pattern categories, further supporting the occurrence of convergent evolution of patterns among these weevils. However, no significant correlation is found between speciation rates and pattern diversification rates. These results contribute to a deeper comprehension of the evolution of diverse elytral patterns in Pachyrhynchus weevils.
Non-random evolution of patterns
The six patterns exhibit various evolutionary processes, contributing to the observed diversity. The variation in patterns reflects specific evolutionary pathways rather than random occurrences, supporting the previous perspective that these weevil patterns play a key role in natural selection by functioning as antipredator signals (Schultze 1923, Tseng et al. 2014, Yoshitake 2017, Lee et al. 2018, Van Dam et al. 2023).
The results of phylogenetic signal analysis indicate that patterns exhibit varying degrees of phylogenetic conservatism in Pachyrhynchus weevils (see Table 1). The strong phylogenetic signal suggests that similar traits are shared among closely related species (Pagel 1999), as seen in the morphological traits of ground beetles (Stachewicz et al. 2021) and colour patterns in birds (Delhey et al. 2023). Our study indicates that spots and reticulation patterns exhibit a strong phylogenetic signal, suggesting a high degree of inheritance of these patterns. The checker, block, and stripe patterns show medium phylogenetic signals, suggesting that these patterns might have undergone some degree of selective pressure and adaptation. This can be evidenced by mimetic pairs, such as the checker pattern in Pachyrhynchus moniliferus and Pachyrhynchus phaleratus and the block pattern in Pachyrhynchus orbifer and Pachyrhynchus septentrionalis, where identical patterns are distributed across distinct clades (Fig. 2) (Van Dam et al. 2023). Although patternless exhibits a weak phylogenetic signal, this suggests that the trait might result from specific adaptive processes (Bell et al. 2021). Overall, our results demonstrate that most pattern evolution in Pachyrhynchus weevils reflects medium to high levels of inheritance from a common ancestry rather than independent evolution.
Colour pattern transitions are common in nature, and the directional tendencies of these transitions might be influenced by survival strategies (Allen et al. 2020, Loeffler-Henry et al. 2023). Under predation pressure, certain colour patterns show a higher transition rate to adapt to specific ecological conditions (Allen et al. 2020). Moreover, the mimicry of colour patterns also contributes to pattern transitions among lineages (Wilson et al. 2012, Bocek et al. 2019). Our study demonstrates asymmetrical transitions among patterns, particularly for the patternless, which tends to shift towards patterned forms. This suggests that patterned forms might be favoured by natural selection in Pachyrhynchus weevils, particularly in response to predation pressures. Behavioural experiments involving Diploderma swinhonis lizards and Pachyrhynchus tobafolius weevils indicated that weevils with colour patterns experienced a lower attack rate in comparison to non-patterned forms, suggesting that patterned weevils might have a potential survival advantage (Tseng et al. 2014). Additionally, patterns might also be linked to mate choice, as observed in experiments with Eupyrgops waltonianus weevils, which showed a preference for mating with more conspicuous individuals (Hsu et al. 2021).
Moreover, we observe that ~15% of Pachyrhynchus species display intraspecific pattern variations, showing different pattern categories within the same species. Van Dam et al. (2023) reconstructed the ancestral states of ‘open’ and ‘filled’ pattern morphs, indicating that most patterns were filled morphs and that species exhibiting both pattern morphs appeared independently in different clades. These instances of recurrent phenotypic evolution might arise from developmental and genetic constraints (Losos 2011), whereby shared genetic pathways contribute to similar phenotypes (Zhang et al. 2017). This might involve an on–off switch for gene expression, as evidenced by findings in the stripe pattern of cichlids and the wing colour pattern in Heliconius (Kratochwil et al. 2018, Concha et al. 2019, McMillan et al. 2020). Nonetheless, the genetic mechanisms underlying the elytra patterns in Pachyrhynchus weevils remain unclear. Moreover, based on the patterns observed in 15 species with intraspecific pattern variation, we found that the spot pattern has the potential to transition into other pattern categories, such as block and stripe patterns, possibly through the expansion or rearrangement of spots on the elytra. These pattern changes within a species are likely to be common in nature, as observed in tortoise beetles (Strickland et al. 2019) and hibiscus harlequin bugs (Fabricant et al. 2018). In the context of mimicry, intraspecific colour polymorphism might confer adaptive advantages (Bocek et al. 2019), allowing populations with colour variations to respond to selection pressures by acquiring alternative colour patterns. Considering these selection pressures, we suggest that pattern variation might provide adaptive advantages to these weevils.
Selective pressures might shape patterns across geographical regions
Convergent adaptation occurs when similar traits evolved independently in different species, driven by the need to adapt to similar ecological conditions (Mallet and Joron 1999, Arbuckle and Speed 2015, Urban et al. 2022). Van Dam et al. (2023) were the first to reveal Müllerian mimicry in Pachyrhynchus weevils based on the phylogenetic relationships of potential mimetic species, identifying nine mimetic pairs. Our study, while supporting the findings of Van Dam et al. (2023), takes a broader approach by investigating colour pattern evolution on a larger scale. Specifically, we observe that certain patterns emerge in distantly related taxa within specific geographical regions, suggesting that these patterns might also be influenced by selective pressures. For instance, on the northern islands of Luzon, both Pachyrhynchus nobilis and Pachyrhynchus semperi display a checker pattern on Calayan and Babuyan islands (Ye et al. 2022); likewise, Pachyrhynchus sonani and Pachyrhynchus nobilis exhibit a checker pattern on Orchid Island. In the case of species with intraspecific pattern variation, one of the patterns, the spot pattern on Pachyrhynchus barsevskisi (Rukmane-Bārbale 2020), is similar to that of Pachyrhynchus dohrni in the same area. However, the reticulation and block patterns observed in Mindanao are more likely to be inherited from a common ancestor (Fig. 3; Table 2) rather than resulting from pattern convergence, as suggested by Van Dam et al. (2023). From the analysis of the association between geography and patterns, along with the previously discussed phylogenetic conservatism of patterns, our results highlight the adaptive evolution of patterns in Pachyrhynchus. Therefore, our findings support the involvement of Pachyrhynchus weevils in Müllerian mimicry and also underscore the importance of examining pattern evolution within a broader taxonomic and geographical context.
This study finds no significant correlation between speciation rates and pattern diversification rates, suggesting that pattern variation might not be a primary driver of speciation. The relationship between speciation and phenotypic evolution rates is likely to be influenced by multiple factors (Price et al. 2016). For instance, differences in selection pressures across lineages could lead to variations in speciation rates (Zelditch et al. 2015). In the context of pattern diversification, the convergent evolution of phenotypes, such as mimicry, might also influence the evolutionary rates of colour patterns. For instance, in the mimetic system of butterfly communities in the Western Ghats, models showed faster rates of pattern evolution than mimics or non-mimetic sister species (Basu et al. 2023). Therefore, the diversification of colour patterns and speciation might not follow the same path under varying selection pressures, which requires careful examination of multiple contributing factors. Further research is necessary to clarify these influences, particularly in systems where convergent evolution and mimicry play a role.
Through comparative analyses of pattern evolution and transitions, these discoveries provide valuable insights into the evolutionary processes shaping patterns in the highly diverse weevil group. Furthermore, this study establishes a foundation for future experimental investigations and comparative studies. Although our taxon sampling is relatively expansive (covering 99 of 178 species), it does not fully represent the species diversity of all Pachyrhynchus weevils. Moreover, owing to practical considerations in the analysis, pattern classification is limited to six categories, which might lead to some loss of information regarding pattern evolution. Future studies should consider incorporating more detailed analyses (e.g. examining patterns on the pronotum or quantifying the pattern distribution) and expanding taxon sampling to provide a more comprehensive representation of pattern diversity.
Phylogenetic relationship of Pachyrhynchus weevils
The phylogenetic analyses conducted in this study demonstrate strong support for the major clades within Pachyrhynchus weevils. By excluding sequences of <120 bp, a total of 699 loci with 50% taxon coverage were identified, surpassing the range of 305–585 loci observed in previous research (Baca et al. 2017, Van Dam et al. 2017, Kobayashi et al. 2021, Sota et al. 2022). The resulting ML phylogenetic trees exhibit consistent topologies across the eight main clades, with an average Robinson-Foulds value of 14.4 (Supporting Information, Fig. S5), indicating the effective resolution of relationships within Pachyrhynchus weevils using a universal bait set.
Some discrepancies are noted when comparing the phylogenetic findings of Van Dam et al. (2023), particularly regarding the relationships between the decussatus clade and its sister group. Our study incorporates a more extensive taxonomic sampling, encompassing specimens from Southeast Asia (Philippine archipelago) and East Asia (Yaeyama islands of Japan, and the Green and Orchid Islands of Taiwan), totalling 131 individuals of Pachyrhynchus. This broader taxon-sampling approach might improve the accuracy of phylogenetic inference (Heath et al. 2008). Nevertheless, the use of taxon-specific baits in future studies can enhance its precision further (Baca et al. 2017).
Conclusion
Our research provides insights into the potential mechanisms underlying the diversification of patterns in Pachyrhynchus weevils. The patterns in these weevils evolve through distinct evolutionary processes, rather than through random changes, suggesting an association with adaptive evolution. Frequent transitions between patterns indicate a potential for rapid evolutionary changes in patterns among closely related species. In comparison to the patternless form, patterned forms are more likely to provide adaptive benefits. Additionally, the correlation between patterns and geographical distribution further supports convergent evolution among these weevils. However, our results indicate that pattern diversification is unlikely to be the primary driver of speciation events. Instead, we propose that selection pressures across geographical regions, combined with frequent pattern transitions, might play key roles in shaping the pattern diversification in Pachyrhynchus weevils. Further research is necessary to clarify the exact mechanisms responsible for pattern evolution.
Acknowledgements
We appreciate the contribution of Hilario Cahilog, Dr Wen-San Huang, Dr Ming-Luen Jeng, Dr Jing-Fu Tsai, Dr Chung-Ping Lin, Yu-Tang Wang, Tsan-Lung Chen, Chih-Yuan Chang, Dr Ju-Po Kao, Dr Li-Wei Wu, Dr Yu-Feng Hsu, and Pin-Chen Chen for the assistance with fieldwork. We also thank Chun-Yi Hsiao and Yu-Yun Kao in Technology Commons, College of Life Science, National Taiwan University, Dr Yu-Hsin Tseng, and Wei-Yun Chen for their technical guidance in molecular experiments and analyses, in addition to technological support from National Taiwan University High Performance Computing. We are also grateful to Dr Maurizio Bollino and Yun Ho for species identification and to Bin-Hong Ho for providing specimens and photographs. Additional appreciation goes to Chi-Cheng Chiu and Yi Sun for the valuable advice on the analyses presented in this paper. Finally, we sincerely thank Dr. Justin Bernstein and the anonymous reviewer for their invaluable comments and constructive feedback, which have greatly improved the quality of this manuscript.
Conflict of interest
None declared.
Funding
This work was supported by National Science and Technology Council, Taiwan (MOST 111-2313-B-002-047 and NSTC 112-2621-B-002-003-MY3) to H.-Y. T.
Data availability
UCE sequences are available in GenBank at: https://dataview.ncbi.nlm.nih.gov/object/PRJNA1099439?reviewer=k7ne040au01c0ahvdmdh79i6hp. Data and supplementary information are available in Dryad (DOI: 10.5061/dryad.0vt4b8h5b https://datadryad.org/stash/share/GNYcnvpNuO0iyOzXf-PWuz6VxFqyLMxv2XdAnUachVk).
