


Abstract
The global prevalence of the XBB lineage presents a formidable challenge posed by the recombinant SARS-CoV-2 virus. The understanding of SARS-CoV-2’s recombination preference assumes utmost significance in predicting future recombinant variants and adequately preparing for subsequent pandemics. Thus, an urgent need arises to establish a comprehensive landscape concerning SARS-CoV-2 recombinants worldwide and elucidate their evolutionary mechanisms. However, the initial step, involving the detection of potential recombinants from a vast pool of over 10 million sequences, presents a significant obstacle. In this study, we present CovRecomb, a lightweight methodology specifically designed to effectively identify and dissect interlineage SARS-CoV-2 recombinants. Leveraging CovRecomb, we successfully detected 135,567 putative recombinants across the entirety of 14.5 million accessed SARS-CoV-2 genomes. These putative recombinants could be classified into 1451 distinct recombination events, of which 206 demonstrated transmission spanning multiple countries, continents, or globally. Hotspot regions were identified in six specific areas, with prominence observed in the latter halves of the N-terminal domain and receptor-binding domain within the spike (S) gene. Epidemiological investigations revealed extensive recombination events occurring among different SARS-CoV-2 (sub)lineages, independent of lineage prevalence frequencies.
Introduction
Viral recombination, along with segment insertion or deletion and site mutation, is a major cause of viral genetic diversity (Makino et al. 1986, Su et al. 2016, Bentley and Evans 2018). Previous studies have demonstrated pervasive recombination in coronaviruses (CoVs) and showed its important roles in viral adaptability (Xiao et al. 2016), cross-species transmission (Graham and Baric 2010, Jackwood et al. 2010), and resistance to antivirals (Nora et al. 2007). For the global pandemic severe acute respiratory syndrome coronavirus-2 (SARS-CoV-2), lineage cocirculation provides a background for recombination generation, and recombination has become a key contributor to SARS-CoV-2 genetic evolution (Yue et al. 2023). As of 5 April 2023, over 70 recombinant lineages starting with “X” have been assigned online (Roemer et al. 2022). Among them, the SARS-CoV-2 Omicron recombinant subvariant XBB and its sublineages have expanded rapidly and become predominant worldwide. Therefore, three critical questions await to be answered. The first is whether there were any other recombinants and transmission events that have not been reported. The second is whether there are any established mechanisms during virus recombination. The last is whether it is possible to provide early warning of the highly transmitted recombinant lineages that may emerge in the future.
In theory, the dense sampling and genomic sequencing efforts targeting SARS-CoV-2 worldwide present an ideal opportunity to detect and monitor recombination events during the COVID-19 pandemic. Nevertheless, due to the high similarity between various SARS-CoV-2 lineages and the vast volume of accumulated data, accurately identifying SARS-CoV-2 recombination events poses a formidable challenge. Robust evidence of SARS-CoV-2 recombinants only surfaced in late 2020 (Gutierrez et al. 2022, Jackson et al. 2021, Junior et al. 2021, Turakhia et al. 2022), when tens of single nucleotide polymorphisms (SNPs) accumulated, providing a potential anchor for identifying feature mutations of different lineages in one genome. Traditional detection methods relied on sequence alignment for inferring recombination and identify breakpoints (Lole et al. 1999, Etherington et al. 2005, Jackwood et al. 2010, Lam et al. 2018). However, the classical approach faltered under the weighty computational burden imposed by the expansive datasets characterizing SARS-CoV-2. Recently, novel approaches have been proposed, including Bolotie (Varabyou et al. 2021), RIPPLES (Turakhia et al. 2022) [which has now integrated into the rivet platform (Smith et al. 2023)], VirusRecom (Zhou et al. 2023), recombinhunt (Alfonsi et al. 2024), and the Sc2rf method (which has now evolved into the rebar method) for consensus genome, or the method used by Pipek et al. for raw read datasets (Pipek et al. 2024). However, the utility of these methods was constrained by two objective limitations. First, during the development of these techniques, the absence of a benchmark dataset impeded precise evaluation of the reliability of the identified recombinants. Second, few methods were capable of distinguishing between detected recombinants as independent recombination events or descendants thereof. Consequently, most of these approaches have not been applied to the comprehensive global datasets required to portray a comprehensive landscape of SARS-CoV-2 recombination since the onset of the pandemic. Even to this day, no appropriate methodology has been devised to simultaneously address the above limitations.
To surmount these challenges, we propose a method termed CovRecomb for detecting SARS-CoV-2 recombination. The fundamental principle underlying CovRecomb resides in the notion that recombinant strains inherit the genome features from their parental lineages (Fig. 1a). Accordingly, leveraging viral lineage-specific feature mutations as the indicators, we employed the hypergeometric distribution algorithm to assess the nonrandomness of the origin of these feature mutations arising from genomic recombination. Using CovRecomb to scrutinize 14,555,061 consensus sequences from the Global Initiative on Sharing All Influenza Data (GISAID) database (Elbe and Buckland-Merrett 2017), we successfully identified 135,567 putative recombinants, which were subsequently clustered into 1451 independent events. CovRecomb systematically detected half of the manually curated recombinants, which have been reported with variability in criteria and methodology across different sources (https://github.com/cov-lineages/pango-designation/issues, accessed date: Mar 10, 2023). The comprehensive identification of recombination provided a promising opportunity to investigate the following three prospects of recombination patterns: tracing the transmission of recombinants, inferring recombination breakpoint hotspots, and determining lineage preference in recombination (Fig. 1a), thereby enhancing our understanding of SARS-CoV-2 evolution.
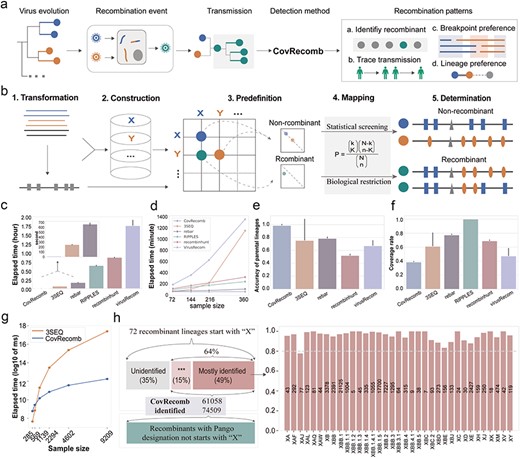
The framework and performance of the CovRecomb method. (a) Graphical illustration of the application of the CovRecomb method. (b) Schematic diagram of the framework of the CovRecomb method. (c) Comparison of the elapsed time of five recombination detection methods in identifying 72 sequences from 72 kinds of recombination lineages. The time was averaged from five independent trials, and the bars represent the standard deviation. (d) Comparison of the elapsed time of the CovRecomb, 3SEQ, rebar, RIPPLES, recombinhunt, and VirusRecom methods for different sample sizes. (e) Comparison of the accuracy of parental lineages for identified recombinants among the CovRecomb, 3SEQ, rebar, recombinhunt, and VirusRecom methods. The value is averaged from five independent trials and the bars represent the standard deviation. The reason for not comparing the accuracy of the RIPPLES method is that RIPPLES identifies recombinant parental nodes rather than lineages, making a direct comparison with other methods in the study unfair. (f) Comparison of the coverage rate for a given number of recombinants among the CovRecomb, 3SEQ, rebar, RIPPLES, recombinhunt, and VirusRecom methods. The value is averaged from five independent trials and the bars represent the standard deviation. (g) Comparison of the elapsed time of the CovRecomb (blue) and 3SEQ (orange) methods. The time is averaged from five independent trials and measured using the log10 transformed millisecond. (h) Evaluation of CovRecomb in manually curated SARS-CoV-2 recombinant lineages. There were 72 kinds of recombinant lineages that started with “X” and were enrolled in the analysis; 35 kinds could be mostly (≥77% genome) identified, and 11 kinds could be preliminarily (0–22% genome) identified. The x-axis of the right bar chart is the 35 most identified recombinant lineages, the y-axis represents the identified proportion, and the text on each bar shows the number of genomes identified by CovRecomb. ***: Preliminary identified.
Results
Overview of the CovRecomb method for detecting interlineage recombinants
To mitigate the computational burden associated with conventional recombination detection methods, we used sequential feature mutations as a simplified representation of the viral genome, condensing it into a limited number of positions. Consequently, the task of identifying recombinants shifted from genomic comparisons to the assignment of feature mutations (see Methods for more details). The CovRecomb method encompassed five steps within its workflow (Fig. 1b and Supplementary S1): (i) transforming the complete genome into the mutational sites; (ii) constructing a lineage-defining library to capture the genomic characteristics of viral (sub)lineages; (iii) predefining a lineage-paired score matrix (LPSM) to encompass diverse combinations of lineage-paired feature mutations; (iv) mapping the mutation vector of the sample against the predefined LPSM; and (v) determining whether a genome qualifies as a recombinant based on the optimal lineage-paired combination.
To evaluate the performance of CovRecomb, we compared it to other recombination detection methods on both real and simulated datasets. On the one hand, across the randomly sampled real sequences from 72 recombination lineages, which were sequences denoted with “X” from manually designated SARS-CoV-2 recombinant lineages, different methods exhibited varying computational costs, from <30 s for CovRecomb to nearly 2 h for VirusRecom (Fig. 1c). The remaining three methods, 3SEQ, rebar, RIPPLES, and recombinhunt required ∼4 min, 11 min, 42 min, and 58 min, respectively (Fig. 1c). Besides, while CovRecomb, rebar, RIPPLES, and recombinhunt exhibited a gradual increase in computational time as the sample size expanded, 3SEQ and VirusRecom demonstrated considerably steeper growth trends (Fig. 1d). Notably, CovRecomb demonstrated the highest performance in terms of accuracy of parental lineages but yielded the lowest coverage rate (Fig. 1e–f). Since the RIPPLES methodology does not provide the direct parental lineages of the identified recombinant, it was not incorporated in the comparison of the accuracy of parental lineages. On the other hand, by employing a forward-evolution simulator, simulated virus datasets were generated and used for the comparison between CovRecomb and a representative general method, 3SEQ (Supplementary Fig. S2 and Table S1, see Methods). The compared results were similar to that from real datasets. As the number of genomes increased, particularly when more than 1000 genomes, the elapsed time required for CovRecomb was significantly less than that of 3SEQ (Fig. 1g). Additionally, the CovRecomb exhibited superior accuracy compared to 3SEQ while its true positive rates (TPRs) were 30% lower than 3SEQ. Moreover, the false positive rate (FPR) and the false discovery rate (FDR) for the CovRecomb method were nearly negligible (Supplementary Table S1). All these indicated that although the recall of CovRecomb did not match that of 3SEQ, it still achieved an acceptable recall rate of approximately 60% in simulation datasets. Most importantly, CovRecomb obtained a low false positive performance for recombinant identification and exhibited high precision in assigning parental lineage, which is important for the evaluation of recombination mechanism.
By varying the number of consecutive feature mutations from one to four, we found that, when the number increased to four, the actual parameter used in real detection process, the FDR and the FPR of CovRecomb were nearly to be zero (Supplementary Fig. S3a-b). Besides, apart from the random mutations (Supplementary Fig. S3c), we added homologous mutations into simulated datasets and found that the FDR, FPR, and TPR of CovRecomb were not substantially influenced by the number of homologous mutations in sequences (Supplementary Fig. S3d-f) but were related to the proportion of sequences with homologous mutations (Supplementary Fig. S3g-i). Lastly, when applied to the Middle East Respiratory Syndrome (MERS) dataset, CovRecomb successfully identified all the 45 recombination sequences along with the 98% (44 out of 45) accuracy of the parental lineages’ assignment. In total, the precision of CovRecomb in MERS dataset is 0.88 (Supplementary Table S2).
Employing CovRecomb in all SARS-CoV-2 datasets, 49% of the acknowledged SARS-CoV-2 recombinant lineages, which were denoted lineages starting with “X” (Roemer et al.) were predominantly detected (at least 77%) at one instance, while 15% of lineages were preliminarily identified (less than 22%) (Fig. 1h, Supplementary Table S3). Furthermore, we compared the manually curated parental lineages online and the parental lineages reported by CovRecomb. The results demonstrated a consistent alignment for 33 out of 35 (94%) lineages, with only two recombinant lineages (XBC and XBC.2) displaying variations (Supplementary Table S3). Overall, the remarkable precision in identifying recombinant entities assumes critical import in the deduction of recombination mechanisms within the vast SARS-CoV-2 data landscape. CovRecomb showcased a salutary equilibrium between recall and precision, affording superior performance outcomes upon the application to extensive datasets.
Identification of putative SARS-CoV-2 recombinants and independent recombination events
In total, 14,555,061 SARS-CoV-2 consensus genomic sequences released from 24 December 2019 to 29 January 2023 were enrolled for recombination analysis with CovRecomb (Fig. 2a). The analysis process was executed on a normal personal computer equipped with an AMD Ryzen 9 5900X 12-Core Processor and 128 GB memory, accomplishing completion within a span of 120 h employing 20 threads. In total, 135,567 putative recombinant sequences were identified (https://github.com/wuaipinglab/CovRecomb/blob/main/CovRecomb-Global-Version/putative_recombinants/putative%20recombinants.csv). The spatiotemporal distribution showed that most recombinants were identified from North America and Europe after June 2022 (Supplementary Fig. S4). To ascertain the independence of these recombination events, they were subjected to the scrutiny of three predefined rules (see Methods), ultimately culminating in the identification of 1451 independent recombination events (Fig. 2a, Supplementary Table S4). Intriguingly, a subset of 106 events was designated as belonging to the “X” series events (Supplementary Table S4). According to the confidence values (Supplementary Fig. S5a), the probability density distribution curves of the confidence value for recombination events were like a bimodal curve shape, and the distribution of the other putative recombinant events was similar to that of the “X” series recombinant events, although the former had more dispersed values (Supplementary Fig. S5b-e). Since the lower quartile for “X” series recombinant events was 0.681 (Supplementary Fig. S5b), we took it as the cut-off and divided the 1451 events into the higher confidence group with 939 events and the lower confidence group with 512 events, with 104 and 102 transmission events, respectively (Fig. 2a, Supplementary Table S4).
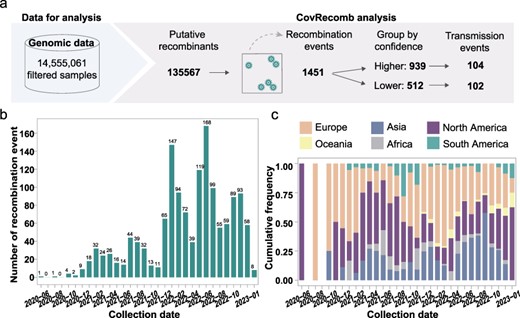
Application of CovRecomb in the detection of SARS-CoV-2 recombinants in a large-scale dataset. (a) Workflow of applying CovRecomb to detect and dissect SARS-CoV-2 recombinants. (b) The temporal distribution of the 939 independent recombination events with higher confidence. Each bar represents the number of identified events in each month. (c) The spatial distribution of the 939 ancient-like recombinants. The y-axis represents the proportion of recombinants among different regions during the same month.
Among the 939 events exhibiting higher confidence, the first recombination event occurred in the USA during June 2020, although it did not cause detected endemic (Supplementary Table S4). Subsequently, the number of recombination events demonstrated a consistent annual increase from 2020 through 2022 (Fig. 2b). An examination of the spatiotemporal distribution showcased the ubiquitous occurrence of SARS-CoV-2 recombination across six continents, with North America, Europe, and Asia encompassing the highest number of identified putative recombination events (Fig. 2c). As these recombination events exhibited clustering based on their similar mutations and spatiotemporal distribution, we surmised the existence of a plausible transmission relationship within each putative recombinant event.
To demonstrate the sustained analytical capability of the CovRecomb method, we performed an updated analysis using SARS-CoV-2 sequences collected from the GISAID database between 30 January 2023 and 23 June 2024 (Supplementary Fig. S6a). After applying our established filtering criteria, we retained 1,053,388 high-quality sequences out of 1,252,950 initial samples. Using the CovRecomb method on this new dataset, we identified 3844 recombinant sequences (Supplementary Fig. S6b-c, Table S5) arising from 123 independent recombination events, leading to at least 35 new transmission events (Supplementary Fig. S6d-e, Table S6). The analysis of the updated data reveals that the number of independent recombination events exhibits temporal fluctuations. Specifically, in 2023, recombinant events were predominantly concentrated between June and December. Compared to the same period in 2022, the number of recombinant events in 2023 was lower. The overall recombination rate in this updated dataset is 0.36%, which is in line with the co-infection rates reported by Pipek et al. (0.35%) and Zhou et al. (0.3%–0.5%) but shows a decrease from the 0.93% rate observed in our earlier dataset (Zhou et al. 2022, Pipek et al. 2024). This reduction is likely due to decreased sampling density in 2023. Geographically, recombinant sequences continue to be distributed across six continents, with Europe and North America remaining the primary regions of detection. Both continents have alternated as the leading sources of independent recombinant events, while Asia remains the third-largest source. Notably, among the recombinant events, the XDD lineage was the most frequently observed, accounting for 10.6% of independent events. CovRecomb identified its parental lineages as HK.3 (XBB.1.9.2.5.1.1.3) and JN.1, featuring two breakpoints. This finding aligns with the pango-designated EG.5.1.1 (XBB.1.9.2.5.1.1) and JN.1. Additionally, the recombination event between GJ.1.1 and XBB.2.3, exhibiting two breakpoints within the spike region, was first detected in India and later also collected in the USA, Italy, Australia, and Japan, marking it as a previously unreported event.
Evidence for transmission of SARS-CoV-2 recombinants
In total, a comprehensive examination of the dataset yielded a remarkable count of 206 putative recombinants displaying evidence of onward transmission (see Methods). Upon sorting these recombinants based on the number of transmitted genomes, it was revealed that the two most prominent pandemic recombination events encompassed the recombination of lineage BJ.1 with lineage BM.1.1.1, which had already been classified into the XBB.1 and XBB.2 series recombinant events, with 35,250 and 15,191 genomes, respectively (Supplementary Table S4). Among the 104 transmission events exhibiting higher confidence, 31 belonged to the “X” series, including lineage XA transmitted in the UK (Gutierrez et al. 2022), lineage XB in the USA and Mexico (Gutierrez et al. 2022), lineage XC in Japan (Sekizuka et al. 2022), and others (XD, XE, XH, XJ, XK, XM, XY, XAF, XAJ, XAW, XBB.1, XBB.1.5, XBB.3, XBD, XBE, and XBJ) (Supplementary Table S4). Among the remaining 73 transmission events, it was observed that 11 events were confined within a single country, while the other 62 events experienced varying degrees of intercontinental or global transmission.
Therefore, as an illustrative example, we selected a recombinant event characterized by high confidence to illustrate the transmission pattern of a novel recombinant lineage. To the best of our knowledge, it is an interlineage recombination event that has never been reported before, involving a dataset of 162 sequenced genomes (Supplementary Table S4). Firstly, through a comparative analysis between the earliest recombinant genome (hCoV-19/Belgium/rega-18 342/2021) and the feature mutations of its parental lineages, it was ascertained that its 5′-terminus (at least 897-17 790 nt) potentially inherited from the lineage AY.123.1, while the 3′-terminus (at least 21 846-24 410 nt) was inherited from the lineage AY.4.2. This analysis can be visualized through nucleotide variation with respect to the reference sequence (EPI_ISL_402125, gray genome, far bottom) for the first sampled recombinant sequence (hCoV-19/Belgium/rega-18 342/2021) and its parental AY.123.1 (top colored genome) and AY.4.2 (bottom colored genome) lineages composed of their respective feature mutations (Fig. 3a). Secondly, a spatiotemporal examination of the 162 sequenced genomes unveiled the initial observation in Belgium on 13 October 2021, followed by subsequent dissemination to 10 other European countries (Fig. 3b). Notably, based on the ancestral state reconstruction analysis, it was evident that Belgium, Denmark, France, the Netherlands, and the UK exhibited both imports and exports of the recombinant lineage, while Germany, Luxembourg, Spain, Poland, and Sweden solely reported case imports (Fig. 3b). Furthermore, similar to the temporal distribution of the XA lineage transmitted in England (Gutierrez et al. 2022), the transmission of this event persisted at a low frequency for 3 weeks before a small-scale expansion emerged in the sixth week and then subside again in the eighth week. After that, the epidemic gradually waned and concluded in the 13th week (Fig. 3c). Finally, the phylogenetic tree effectively illustrated the molecular distance between the 162 recombinants during transmission, emphasizing the occurrence of a relatively independent process of virus evolution when a recombinant genome infiltrates a new geographic location, as observed in the UK (Fig. 3d).
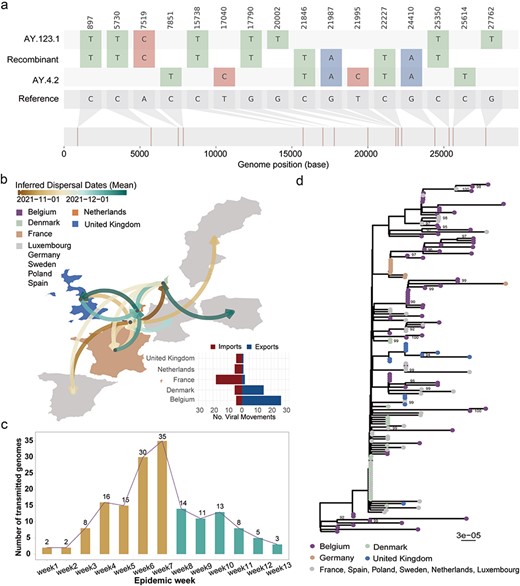
A novel interlineage recombinant transmitted across 10 European countries. (a) The mosaic plot of a representative recombinant event. (b) The spatiotemporal dispersal pattern of the interlineage recombination event. The dissemination and source‒sink dynamics aggregated in 10 European countries for the recombination event determined from ancestral state reconstruction analysis. The arrows denote the direction of virus movement, and the curves linking any two locations are colored according to the mean dates of all viral movements inferred along this route. The absolute numbers of importation and exportation events for each country are shown in a horizontal bar chart. The five countries with bright colors on the map represent the countries with simultaneous virus imports and exports, while the other five countries colored gray on the map represent only virus imports. (c) The temporal distribution of the 162 transmitted recombinant sequences. The brown and green bars represent those recombinants sampled in the growth or reduction state of transmission, respectively. (d) Phylogenetic tree constructed based on the 162 recombinant sequences originating from recombination events between lineage AY.123.1 and lineage AY.4.2. Branches with bootstrap values of more than 90% are labeled by their absolute value.
Inference of breakpoint hotspots for SARS-CoV-2 recombination
From a qualitative standpoint, the genome mosaic structure for the 104 independently transmitted recombinants suggests that the recombination breakpoints were distributed throughout the entirety of the SARS-CoV-2 genome (Fig. 4a). To delve into a quantitative examination, we meticulously calculated the likelihood of each site to become a potential breakpoint for the 939 events displaying higher confidence (Fig. 4b-c), as well as the 512 events with comparatively lower confidence (Supplementary Fig. S7). By plotting density curves, meticulously generated according to our prescribed methods, a discernible trend emerged, indicating a distinct preference for breakpoint hotspots in the 3′ region of the SARS-CoV-2 genome (Fig. 4b). Notably, these hotspots were concentrated within almost contiguous regions spanning from 19 023 to 26 732 nt, which encompassed genes such as ORF1b, spike, ORF3 (NS3) and envelope (E) genes (Fig. 4b). Intriguingly, substantial fluctuations in breakpoint density were observed within the spike genome itself (Fig. 4b, Supplementary Fig. S7a). Delving deeper into the analysis, specific attention was directed toward the spike protein, where breakpoint density plots clearly illustrated distinct characteristics. It was apparent that the first halves of the N-terminal domain (NTD) region (21 563-22 031 nt) and the receptor-binding domain (RBD) region (22 601-22 987 nt) were the cold regions, while the second halves of the NTD and RBD (22 093-22 061 nt, 22 987-23 188 nt) seem to be the hotspots (Fig. 4c, Supplementary Fig. S7b).
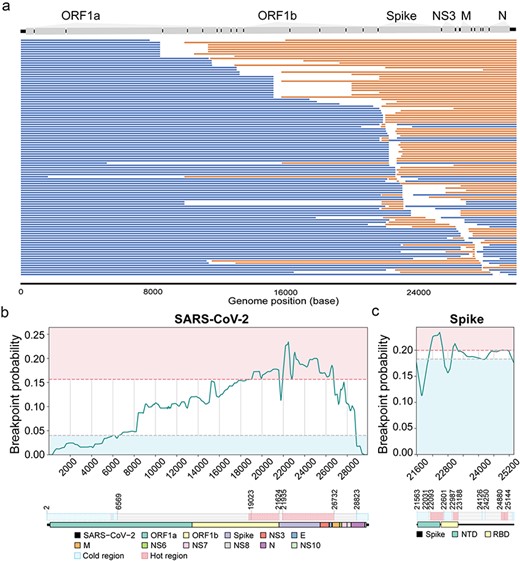
Mosaic genome structures and recombination hotspots for SARS-CoV-2 recombinants. (a) The mosaic genome structures of 104 independent recombination events with high confidence and transmission display inferred parental lineage mutations, blue segments near the 5’ terminus, orange segments elsewhere, ambiguous gaps for potential recombination breakpoints, and genomic compositions noted at the top. (b and c) Identification of the recombination hotspots for 939 independent recombinant events with higher confidence. The density curve of breakpoint probability among the whole genome (b) or the spike gene (c) of SARS-CoV-2. The y-axis represents the probability for each site to be a breakpoint among the 939 recombinants. Areas of breakpoint hotspots are colored red, and coldspots are colored blue. At the bottom, hotspots of the whole genome (left) or the spike gene (right) are shown and annotated against the encoded proteins.
Preference characteristics of the epidemiology and lineages associated with SARS-CoV-2 recombination
A common phenomenon was that a widely circulating lineage provided more opportunities for viral recombination (Su et al. 2016). To shed light on the intricate relationship between epidemiology and recombination dynamics, we plotted the epidemiological frequencies of two parental lineages associated with each independent recombination event (see Methods). Among the 939 events exhibiting high confidence, only 472 of them had simultaneously sampling of both parental lineages, unearthing a dispersed distribution of epidemiological frequencies for the paired parental lineages (Fig. 5a). While certain instances displayed a dominant parental lineage in terms of epidemiological frequency, a substantial number of recombinants originated from two nondominant parental lineages (Fig. 5a). It is worth noting that the epidemiological frequencies of the parental lineages encompassed a wide range of values (Fig. 5b). Approximately 16% of the recombinants (83/520) exhibited cumulative frequencies exceeding 50% for their parental lineages, while nearly 51% of recombinants (283/520) demonstrated cumulative frequencies below 10% (Fig. 5b, Supplementary Table S7).
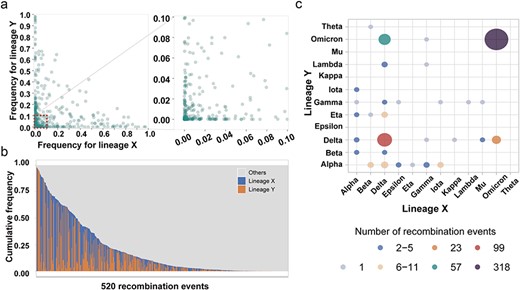
The epidemiological and lineage preference characteristics of SARS-CoV-2 recombination. (a) Scatter diagram of the epidemic frequency for parental lineage X and lineage Y among 520 independent SARS-CoV-2 recombinants derived from the 939 events with high confidence. (b) Cumulative frequency of lineages in geographic regions of each recombinant. The tracts near the 5′-terminus of the SARS-CoV-2 genome from lineage X are shown in blue, while the tracts from lineage Y are shown in orange. All 520 recombinants are sorted from left to right according to the cumulative frequencies of lineages X and Y. (c) Simplified diagram for lineage preference in recombination among VOC and VOI variants. The number of independent recombinants with the same parental lineages is represented by the color and size of intersections.
Moreover, in our pursuit to investigate potential preferences for recombination between specific lineage pairs, we constructed informative heatmaps showcasing the lineage-paired recombination events (Fig. 5c and Supplementary S8). Intriguingly, lineages associated with the Omicron variant or the Delta variant showcased a heightened inclination for participating in recombination events, regardless of whether the recombination occurred within the same variant or between different variants (Fig. 5c). In addition, by comparing the preserved genomic fragments of each variant within the recombinants, we discovered different tendencies. Specifically, the Delta, Epsilon, Iota, and Mu variants exhibited a predilection for retaining the 5′ region of the SARS-CoV-2 genomes, while the Alpha, Eta, Lambda, and Omicron variants displayed a tendency to retain the 3′ region (Fig. 5c).
Discussion
The hypergeometric distribution, commonly utilized as a discrete probability distribution, finds application in assessing the likelihood of annotating a Gene Ontology (GO) term on a set of genes with a frequency exceeding chance expectations (Boyle et al. 2004, Rivals et al. 2007). In this study, we introduced this statistical methodology to aid in the identification of candidate recombinants in virus genomes. Within the CovRecomb method, we compare the feature mutations of a lineage pair to a GO term, treating the sample’s mutation as a gene set awaiting annotation. The mapping process involved sampling mutations from an LPSM library without replacement. Consequently, the enrichment score for the sample’s mutations derived from the feature mutations of a lineage pair can be quantitatively assessed by the hypergeometric distribution. If the calculated probability (P value) for a recombinant lineage pair fell sufficiently below that of all lineage pairs, and the Bonferroni-corrected P value was significant, it could be inferred that the sample’s mutations likely originated from the given lineage pair. Compared to sequence alignment, the hypergeometric test provides an efficient means to preliminarily screen candidate recombinants from a statistical aspect; however, for a complex biological process like recombination, additional biological rules are necessary to ensure the accuracy of the identified results from a biological aspect.
In the context of virus genome recombination, the offspring strain inherits genome’s segments from its parental lineages. Hence, we regarded feature mutation combinations across genomes as “anchors” for capturing recombination events. We hypothesized that the synergistic occurrence of multiple mutations associated with a specific lineage was not accidental, particularly for mutations within a contiguous region. Thus, in CovRecomb, we incorporated genome positions and assessed recombinants based on the combinations of feature mutations rather than a single mutation, requiring the inclusion of at least four continuous feature mutations within each recombined segment. Moreover, to mitigate statistical bias stemming from the statistical advantage of lineages with fewer mutations, we stipulated that the feature mutation combination from parental lineages should be distinct and not completely present in the feature mutation list of the most likely nonrecombinant lineage. These additional measures not only address the limitations of statistical analysis but also aid in distinguishing recombination signals from nonrecombinant homoplasy, where the latter refers to mutation(s) resulting from convergent evolution or spontaneous substitutions (Crispell et al. 2019).
CovRecomb shares similarities with existing tools in terms of the principle underlying recombination identification, i.e. relying on feature mutations and considering fragments with similar mutation patterns from different lineages as the recombination regions. However, CovRecomb exhibits several irreplaceable advantages. Firstly, the incorporation of the hypergeometric distribution test streamlines the screening of the candidate recombinants and parental lineages assignment in a rapid and batch-wise manner, addressing the challenge of identifying millions of sequences. Secondly, the implementation of biological rules allows for the differentiation of ancient-like recombinant from transmitted genomes, such as considering the accumulation rate of de novo mutations, thus facilitating the dissection of the molecular mechanisms underlying recombination events while minimizing the impact of redundant transmitted sequences. Finally, during the development of CovRecomb, over 70 recombinant lineages were reported in a scattered or small-scale manner and manually confirmed, providing a benchmark dataset for CovRecomb, enabling quantitative evaluation of its performance.
In comparison to other recombination detection methods, the CovRecomb method exhibited unique advantages. Its computational efficiency makes it well-suited for working with the vast amount of viral genome data (Fig. 1c, d, h). Furthermore, the high precision achieved in assigning parental lineages to the identified recombinants serves as evidence for the robustness of our method (Fig. 1e and Supplementary Tables S3). Additionally, the consistent performance of CovRecomb in simulated datasets and in MERS dataset suggests its potential applicability to viruses other than SARS-CoV-2 (Supplementary Table S2). However, CovRecomb does not perform as well in terms of recall, as it has a lower coverage rate compared to other recombination detection methods (Fig. 1f and Supplementary Table S1). Overall, CovRecomb sacrificed recall rate in favor of a low FPR for recombination and achieves high precision in parental lineage assignment. It provides a reliable and efficient strategy for detecting interlineage recombinants from a comprehensive perspective, aiding in the construction of a global SARS-CoV-2 recombination landscape.
Our analysis of SARS-CoV-2 recombination events across continents revealed a significant positive correlation (P < .05) between sampling density and identified recombinants (Supplementary Fig. S9a, b, d, e), highlighting the importance of comprehensive sampling for accurate detection. We observed variations in recombination rates among continents (Supplementary Fig. S9b, c, e), potentially influenced by factors, such as detection capabilities, viral prevalence, population dynamics, and public health measures. The steady increase in recombination rates over time suggests the growing significance of this mechanism in viral evolution. Additionally, we found a significant correlation between co-infection and recombination rates (P < .05) (Supplementary Figure S9f), emphasizing the need for co-infection monitoring. These findings provide valuable insights into SARS-CoV-2 recombination dynamics and inform future surveillance strategies. Further research is needed to understand the factors driving geographical variations in recombination rates and their impact on viral evolution and epidemic progression. For the detailed analysis process and results, see Supplementary Text 4.
To date, the most prevalent interlineage recombination for SARS-CoV-2 is the XBB strain and its sublineages, which have infected hundreds of thousands of people worldwide (WHO 2023). Some other recombinant lineages have also led to community transmissions at the population level (Gutierrez et al. 2022, Lindh et al. 2022, Roemer et al. 2022, Sekizuka et al. 2022). However, most of these instances were sporadic reports manually screened by researchers and/or proposed in online issues (https://github.com/cov-lineages/pango-designation/issues, accessed date: Mar 10, 2023). Here, CovRecomb enables automatic and comprehensive recombinant detection and transmission tracking. The identification of the detected 135,567 recombinants can be deemed reliable to a certain extent, as 45% of them were already confirmed. However, we maintain a cautious approach when classifying independent recombination events. This caution arises from the principle we employed to distinguish the ancient-like genomes from their offspring, which relies on a priori average evolutionary rate of SARS-CoV-2. If recombinants accumulate mutations at an exceptionally rapid evolutionary rate or involve events with widespread global transmission, CovRecomb may partition them into two or more independent events, as observed for multiple events associated with XBB and its sublineages (Supplementary Table S4). Nevertheless, more than half of the recombinant lineages cluster into only one or two events, indicating the high accuracy of our results. Additionally, we provide a detailed demonstration of the regional transmission history and genomic evolutionary process for a previously unreported recombinant transmission event between the lineages AY.123.1 and AY.4.2. Thus, the CovRecomb method can facilitate the monitoring recombinant transmission by constructing a systematic virus recombinant map for the global pandemic. Furthermore, we assign a confidence score to each recombination event and selected those with higher confidence to dissect the following dissected recombination patterns, enhancing the credibility of our results.
Breakpoints constitute a significant characteristic of recombination and have been implicated in positive or negative selection of recombination events, varying across genomes in response to adaptation (Focosi and Maggi 2022). In this study, we observed recombination hotspots near the 5′ region of the spike gene, consistent with a large-scale bioinformatic study on SARS-CoV-2 recombinant detection (Turakhia et al. 2022), as well as multiple independent studies on coronavirus genomes (Bobay et al. 2020, Goldstein et al. 2022, Lytras et al. 2022, Nikolaidis et al. 2022). Moreover, we noted a reduced probability of breakpoints occurring in the first half of the NTD and RBD regions (Fig. 4c). Intriguingly, the less-break pattern for the two regions has also been identified as coldspots in sarbecovirus-related recombinant strains (Lytras et al. 2022). We postulate that the preservation of these two regions might be correlated with their critical role in driving antigenic shift and interfacing with viral receptors (Graham and Baric 2010, MacLean et al. 2021). However, different patterns emerge for the latter half of these two genes, and one possible explanation is the presence of XBB-related recombinant lineages. Since the single breakpoint occurs in the middle of the RBD region (Scarpa et al. 2023), the XBB genome inherits the RBD mutations from both parental lineages, suggesting a potential advantage in the RBD protein, which partially explains the relatively high antibody escape capacity and enhanced transmissibility observed in the XBB recombinant lineage (Roemer et al. 2022, Cao et al. 2023, Wang et al. 2023, Yue et al. 2023). Besides the spike gene, we also identified a concentration of breakpoints in the ORF1b ( NSP15 and NSP16 region) , ORF3, and E genes, as observed in the breakpoint distribution map of Omicron-related recombinants (Shiraz and Tripathi 2023). Additionally, we detected NSP14 as a hotspot, which has received less attention previously. Considering the crucial roles of the NSP14 exonuclease in native coronavirus recombination (Gribble et al. 2021), it is intriguing to investigate the impact of breakpoint on its functionality.
The occurrence of recombination depends on the cocirculation of at least two viral (sub)lineages in the same geographic region (Gutierrez et al. 2022). It is assumed that viral lineages more prevalent in a region are more likely to engage in recombination. As expected, our findings confirm that dominant lineages contribute to SARS-CoV-2 recombination. However, we also observed that lineages associated with fewer epidemics can serve as parental lineages, constituting a significant proportion (Fig. 5a-b). This unexpected discovery implies that there is no strong correlation between lineage prevalence and recombination events. In other words, surveillance of SARS-CoV-2 recombinants should not only focus on dominant lineages but also consider nondominant lineages, thereby preventing the “late discovery” of recombinants, as occurred in the case of lineages XB and XBB, associated with the nondominant parental lineage pairs B.1.631-B.1.634 (Gutierrez et al. 2022) and BJ.1-BM.1.1.1 (Scarpa et al. 2023), respectively. Another important issue is to analysis of preserved proteins for each lineage, which reflects their competitive nature (Focosi and Maggi 2022). Similar to previously reported transmitted recombinants with higher transmissibility associated with the spike gene (Gutierrez et al. 2022), we also identified a preference for preserving the 3′-terminus of the alpha variant genome. In addition, we provide information on the preferentially preserved genome for other variants of concern (VOCs)/variants of interest (VOIs) through lineage-pair mapping.
Our analysis of 154 pairs of parental lineages revealed no significant correlation between sequence similarity and recombination frequency (Supplementary Fig. S10), challenging the theoretical assumption that higher sequence similarity facilitates recombination. However, this finding must be interpreted cautiously due to the inherent limitations of current recombination detection methods. Most recombination search algorithms, including CovRecomb, rely heavily on identifying mutations to detect recombination events. This mutation-dependent approach may create a bias, potentially causing an overlap between mutation hotspots and frequently detected recombination regions. Consequently, it remains unclear whether the currently identified recombination hotspots represent genuine biological phenomena or are artifacts of the detection method’s limitations. This uncertainty highlights a critical gap in our understanding: we cannot conclusively determine if the observed recombination patterns reflect true biological processes or are byproducts of our detection methodologies. To address this issue, it is imperative to develop novel approaches for recombination detection that are less dependent on specific mutations or that adopt a more holistic, genome-wide perspective. Such advancements would enable a more accurate assessment of recombination events in SARS-CoV-2 and provide deeper insights into the virus’s evolutionary dynamics.
This study has certain limitations. Firstly, it could miss some recombinants due to the conservative criteria employed by CovRecomb, which here prioritizes precision over recall. While CovRecomb demonstrates high precision in identifying SARS-CoV-2 recombinants, we acknowledge its current limitation in recall, with approximately 60% detection rate compared to manually curated recombinants. This trade-off between precision and recall reflects our prioritization of robust identifications in the face of challenges such as convergent evolution. The stringent parameters we employed, including the requirement for four consecutive characteristic mutations and strict spatiotemporal sampling of parental lineages, contribute to this high precision but inevitably impact recall. However, it is important to note that CovRecomb’s utility as an early warning tool is predicated on the flexibility of these parameters. By relaxing certain criteria, such as the breakpoint threshold or the number of required consecutive mutations, the method’s recall can be significantly improved. This adaptability allows researchers to adjust the balance between precision and recall based on specific research objectives or surveillance needs. For instance, in early warning scenarios where rapid detection is crucial, parameters can be relaxed to enhance sensitivity, albeit with a potential increase in false positives. Future work will focus on optimizing this balance, particularly for applications requiring higher recall rates, while maintaining the method’s computational efficiency and biological relevance. Secondly, the identification of breakpoints is subject to some degree of uncertainty. Inferring the breakpoint regions from the gaps between the unique feature mutations of the parental lineages allows for the coverage of all possible breakpoints but compromises accuracy. Thirdly, CovRecomb relies on defined lineages rather than individual samples for recombinant detection, which may reduce sensitivity. Fourthly, contamination exclusion is challenging. Given the relative abundance of putative recombinants identified in this study, further verification from raw deep sequencing data or monitoring unusually high mutation rate to distinguish between recombinants resulting from natural coinfection and mixed samples from laboratory contamination was not provided. Lastly, although our analysis of the updated dataset provides a more comprehensive view of SARS-CoV-2 recombination dynamics, the current exploration of the updated data is not exhaustive. Future research should aim to delve deeper into the new data to fully capture emerging trends and refine the understanding of SARS-CoV-2 recombination patterns. Nevertheless, none of the shortcomings substantially impact the ability of CovRecomb method to construct a global SARS-CoV-2 recombination landscape or generate insights into recombination patterns.
Materials and methods
Detection of the interlineage recombinants
Recombination occurred between different (sub)lineages in a host cell, and the recombinant offspring had most of the same mutations inherited from their parental genomes. In other words, a recombinant descendant exhibits a sequential pattern of feature mutations inherited from its ancestral lineages. Our fundamental hypothesis underlying the CovRecomb method posits that a genome that simultaneously has sequential feature mutations from two lineages is a candidate recombinant sequence. Therefore, we employed the hypergeometric distribution probability test to statistically assess the most plausible parental lineages from a statistical perspective, which is a method usually used to solve genetic enrichment issues in biological contexts (Boyle et al. 2004, Rivals et al. 2007). Notably, CovRecomb substantially alleviates the computational burden compared to previous studies, which involved genomic alignment and comparison of thousands of polymorphic sites (Lole et al. 1999, Lam et al. 2018, Martin et al. 2021).
The CovRecomb pipeline consists of five key steps: transformation, construction, predefinition, mapping, and determination (Supplementary Fig. S1a). Firstly, utilizing the Nextclade tool (https://docs.nextstrain.org/projects/nextclade/en/stable/), we aligned all eligible SARS-CoV-2 genomes (up to 29 January 2023) to the reference sequence (Wuhan-Hu-1, GISAID accession: EPI_ISL_402125), transforming the full genome into a set of mutations, including SNPs and deletions. High sequencing coverage (ATCG ≥ 27,000) and complete metadata information (collection date, region, and country) were needed. Secondly, for each SARS-CoV-2 lineage, we extracted the mutations shared by over 75% of the lineage members and employed a clustering approach with a cut-off value (78.38% of feature mutations) determined by the minimum mutual similarity among viral genomes in the alpha lineage (Supplementary Fig. S1b). This procedure yielded a lineage-defining library comprising representative lineages and their feature mutations. Thirdly, for each target sample, we predefined a LPSM, wherein each pair represents a potential combination of parental lineages. The matrix’s row and column contained lineages that appeared prior to the target sample in terms of emergence time. Fourth, we mapped the mutation vector of the target sample against the predefined LPSM to calculate the hypergeometric distribution score (raw P value) for each lineage pair. Subsequently, we corrected the scores using Bonferroni’s method (corrected P value) to reduce false positive results. Finally, we identified the lineage pair with the minimum corrected P value (<.05) as the optimal candidate and further determined its status as a putative recombinant based on four criteria from a biological restriction perspective: (I) with the limited breakpoint number in the alphabet assemblage of feature mutation combinations (one to two); (II) with at least four sequential feature mutations for both parental lineages (XXXX and YYYY); (III) the feature mutations from both parental lineages were not coexisting in the feature mutation list of the most likely nonrecombinant lineage; and (IV) not the single genome in a recombinant event. All the framework details for the CovRecomb method are presented in Supplementary Fig. S1 and Supplementary Text S2.
For each putative recombinant sequence, CovRecomb provides the following information: the raw and corrected P values, respectively calculated by the hypergeometric distribution algorithm and adjusted by Bonferroni’s method, the inferred parental lineages, the corresponding feature mutations from each parent, and a feature mutation pattern represented by a sequential string composed of “X” and “Y” letters (https://github.com/wuaipinglab/CovRecomb/blob/main/CovRecomb-Global-Version/putative_recombinants/putative%20recombinants.csv).
Evaluation of the performance of CovRecomb
To evaluate the performance of CovRecomb, we conducted a comparative analysis with other recombination detection methods, namely RIPPLES, rebar, recombinhunt, VirusRecom, and 3SEQ. We excluded the Bolotie due to unresolved technical issues and insufficient output for a meaningful comparison with other methods. Since the RIPPLES, rebar, and recombinhunt were specifically developed for SARS-CoV-2 virus, we generated datasets consisting of real SARS-CoV-2 recombinants, obtained by randomly sampling sequences from 72 recombination lineages out of a pool of 14,555,061 genomes. Subsequently, we applied all six methods to detect these recombinants. The random sampling process was repeated five times and three key metrics were compared: elapsed time, coverage rate of recombinants, and accuracy of parental lineages. The coverage rate represents the percentage of identified recombinants by each method among all the included sequences, while the “accuracy of parental lineages” indicates the percentage of correctly assigned parental lineages by the respective method. The comparison test was completed on a server equipped with 36 processors (Intel(R) Xeon(R) CPU E5-2686 v4 @ 2.30 GHz), each with 18 CPU cores.
To investigate the generalizability of CovRecomb in detecting recombinants in other virus datasets, we conducted a simulation test and compared its performance with a universal detection method, 3SEQ. Initially, we used a forward-simulation approach (Saymon Akther et al. 2021) to generate simulation datasets by incorporating viral transmission, mutation, and recombination dynamics (Supplementary Fig. S2 and Supplementary Text S3). Subsequently, using the generated “.fasta” files, we conducted a fair and comprehensive comparison between 3SEQ and CovRecomb, evaluating their respective TPR, FPR, FDR, “accuracy of parental lineages”, and elapsed time in identifying a given number of interlineage recombinants. For 3SEQ, the running command line was ‘./3seq -f simulated_dataset.fasta -id output’ (Lam et al. 2018). For CovRecomb, the process involved sample mutation transformation, LPSM construction, mutation mapping, and determination. The clock started when each method read the “.fasta” file and ceased when the corresponding resulting files were generated. The TPR signifies the proportion of the identified interlineage recombinants among all the simulated interlineage recombinants, while the “accuracy of parental lineages” represents the probability of correctly recognized parental lineages among all the identified true recombinants (Supplementary Table S1). Scripts used to compute these metrics are available online (https://github.com/wuaipinglab/CovRecomb_Simulation_Test/tree/main/CovRecomb_compare_3SEQ). Classical recombinant detection methods, such as RDP5 (Martin et al. 2021), Simplot (Lole et al. 1999), and Recombination Analysis Tool (RAT) (Etherington et al. 2005), were neglected for their necessity to input sequences and set parameters manually. RIPPLES, rebar, recombinhunt, and VirusRecom were also omitted from the simulation test as they were either not applicable to virtual virus datasets or required prior knowledge of recombinants classification, thereby hindering a fair comparison. Details of the generation process of the simulation dataset are shown in Supplementary Text S3.
In addition, to provide statistical support for the essential parameter used in CovRecomb, we calculated the FDR values and drew the ROC curves for the method when using different numbers of sequential feature mutations (Supplementary Fig. S3a-b). To evaluate whether and how convergent evolution affects CovRecomb, we tested the method for its FDR, FPR, and TPR values in different homologous mutation numbers (Supplementary Fig. S3d-f) or proportions (Supplementary Fig. S3g-i). Moreover, we introduced a MERS dataset with 136 sequences in total and these sequences have been classified into five lineages provided by a previous study (Sabir et al. 2016) (Supplementary Table S2). Among them, 45 sequences from lineage 5 were considered as the recombinants from the lineage 3 and the lineage 4. Thus, we applied the CovRecomb to the dataset to test its potential generalizability to other viruses.
Furthermore, to test the extent to which CovRecomb can automatically identify recombinant lineages of SARS-CoV-2 starting with “X,” we calculate the proportions of the identified recombination lineages among all the recombination lineages included in the analysis. Additionally, to conduct a preliminarily assessment of the reliability of parental lineages identified by CovRecomb, we compared the specific parental lineage composition recognized by CovRecomb with the manually confirmed parental lineages available online (Roemer et al. 2022).
Identification of independent recombination events and recombinant clustering
To distinguish between ancient-like recombinants and their offspring in viral transmission during each recombination event, we established three filtering rules based on the evolutionary patterns of SARS-CoV-2. Subsequently, we clustered the spreading sequences into their respective lineages of origin. Initially, we classified recombinants based on their parental lineages and sorted all genomes sharing the same parental lineages (e.g. B.1.177.18 + B.1.1.7*) according to their sampling time. The first sampled recombinant was designated as the ancient-like recombinant and treated as an independent recombination event. For subsequent sequences, if they satisfied either of the following two rules, they were recognized as independent recombination events as well: (I) sequences with significantly longer sampling intervals. If the time interval between the collection of a genome and the closest previously sampled sequence exceeded 30 days, it was considered an independent recombination event. (ii) Sequences exhibiting distinct feature mutations. Based on the mutation accumulation rate of SARS-CoV-2 reported by Nextstrain, genomes tend to acquire an average of two new mutations within a month. Thus, if a putative recombinant genome possessed at least four distinct feature mutations compared to the previous recombinant within a month, it was likely to have originated from a novel recombination event rather than being transmitted from a pre-existing recombinant(s). Consequently, all potential independent events for a given parental lineage combination were identified. Although these putative events may not represent the actual recombinant genomes resulting from recombination in coinfected host cells, they can be considered ancient-like recombinants directly.
Next, the remaining sequences that were not identified as independent events were considered putative spreading genomes. For each of these sequences, we determined their ancestral lineage by comparing their mutations to all the previously identified independent ancient-like recombinants that were sampled prior to the transmitted genome. Specifically, the ancient-like recombinant exhibiting the highest-level consistent mutations was deemed the most plausible source. In cases where multiple ancient-like recombinants had an equal number of consistent mutations, we selected the one with the closest spatiotemporal distribution to the spreading genome. Consequently, each independent ancient-like recombinant and its corresponding transmitted genomes were grouped together. Drawing on previous research (Turakhia et al. 2022), we excluded groups consisting of only one sequenced genome and renewed the identified putative recombinants. Finally, if a group comprised more than 20 sequences, it was defined as a putative transmission event.
To screen out the accurate “X” series events, we designated those events that had already been assigned as a recombinant lineage or had at least half of their offspring assigned as a recombinant lineage as candidate events. Subsequently, if the identified parental lineages of the candidate events aligned with the acknowledged parental lineages, the candidate events were categorized as “X” series events (Supplementary Table S4).
Confidence classification of recombination events
For each recombination event, we generated an alphabet assemblage of “X” and “Y” letters (Supplementary Text S2.5, Supplementary Fig. S5a). Each X and Y represented a specific feature mutation inherited from the parental lineages. However, due to the utilization of a fixed threshold of 75% when determining lineage-specific feature mutations, there was a potential for false positive bias arising from mutations that were close but did not meet the cut-off value. To address this, we established a confidence evaluation system to evaluate the credibility of each recombination event. Initially, we recalculated the mutation frequency of each mutation within the parental lineages. For instance, “fx1” denoted the frequency of the first mutation (M1) among all 14,555,061 genomes assigned by lineage X (Supplementary Fig. S5a). Subsequently, we determined the confidence coefficient for the recombinant event by computing the mean frequency difference between lineage X and lineage Y (Supplementary Fig. S5a). Essentially, a larger frequency difference between the parental lineages indicated a higher likelihood that the mutation originated from the identified parental lineage. Next, we took the lower quartile confidence value of those events classified as “X” series events to determine whether the identified recombination event has higher confidence.
In the subsequent analysis, we focused our attention on the recombination events classified within the high confidence group. These events were subjected to further investigation to unravel recombination patterns, including the tracing of recombinant transmission, identification of breakpoint hotspots, and the computation of epidemiological and lineage preference associated with recombination.
Tracing recombinant transmission
We provided a detailed description of the recombination events with a relatively high confidence level and possessing a substantial number of offspring. First, the nucleotide variations between the ancient-like recombinant and the identified parental lineages was visually examined using the snipit software (https://github.com/aineniamh/snipit) to validate the mosaic structure of the recombinant. Second, to retrospect the spatiotemporal dispersal patterns of the recombination event, we generated a time-scaled tree topology and performed discrete ancestral state reconstruction, following the methodology employed in a previous stud (Scarpa et al. 2023, Tegally et al. 2023). This involved utilizing the FastTree v.2.1.11 (Price et al. 2010) and TreeTime (Sagulenko et al. 2018) tools. Third, we performed phylogenetic analysis of recombinants belonging to the same recombination event to elucidate their geographical distribution in relation to genome evolution. The phylogenetic relationship was reconstructed by IQTREE v2.1.4 (Nguyen et al. 2015) with 1000 ultrafast bootstrap replicates. The maximum likelihood trees were rooted on the SARS-CoV-2 reference genome (Wuhan-Hu-1), and the nucleotide substitution model Hasegawa-Kithe shino-Yano (HKY) was employed. The resulting phylogenetic tree files were visualized using the R package ggtree v.3.0.4 (https://bioconductor.org/packages/release/bioc/html/ggtree.html). Fourth, we drew a plot illustrating the distribution of collection dates for all recombinants, showcasing the temporal trends associated with the rise and fall of the recombination event.
Identification of breakpoint hotspots for SARS-CoV-2 recombination
Examination of the genome mosaic structures revealed that each position within the intervals separating the parental fragments held the potential to serve as a candidate breakpoint (Fig. 4a). In order to identify the breakpoint hotspots for SARS-CoV-2 recombination, for each site, we assessed the frequency of each site to act as a breakpoint within the intervals among putative recombinants classified within the higher confidence group. Subsequently, a density curve comprising all genome site frequencies was plotted. To enhance clarity, the density curve was smoothed using the python “runavg” package, which computed the average probability over a sliding window of 200 nucleotides for the genomic sites. Based on the frequencies for 29,903 sites in the SARS-CoV-2 genome measured above, we ranked all sites and divided them into the upper quartile and the lower quartile. Then, we distinguished hotspots and coldspots via the top quartile and bottom quartile as previously described (Patiño-Galindo et al. 2021). Specifically, sites with probabilities surpassing the upper quartile were recognized as hotspots, while those falling below the lower quartile were deemed coldspots, signifying their unlikelihood to serve as breakpoints. Consequently, genomic regions enriched in hotspots were designated as recombination hot regions, whereas regions enriched in coldspots were labeled as cold regions.
Calculation of the epidemiological and lineage preference characteristics of recombination
To determine the epidemiological frequencies of two parental lineages involved in each independent recombination event with higher confidence, we employed a geographical and temporal approach. Specifically, based on the sampling country and time of the ancient-like recombinant, we gathered all sequenced genomes obtained from the same geographic regions and within a 30-day window preceding the event. Subsequently, we computed the proportion of genomes assigned to the parental lineage (e.g. lineage X) or its associated member lineage(s) for the two parental lineages. These calculations allowed us to construct a scatter diagram, where the x- and y-axis values represented the frequencies of the respective parental lineages (Fig. 5a). To vividly portray the prevalence of parental lineages in the location of recombination, we generated a histogram by sorting the cumulative frequencies of parental lineages for each event in descending order (Fig. 5b).
An important aspect to explore in a lineage involved in SARS-CoV-2 recombination is its preference for recombination partners. Therefore, for lineage pairs associated with recombination events exhibiting higher confidence, we visualized the lineage pair enrichment or, in other words, the lineage preference using a heatmap (Supplementary Fig. S8). Furthermore, we constructed a concise heatmap by merging lineages belonging to the same VOI or VOC designated by the WHO (https://www.who.int/activities/tracking-SARS-CoV-2-variants) to investigate the recombination relationships between SARS-CoV-2 variants (Fig. 5c).
In addition, we explored the correlation between lineage similarity and the number of recombinations. To calculate the similarity between two lineages, we use the feature mutations lists identified for each lineage and compute the symmetric difference of their feature mutations. We then iterate through the symmetric difference set to calculate the number of sites, ldiff, contained in this set. If a feature mutation is a point mutation, it contributes 1 to the site count; if it is a deletion, its contribution is equal to its length. By comparing ldiff with the genome length Lgene, we can obtain the similarity between the two lineages.
Acknowledgements
We would like to thank Jin-feng Zeng and Dr Xiangjun Du from the School of Public Health (Shenzhen), Sun Yat-sen University, Guangzhou, China, and thank Dr Huaying Fang from Beijing Advanced Innovation Center for Imaging Theory and Technology, Capital Normal University, Beijing, China, for their helpful discussion. We gratefully acknowledge Orsolya Anna Pipek and colleagues for their work on Systematic detection of co-infection and intra-host recombination in more than 2 million global SARS-CoV-2 samples. The meta-information of the samples from their co-infection analysis results provided valuable data for our study. Additionally, their analytical approach inspired our methodology. The data analysis process has been supported by the High-throughput Sequencing and High-performance Computing Platform of the Suzhou Institute of Systems Medicine, Chinese Academy of Medical Sciences & Peking Union Medical College. We gratefully acknowledge all the authors who contributed to the GISAID database.
Author contributions
Study concept and design: A.P.W. and H.Y.Z.; Acquisition of data: J.Y.L., H.Y.W., and Y.X.C.; Statistical analysis of data: J.Y.L., H.Y.W., Y.X.C., C.Y.J.; Analysis and interpretation of data: J.Y.L., H.Y.W., H.Y.Z., S.H.W., N.H., R.Y., and A.P.W.; Drafting of the manuscript: J.Y.L., H.Y.Z., H.Y.W., Y.X.C., and A.P.W. All authors have revised and approved the submitted manuscript.
Supplementary data
Supplementary data is available at VEVOLU Journal online.
Conflict of interest:
None declared.
Funding
This project is supported by the National Key Plan for Scientific Research and Development of China (2021YFC2301305); the CAMS Innovation Fund for Medical Sciences (2021-I2M-1-061, 2022-I2M-2-004, 2023-PT330-01, 2023-I2M-2-005); the National Natural Science Foundation of China (92169106); the Non-profit Central Research Institute Fund of Chinese Academy of Medical Sciences (2021-PT180-001); Capital’s Funds for health Improvement and Research (shoufa-1G-1131); Suzhou science and technology development plan (szs2020311); Natural Science Foundation of Jiangsu Province (Grants No. BK20220278); and the NCTIB Fund for R&D Platform for Cell and Gene Therapy.
Data availability
The genome sequences and metadata were downloaded from the GISAID database (https://www.gisaid.org/). The homemade Python scripts for the CovRecomb pipeline to analyze the global SARS-CoV-2 genomes are available online (https://github.com/wuaipinglab/CovRecomb/tree/main/CovRecomb-Global-Version). The detection results of all 135,567 putative recombinant sequences are available online (https://github.com/wuaipinglab/CovRecomb/blob/main/CovRecomb-Global-Version/putative_recombinants/putative%20recombinants.csv). The supplementary tables (Supplementary Tables S1-7) are available online (https://github.com/wuaipinglab/CovRecomb/tree/main/CovRecomb-Global-Version/supplementary%20tables). We have integrated the CovRecomb method into a lightweight version and released it as a command line tool at https://github.com/wuaipinglab/CovRecomb/tree/main/CovRecomb-Local-Version. Scripts for the quantitative comparison between different recombination detection methods in real SARS-CoV-2 datasets are available online (https://github.com/wuaipinglab/CovRecomb/tree/main/CovRecomb_Test/Compare_detection_methods). Scripts used to generate simulation data are available online (https://github.com/wuaipinglab/CovRecomb_Simulation_Test).
References
Author notes
contributed equally.
