


Abstract
Chronic hexavalent chromium [Cr(VI)] exposure causes lung cancer and other types of cancer; however, the mechanism of Cr(VI) carcinogenesis remains to be clearly defined. Our recent study showed that chronic Cr(VI) exposure upregulates the proto oncogene c-Myc expression, which contributes significantly to Cr(VI)-induced cell transformation, cancer stem cell (CSC)-like property and tumorigenesis. c-Myc is a master regulator of cancer cell abnormal metabolism and accumulating evidence suggests that metabolism dysregulation plays an important role in both cancer development and progression. However, little is known about the role of metabolism dysregulation in Cr(VI) carcinogenesis. This study was performed to investigate the potential role and mechanism of metabolism dysregulation in Cr(VI) carcinogenesis. It was found that Cr(VI)-transformed cells display glycolytic shift, which depends on the upregulation of c-Myc. The glycolytic shift in Cr(VI)-transformed cells led to increased production of acetyl coenzyme A (acetyl-CoA) and elevation of histone acetylation. This, in turn, upregulated the expression of an acetyl-CoA producing key enzyme ATP citrate lyase and c-Myc, forming a positive feedback loop between the upregulation of c-Myc expression, glycolytic shift and increased histone acetylation. It was further determined that glucose depletion not only reverses the glycolytic shift in Cr(VI)-transformed cells, but also significantly reduces their growth, CSC-like property and tumorigenicity. These findings indicate that glycolytic shift plays an important role in maintaining malignant phenotypes of Cr(VI)-transformed cells, suggesting that metabolism dysregulation is critically involved in Cr(VI) carcinogenesis.
Hexavalent chromium [Cr(VI)] is classified as a Group I human carcinogen by the International Agency for Research on Cancer. Industrial usage of chromium is responsible for a large amount of Cr(VI) being released to the environment (IARC, 1990). Although Cr(VI) exposure represents a significant environmental health concern, the mechanism of Cr(VI) carcinogenesis is not well-known. Our recent studies showed that epigenetic dysregulations and the upregulation of c-Myc expression play critical roles in Cr(VI)-induced cancer stem cell (CSC)-like property, cell transformation and tumorigenesis (Wang et al., 2018, 2019a; Wang and Yang, 2019). C-Myc is a proto-oncogene and a master regulator of cancer cell metabolism; the increased expression of c-Myc is linked with glycolytic shift in cancer cells (Dang, 2013; Dang et al., 2009). In addition, recent transcriptomic analysis of Cr(VI)-transformed cells showed increased expression of genes in the glycolysis pathway (Clementino et al., 2018). Together, these findings from our recent studies as well as other studies suggest that Cr(VI)-transformed cells may undergo metabolism dysregulation. However, it remains to be determined whether Cr(VI)-transformed cells display glycolytic shift and whether glycolytic shift plays an important role in Cr(VI)-induced CSC-like property and tumorigenesis.
Glycolysis is the metabolic pathway that anaerobically metabolizes glucose. Compared with glucose metabolism via the oxidative phosphorylation (OXPHOS) metabolic pathway, the ATP generation efficiency of glycolysis is much lower (Gillies et al., 2008; Hanahan and Weinberg, 2011; Pavlova and Thompson, 2016). Cancer cells adapt their metabolism to provide support for the increased cell division rate by metabolic reprograming, which has been characterized by a shift in ATP generation from OXPHOS to glycolysis (Hanahan and Weinberg, 2011). Cancer cells are less efficient in ATP generation considering that glycolysis has a net ATP production of 2 ATPs per molecule of glucose and OXPHOS has a net ATP production of 36 ATPs per molecule of glucose. The difference is that glucose can be used by the pentose phosphorylation pathway and other alternative pathways to produce large quantities of reduced NADPH and other macromolecules when metabolized via glycolysis alone (Pavlova and Thompson, 2016). These substrates are necessary anabolic building blocks to sustain increased cancer cell proliferation and tumorigenesis. Therefore, increased glucose metabolism by glycolysis is considered as an emerging hallmark of cancer metabolism (Pavlova and Thompson, 2016).
Epigenetic dysregulations play important roles in regulating CSC function and tumorigenesis (Mishra and Verma, 2012; Muñoz et al., 2012; Toh et al., 2017; Wainwright and Scaffidi, 2017). Studies have shown that the interactions between epigenetics and metabolism exist (Fan et al., 2015; Liu et al., 2015). On one hand, epigenetic mechanisms regulate the expression of many metabolic enzymes (Fan et al., 2015; Flavahan et al., 2017). On the other hand, metabolites such as acetyl coenzyme A (acetyl-CoA) and S-adenosylmethionine (SAM) are critically involved in histone posttranslational modifications, which are important mechanisms of epigenetics (Bannister and Kouzarides, 2011; Marmorstein and Trievel, 2009). Our recent studies have shown that both epigenetic dysregulations and the upregulation of c-Myc expression play critical roles in Cr(VI)-induced CSC-like property and tumorigenesis (Wang et al., 2018, 2019a; Wang and Yang, 2019); however, it has not been determined whether there is a link between Cr(VI)-caused epigenetic dysregulations and the upregulated expression of c-Myc, a master regulator of cancer metabolism. It is also unknown whether epigenetic dysregulations and c-Myc upregulation contribute to abnormal metabolism in Cr(VI)-transformed cells. In this study, we revealed a positive feedback loop in Cr(VI)-transformed cells between the upregulation of c-Myc expression, glycolytic shift, and increased-histone acetylation, which promotes Cr(VI)-induced CSC-like property and tumorigenesis.
MATERIALS AND METHODS
Cell culture and chemical treatments
Immortalized nontumorigenic human bronchial epithelial BEAS-2B cells were obtained from American Type Culture Collection (ATCC, Manassas, Virginia). Chronic Cr(VI) exposure-transformed BEAS-2B [BEAS-2B-Cr(VI)] cells, passage-matched BEAS-2B control cells, Cr(VI)-transformed cells with control shRNA [BEAS-2B-Cr(VI)-shRNA control], c-Myc stable knockdown shRNA [BEAS-2B-Cr(VI)-c-Myc shRNA] cells, BEAS-2B vector control (BEAS-2B-vector control) and BEAS-2B c-Myc stable overexpression (BEAS-2B-c-Myc OE) cells were generated and characterized in our recent studies (Wang et al., 2018, 2019a). These cells were cultured in Dulbecco’s modified Eagle medium (DMEM) (ThermoFisher, Massachusetts, Cat. No. 11965-084) supplemented with 5% fetal bovine serum (FBS) and 1% PenStrep (PS), which is defined as the complete medium. For the no glucose culture, cells were cultured in the no glucose, no phenol red, and no glutamine DMEM (ThermoFisher, Cat. No. A14430-01) supplemented with 5% FBS, 1% PS, 11 mM galactose, and 2 mM glutamine, as reported before (Hardonnière et al., 2016).
For the Sirtuin (SIRT) protein deacetylase family inhibitor nicotinamide (NAM) treatment experiments, cells were treated with 10 mM of NAM for 8 h. For the protein synthesis inhibitor cycloheximide (CHX) treatment experiments, cells were treated with 10 µM of CHX for 0.5, 1, 2, and 4 h, respectively. For the proteasome inhibitor MG132 treatment experiments, cells were treated with 10 µM of MG132 for 4 h. For the ATP citrate lyase (ACLY) inhibitor SB204990 treatment experiments, cells were treated with 30 µM of SB204990 for 24 h. At the end of these inhibitor treatments, cells were harvested for the related assays.
Seahorse XF glycolytic stress test
Forty-thousand cells were seeded in 96-well plates. After overnight culture, plates were submitted to the Redox Metabolism Shared Resource Facility of the University of Kentucky for the Glycolytic Stress test. The Extracellular Acidification Rate (ECAR) was obtained and glycolysis, glycolytic capacity, and glycolytic reserve were calculated using the wave software (Agilent Technologies, Santa Clara, California). Briefly, the assay begins with the injection of glucose. Cells metabolize this carbohydrate via the glycolytic pathway causing a rapid increase in ECAR. This response is presented as the rate of glycolysis and is calculated by the measurement of the area under the curve (AUC) once the graph of ECAR variation is plotted. The second injection is oligomycin, which is an ATP synthase inhibitor. This injection shifts energy production to glycolysis and leads to a further increase in ECAR. This response is presented as the glycolytic capacity and is calculated by the measurement of the AUC. The third and final injection is 2-deoxy-glucose (2-DG), a glucose analog. 2-DG inhibits glycolysis through competitive bidding to hexokinase. This injection leads to a decrease in ECAR and confirms that ECAR produced in the experiment is due to glycolysis. The difference between glycolysis and glycolytic capacity is the glycolytic reserve.
Western blot
Cells were harvested and washed with PBS and lysed using cell lysis buffer following our previous protocol (Wang et al., 2019a). Ten to 30 µg of protein were separated using SDS-polyacrylamide gel electrophoresis. The following primary antibodies were obtained from Cell Signaling Technology (Beverly, Massachusetts): hexokinase-2 (HK2) (Cat. No. 2876; dilution 1:10 000), phosphofructokinase (PFK) (Cat. No. 2876; dilution 1:10 000), lactate dehydrogenase (LDH) (Cat. No. 3582; dilution 1:10 000), GAPDH (Cat. No. 5174; dilution 1:2000), c-Myc (Cat. No. 5605; dilution 1:1000), ACLY (Cat. No. 13390; dilution 1:1000), AcH3K9 (Cat. No. 9649; dilution 1:20 000), AcH3K27 (Cat. No. 8173; dilution 1:20 000), AcH4 (Cat. No. 377520; dilution 1:1000), AcH2B (Cat. No. 515937; dilution 1:1000), Ubiquitin (Cat. No. 3936; dilution 1:200), Total H3 (Cat. No. 4499; dilution 1:10 000), Total H2B (Cat. No. 12364; dilution 1:1000), and Total H4 (Cat. No. 2592; dilution 1:1000). The primary antibody β-actin (Cat. No. A5441; dilution 1:10 000) was obtained from Sigma (St Louis, Missouri). Western blot image quantifications were done using ImageJ software, and the results are presented as the ratio of specific protein band intensity divided by the corresponding loading control band intensity (β-actin or GADPH).
Cellular acetyl-CoA and citrate level measurement
The cellular acetyl-CoA level was measured using an acetyl-CoA assay kit (Sigma-Aldrich) following the manufacturer’s instructions. Briefly, cellular samples were first deproteinized using 1-M perchloric acid, followed by sonication and centrifugation. The supernatants were then collected, neutralized using potassium bicarbonate, cooled on ice and used for the acetyl-CoA assay reaction and measurement. The cellular citrate level was measured using a citrate assay kit (Sigma-Aldrich) following the manufacturer’s instructions. Briefly, cellular samples were deproteinized with a 10-kDa molecular weight cut-off spin filter, followed by sonication and centrifugation. The supernatants were then collected and used for citrate assay reaction and measurement.
ACLY immunofluorescence staining of human lung tissue sections
The immunofluorescence (IF) staining of ACLY in human lung tissue sections was carried out as previously described (Zhao et al., 2010). The IF-stained slides were photographed using a Nikon fluorescent microscope. Images were overlaid using Nikon NIS-elements software with ACLY staining in red fluorescence and with nuclear 4′-6-diamidino-2-phenylindole (DAPI) staining in blue fluorescence.
Suspension culture sphere formation assay
Cells were plated in ultralow attachment 24-well plates (Corning, Corning, New York) at a density of 2.5 × 10³ cells/well as described in our recent publication (Wang et al., 2019a). Plates were incubated at 37°C in a humidified 5% CO2 atmosphere for 10 days and spheres were viewed under a phase-contrast microscope and counted if > 50 µM.
Clonogenic assay
Cells were plated in 6 cm dishes at a density of 1 × 10² cells/plate. Culture medium was replaced every other day and treatments were added accordingly. Cells were cultured for 12 days and colonies were counted.
Quantitative PCR analysis
Total RNAs were extracted from cells using TRIzol Reagent (ThermoFisher Scientific, Waltham, Massachusetts) following the manufacturer’s procedures. Purified RNA was reversely transcribed using qScript cDNA synthesis kit. Quantitative PCR (qPCR) analyses of c-Myc and ACLY were performed in the ABI 7500 Fast Real Time PCR system using TaqMan assays (Applied Biosystems, Inc, Foster City, California). The 18S RNA was also analyzed by the TaqMan assay and used as an internal control for normalizing gene expression.
Chromatin immunoprecipitation) assay
The chromatin immunoprecipitation (ChIP) assay was performed using the Pierce Agarose ChIP kit following the manufacturer’s instructions. The fragmented chromatin was immunoprecipitated with 5 µg of acetyl histone H3 antibody (Sigma-Aldrich, Cat. No. 06-599) or the negative control IgG antibody provided by the kit. The enrichment of acetyl-histone 3 at ACLY and MYC promoter regions was analyzed by qPCR analysis as described in our recent study (Wang et al., 2020). The ChIP-qPCR results are expressed using the Percent Input Method.
Coimmunoprecipitation assay
The coimmunoprecipitation (Co-IP) assay was performed following our previous protocol (Wang et al., 2019b). Briefly, BEAS-2B-Cr(VI) cells were treated with NAM (10 mM) for 8 h, after which, the cell pellet was collected and lysed. Cell lysates were incubated with 5 µg of ACLY primary antibody or the control IgG antibody overnight, followed by the addition of precleaned beads. Precipitates were washed, centrifuged, and loading buffer was added. Then, samples were submitted to Western blot analysis.
Nude mouse xenograft tumorigenesis study
Animal protocols were reviewed and approved by the University of Kentucky Institutional Animal Care and Use Committee. Cr(VI)-transformed BEAS-2B cells cultured in complete medium or no glucose medium were used for this animal study. Cells were cultured in no glucose medium for 6 passages before inoculation. Cells were collected and suspended in 0.1 ml of 1:1 growth factor reduced Matrigel and PBS. Each experimental group consisted of 10 female nude mice (Nu/Nu, Charles River laboratories) and 2 × 10⁶ cells were injected subcutaneously into the left and right flanks. After injection, mice were maintained under pathogen-free conditions, monitored weekly, and euthanized 12 weeks after injection. Tumor xenograft tissues were then harvested and fixed with 10% formalin solution.
Statistical analysis
Data were represented as mean ± SD. Statistical analysis was performed by comparing 2 different treatments via 2-tailed t tests. Comparisons between more than 2 data sets were performed via 1-way analysis of variance (ANOVA). For the incidence rate of mouse xenograft tumors, statistical significance was calculated using Fisher’s exact test. Only p values with 95% confidence were considered statistically significant (ie, p < .05).
RESULTS
Cr(VI)-transformed Cells Display Glycolytic Shift Depending on the Upregulation of c-Myc Expression
Our recent study showed that the expression level of c-Myc is upregulated and plays a critical role in Cr(VI)-induced CSC-like property and tumorigenesis (Wang et al., 2019a). Because increased c-Myc expression is associated with cancer cell abnormal metabolism (Dang, 2013; Dang et al., 2009), we sought to determine whether Cr(VI)-transformed cells that express a high level of c-Myc display metabolic dysregulation. We first analyzed and compared glycolysis in Cr(VI)-transformed cells and their passage-matched control cells using the Seahorse Metabolic Analyzer. It was found that Cr(VI)-transformed cells display significant increases in glycolysis and glycolytic capacity (Figure 1A). These results demonstrate that Cr(VI)-transformed cells have metabolism dysregulation as evidenced by the increased glycolysis or glycolytic shift.
![Hexavalent chromium [Cr(VI)]-transformed cells display glycolytic shift depending on the upregulation of c-Myc up. A–C, Seahorse glycolytic stress tests showing glucose metabolism of BEAS-2B-Control, BEAS-2B-Cr(VI) (A); BEAS-2B-Cr(VI)-Control shRNA, BEAS-2B-Cr(VI)-c-Myc shRNA (B); BEAS-2B-Vector control, and BEAS-2B-c-Myc OE (C) cells. The results in bar charts are presented as mean ± SD (n = 8). *p < .05, compared with BEAS-2B-Control, BEAS-2B-Cr(VI)-Control shRNA, or BEAS-2B-Vector control cells, respectively. D, Representative Western blot analysis of c-Myc, hexokinase-2 (HK2), phosphofructokinase (PFK), and lactate dehydrogenase (LDH) protein levels in BEAS-2B-Control, BEAS-2B-Cr(VI), BEAS-2B-Cr(VI)-Control shRNA, BEAS-2B-Cr(VI)-c-Myc shRNA, BEAS-2B-Vector control, and BEAS-2B-c-Myc OE cells, respectively. E, Quantitative results of relative protein levels of c-Myc, HK2, PFK, and LDH in BEAS-2B-Control, BEAS-2B-Cr(VI), BEAS-2B-Cr(VI)-Control shRNA, BEAS-2B-Cr(VI)-c-Myc shRNA, BEAS-2B-Vector control, and BEAS-2B-c-Myc OE cells (mean ± SD, n = 3). *p < .05, compared with BEAS-2B-Control, BEAS-2B-Cr(VI)-Control shRNA, and BEAS-2B-Vector Control, respectively. Abbreviation: ECAR, Extracellular Acidification Rate.](https://oup.silverchair-cdn.com/oup/backfile/Content_public/Journal/toxsci/177/1/10.1093_toxsci_kfaa086/2/m_kfaa086f1.jpeg?Expires=1750246852&Signature=jO0pZZk8dmVZUdpc2PSXpnT5SeXE3b3TFik4lRVzeDTwmDtTzuFugmrWXpqVabHdYKbcxejmPeUp4~NZJOeNVj8ByGSxjLu7aj0hZaYZ8ybT3zEGK~gtoFOShclayAQbXmV1no7aww4yRAX6ypiV1-f1kUDJ8TJG3PXKwHFvVc7w745pKXL8ydmgTc77jJg38NqoarXoSTqxFkjHRYoQYAe8TB6ouOdCSnVlR1dulTYKQDx7-j2jzfY6WTyiCeXOOg4kXdxwNQfQvi68diu7yNGLORg0U7MV7l78nX262q09uTelaWyMZToZh1uwxfLnokXZNCglx89kPXeBk0ntRw__&Key-Pair-Id=APKAIE5G5CRDK6RD3PGA)
Hexavalent chromium [Cr(VI)]-transformed cells display glycolytic shift depending on the upregulation of c-Myc up. A–C, Seahorse glycolytic stress tests showing glucose metabolism of BEAS-2B-Control, BEAS-2B-Cr(VI) (A); BEAS-2B-Cr(VI)-Control shRNA, BEAS-2B-Cr(VI)-c-Myc shRNA (B); BEAS-2B-Vector control, and BEAS-2B-c-Myc OE (C) cells. The results in bar charts are presented as mean ± SD (n = 8). *p < .05, compared with BEAS-2B-Control, BEAS-2B-Cr(VI)-Control shRNA, or BEAS-2B-Vector control cells, respectively. D, Representative Western blot analysis of c-Myc, hexokinase-2 (HK2), phosphofructokinase (PFK), and lactate dehydrogenase (LDH) protein levels in BEAS-2B-Control, BEAS-2B-Cr(VI), BEAS-2B-Cr(VI)-Control shRNA, BEAS-2B-Cr(VI)-c-Myc shRNA, BEAS-2B-Vector control, and BEAS-2B-c-Myc OE cells, respectively. E, Quantitative results of relative protein levels of c-Myc, HK2, PFK, and LDH in BEAS-2B-Control, BEAS-2B-Cr(VI), BEAS-2B-Cr(VI)-Control shRNA, BEAS-2B-Cr(VI)-c-Myc shRNA, BEAS-2B-Vector control, and BEAS-2B-c-Myc OE cells (mean ± SD, n = 3). *p < .05, compared with BEAS-2B-Control, BEAS-2B-Cr(VI)-Control shRNA, and BEAS-2B-Vector Control, respectively. Abbreviation: ECAR, Extracellular Acidification Rate.
Next, we further determined whether the glycolytic shift in Cr(VI)-transformed cells depends on the upregulation of c-Myc expression. In our recent study, we stably knocked down c-Myc expression in Cr(VI)-transformed cells [BEAS-2B-Cr(VI)-c-Myc shRNA] (Wang et al., 2019a). The Seahorse Metabolic Analyzer analysis showed that glycolysis, glycolytic capacity, and glycolytic reserve are all significantly lower in BEAS-2B-Cr(VI)-c-Myc shRNA cells than that in BEAS-2B-Cr(VI)-Control shRNA cells (Figure 1B). These results suggest that the upregulation of c-Myc expression plays an important role in glycolytic shift in Cr(VI)-transformed cells. To further confirm this point, we also analyzed glycolysis in vector control BEAS-2B cells (BEAS-2B-Vector Control) and c-Myc stable overexpression BEAS-2B cells (BEAS-2B-c-Myc OE) generated in our recent study (Wang et al., 2019a). These cells were not exposed to Cr(VI) but engineered to stably overexpress c-Myc. It was found that c-Myc overexpression significantly increases cellular glycolysis, glycolytic capacity, and glycolytic reserve (Figure 1C), phenocopying the effect observed in Cr(VI)-transformed cells (Figure 1A). Together, these results indicate that Cr(VI)-transformed cells display glycolytic shift which depends on the upregulation of c-Myc expression.
Glycolysis is regulated primarily by several glycolytic proteins such as HK2, PFK, and LDH (Nelson, 2005). HK2 catalyzes the conversion of glucose to glucose-6-phosphate, which is the first rate-limiting step of the glycolytic pathway. PFK catalyzes the second phosphorylation reaction of the glycolytic pathway, which is the phosphorylation of fructose-6-phosphate to fructose-1, 6-diphosphate. LDH catalyzes the conversion of pyruvate to lactate and converts NADH back to NAD+. LDH also catalyzes the reverse reaction generating NADH from NAD+ (Nelson, 2005). c-Myc is a helix-loop-helix leucine zipper transcription factor and binds to specific DNA sequences to activate gene expression. We next performed Western blots to determine whether the expression levels of the aforementioned glycolytic pathway enzyme protein levels are increased in Cr(VI)-transformed cells and whether c-Myc plays a role in the regulation of these glycolytic pathway enzyme protein levels in Cr(VI)-transformed cells. It was found that the protein levels of HK2, PFK, and LDH are all increased in Cr(VI)-transformed cells (Figs. 1D and 1E). Moreover, stably knocking down c-Myc expression greatly reduced these glycolytic protein levels in Cr(VI)-transformed cells (Figs. 1D and 1E), which is consistent with significantly reduced glycolysis in these cells (Figure 1B). Furthermore, stably overexpressing c-Myc alone greatly increased the levels of these glycolytic proteins (Figs. 1D and 1E), which is consistent with significantly increased glycolysis in these cells (Figure 1C). Together, these results suggest that chronic Cr(VI) exposure increases the expression of several important glycolytic pathway enzymes causing glycolytic shift in Cr(VI)-transformed cells, which depends on the upregulation of c-Myc expression.
Glycolytic Shift Leads to the Upregulation of Acetyl-CoA Levels, Increasing Histone Acetylation in Cr(VI)-transformed Cells
Next, we began determining the significance of glycolytic shift in Cr(VI)-transformed cells. Our recent study showed that the total histone 3-acetylation (H3 acetylation) level is increased in Cr(VI)-transformed cells (Wang et al., 2018). Considering that (1) acetyl-CoA is the substrate providing the acetyl group for histone acetylation; (2) acetyl-CoA can be generated from glucose-derived citrate; and (3) the intracellular concentration of acetyl-CoA dynamically regulates the activities of histone acetyltransferases (HATs) (Shanmugam et al., 2018), we hypothesized that glycolytic shift regulates acetyl-CoA levels and histone acetylation in Cr(VI)-transformed cells. To test this hypothesis, we first determined the levels of acetyl-CoA and histone acetylation marks in Cr(VI)-transformed cells and the passage-matched control cells. It was observed that the acetyl-CoA level is significantly higher in Cr(VI)-transformed cells than the control cells (Figure 2A). Similarly, the levels of several histone acetylation marks including histones 3 acetyl-lysine 9 (Ac-H3K9), histone 3 acetyl-lysine 27 (Ac-H3K27), acetyl-histone 4 (Ac-H4), and acetyl-histone H2B (Ac-H2B) are all greatly increased in Cr(VI)-transformed cells (Figure 2D).
![Glycolytic shift leads to the upregulation of acetyl coenzyme A (acetyl-CoA) levels, increasing histone acetylation in hexavalent chromium [Cr(VI)]-transformed cells. A–C, Relative cellular acetyl-CoA levels of BEAS-2B-Control and BEAS-2B-Cr(VI) (A), BEAS-2B-Cr(VI)-Control shRNA and BEAS-2B-Cr(VI)-c-Myc shRNA (B), BEAS-2B-Vector control and BEAS-2B-c-Myc OE cells (C) (mean ± SD, n = 3), respectively. D, Representative Western blot analysis of c-Myc, Ac-H3K9, Ac-H3K27, Total H3, Ac-H2B, Total H2B, Ac-H4, and Total H4 protein levels in BEAS-2B-Control and BEAS-2B-Cr(VI), BEAS-2B-Cr(VI)-Control shRNA, BEAS-2B-Cr(VI)-c-Myc shRNA, BEAS-2B-Vector control, and BEAS-2B-c-Myc OE cells, respectively.](https://oup.silverchair-cdn.com/oup/backfile/Content_public/Journal/toxsci/177/1/10.1093_toxsci_kfaa086/2/m_kfaa086f2.jpeg?Expires=1750246852&Signature=4bGZk-i8cAjrzLxzujXkyslNe2ygFTNCRoRcT-QfOx3SaaniYLj4hSyTtux8jow4zzFAltn3vUm9N1UTf10ZenS-I547ZKZZ1WSbzhLmLXUiGk6KYnAsa~tVq8GEsuNWodRUrAKQnX762cUNKoa6ERTV9yfI~5mpCfVZxPjAAqE~pRWJKUW00-OMZBaB8Ga03X7Wbl4GYOJr1ePjOj1iZs8kPoGoZTJ1juRFG8yALRCBHc19stQTLCfuc3Jo8ocdJAAVUI~4aGmqVdwfh2VgBEWreiU6Qpb3VJ0CpyX06rRPXbrHXCdJTRfwTety8wbTP0Y2etWoy5CkUCT9lgoTlw__&Key-Pair-Id=APKAIE5G5CRDK6RD3PGA)
Glycolytic shift leads to the upregulation of acetyl coenzyme A (acetyl-CoA) levels, increasing histone acetylation in hexavalent chromium [Cr(VI)]-transformed cells. A–C, Relative cellular acetyl-CoA levels of BEAS-2B-Control and BEAS-2B-Cr(VI) (A), BEAS-2B-Cr(VI)-Control shRNA and BEAS-2B-Cr(VI)-c-Myc shRNA (B), BEAS-2B-Vector control and BEAS-2B-c-Myc OE cells (C) (mean ± SD, n = 3), respectively. D, Representative Western blot analysis of c-Myc, Ac-H3K9, Ac-H3K27, Total H3, Ac-H2B, Total H2B, Ac-H4, and Total H4 protein levels in BEAS-2B-Control and BEAS-2B-Cr(VI), BEAS-2B-Cr(VI)-Control shRNA, BEAS-2B-Cr(VI)-c-Myc shRNA, BEAS-2B-Vector control, and BEAS-2B-c-Myc OE cells, respectively.
We demonstrated that glycolytic shift in Cr(VI)-transformed cells depends on the upregulation of c-Myc expression (Figure 1). Next, we determined whether the increase of acetyl-CoA levels that could be due to glycolytic shift also depends on the upregulation of c-Myc expression in Cr(VI)-transformed cells. It was found that c-Myc knockdown in Cr(VI)-transformed cells significantly reduces the level of acetyl-CoA (Figure 2B). Similarly, histone acetylation marks were also greatly reduced in Cr(VI)-transformed cells in which c-Myc had been stably knocked down (Figure 2D). In contrast, it was observed that the acetyl-CoA level is significantly increased in BEAS-2B cells overexpressing c-Myc (Figure 2C). Correspondingly, the levels of histone acetylation marks are greatly increased in c-Myc overexpressing cells (Figure 2D). Together, these results indicate that the levels of acetyl-CoA and histone acetylation markers are increased in Cr(VI)-transformed cells, which is likely due to c-Myc-medicated glycolytic shift.
The Elevated-level of Acetyl-CoA in Cr(VI)-transformed Cells Results From the Increased Expression of ATP Citrate Lyase
We next determined the mechanism of how acetyl-CoA levels are upregulated in Cr(VI)-transformed cells. Cellular acetyl-CoA is usually produced by 2 metabolic pathways: (1) its direct synthesis from acetate and CoA by acetyl-coA synthase short-chain family 1 (AceCS1); and (2) the conversion from citrate to acetyl-CoA by the ACLY (Fan et al., 2015). However, the availability of acetyl-CoA for HATs is primarily modulated by ACLY (Fan et al., 2015; Marmorstein and Trievel, 2009). Because we found that the levels of both cellular acetyl-CoA and histone acetylation are increased in Cr(VI)-transformed cells, we hypothesized that acetyl-CoA upregulation is mainly due to the increased expression and/or activity of ACLY in Cr(VI)-transformed cells. To test this hypothesis, we first measured cellular citrate levels. It was found that the citrate levels in Cr(VI)-transformed cells are not significantly different from that in passage-matched control cells (Supplementary Figure 1). In contrast, Western blot analysis revealed that the protein level of ACLY is increased in Cr(VI)-transformed cells (Figure 3A). In consistence with the upregulation of the cellular acetyl-CoA level that is due to c-Myc-medicated glycolytic shift, it was also observed that stably knocking down or overexpressing c-Myc greatly reduces and increases ACLY protein levels, respectively (Figure 3A). In addition, our recent study showed that c-Myc expression levels are significantly higher in Cr(VI) exposure-caused human lung cancer tissue compared with the adjacent normal lung tissue (Wang et al., 2019a). Our IF staining of ACLY showed that the ACLY expression level is also significantly higher in Cr(VI) exposure-caused human lung cancer tissue than that in the adjacent normal lung tissue. The representative IF staining images of ACLY from a 40-year-old nonsmoker worker exposed to chromate for 22 years are shown in Figures 3B and 3C. Moreover, treatment with a pharmacological inhibitor (SB204990) of ACLY significantly reduced the level of acetyl-CoA and histone acetylation in Cr(VI)-transformed cells (Figs. 3D and 3E). Together, these results indicate that (1) ACLY expression is increased in Cr(VI)-transformed cells and Cr(VI) exposure-caused lung cancer tissue and (2) the upregulation of ACLY increases acetyl-CoA levels and histone acetylation.
![The elevated level of acetyl coenzyme A (acetyl-CoA) and increased-histone acetylation in hexavalent chromium [Cr(VI)]-transformed cells result from ATP citrate lyase (ACLY) upregulation. A, Representative Western blot analysis of ACLY protein levels in BEAS-2B-Control and BEAS-2B-Cr(VI); BEAS-2B-Cr(VI)-Control shRNA and BEAS-2B-Cr(VI)-c-Myc shRNA; BEAS-2B-Vector control and BEAS-2B-c-Myc OE cells. B, Representative images of ACLY immunofluorescence (IF) staining in lung cancer tissue and the adjacent normal lung tissue from a nonsmoker chromate worker. The merged images are overlaid images of ACLY staining in red fluorescence with nuclear DNA 4′-6-diamidino-2-phenylindole (DAPI) staining in blue fluorescence. Similar ACLY staining patterns were observed in 2 additional chromate worker lung cancer and adjacent normal lung tissues. C, Quantitative results of ACLY positive IF staining in lung cancer tissues and adjacent normal lung tissues from randomly selected 10–12 fields of each of 3 chromate worker lung tissue slides (mean ± SD, n = 3). *p < .05, compared with adjacent normal lung tissues. D, Relative cellular acetyl-CoA levels of BEAS-2B-Cr(VI) cells treated with a vehicle control or an ACLY inhibitor SB204990 (30 µM) for 24 h (mean ± SD, n = 3). E, Representative Western blot analysis of ACLY, Ac-H3K9, Ac-H3K27, Total H3, Ac-H2B, Total H2B, Ac-H4, and Total H4 protein levels in BEAS-2B-Cr(VI) treated with a vehicle control or an ACLY inhibitor SB204990 (30 µM) for 24 h. F, Representative images and the quantitative results of the clonogenic assay of BEAS-2B-Cr(VI) cells treated with a vehicle control or an ACLY inhibitor SB204990 (30 µM) (mean ± SD, n = 3). G, Representative images and the quantitative results of suspension culture sphere formation assay of BEAS-2B-Cr(VI) cells treated with a vehicle control or an ACLY inhibitor SB204990 (30 µM) (mean ± SD, n = 3). *p < .05, compared with the vehicle control-treated cells.](https://oup.silverchair-cdn.com/oup/backfile/Content_public/Journal/toxsci/177/1/10.1093_toxsci_kfaa086/2/m_kfaa086f3.jpeg?Expires=1750246852&Signature=tH0o3nQlzat1md51Uj0nwU7Xny~IR9FT8-qh-fNc6fYfTpP3Ee2QOk6s-XM2tBM9UybworMaL8QgPYyWblgsbjz3IpzFEHx9Y4BsPLp3JxzD4F8PcqUiWWDxLDvi4YEG~x17DWokuBFtcJ7ZFaOsbU8rVDf3AHUGIvCP9F7~q6Gs8C7YbpLiAHns-1Nk6fSe0y1Nrh7KkCVuWf5AE8eSck1WAi60fkA-fq1a3JI2GgBGd7a1YoByB-2cBoz3x2F8AOaF78o17Z7VlrAftiUIQgCBH08Mf7UVqbUOiESO8iQzb3pRWPLl4RjibysN00bYe594ehHCcDA8xb7b2Qa45g__&Key-Pair-Id=APKAIE5G5CRDK6RD3PGA)
The elevated level of acetyl coenzyme A (acetyl-CoA) and increased-histone acetylation in hexavalent chromium [Cr(VI)]-transformed cells result from ATP citrate lyase (ACLY) upregulation. A, Representative Western blot analysis of ACLY protein levels in BEAS-2B-Control and BEAS-2B-Cr(VI); BEAS-2B-Cr(VI)-Control shRNA and BEAS-2B-Cr(VI)-c-Myc shRNA; BEAS-2B-Vector control and BEAS-2B-c-Myc OE cells. B, Representative images of ACLY immunofluorescence (IF) staining in lung cancer tissue and the adjacent normal lung tissue from a nonsmoker chromate worker. The merged images are overlaid images of ACLY staining in red fluorescence with nuclear DNA 4′-6-diamidino-2-phenylindole (DAPI) staining in blue fluorescence. Similar ACLY staining patterns were observed in 2 additional chromate worker lung cancer and adjacent normal lung tissues. C, Quantitative results of ACLY positive IF staining in lung cancer tissues and adjacent normal lung tissues from randomly selected 10–12 fields of each of 3 chromate worker lung tissue slides (mean ± SD, n = 3). *p < .05, compared with adjacent normal lung tissues. D, Relative cellular acetyl-CoA levels of BEAS-2B-Cr(VI) cells treated with a vehicle control or an ACLY inhibitor SB204990 (30 µM) for 24 h (mean ± SD, n = 3). E, Representative Western blot analysis of ACLY, Ac-H3K9, Ac-H3K27, Total H3, Ac-H2B, Total H2B, Ac-H4, and Total H4 protein levels in BEAS-2B-Cr(VI) treated with a vehicle control or an ACLY inhibitor SB204990 (30 µM) for 24 h. F, Representative images and the quantitative results of the clonogenic assay of BEAS-2B-Cr(VI) cells treated with a vehicle control or an ACLY inhibitor SB204990 (30 µM) (mean ± SD, n = 3). G, Representative images and the quantitative results of suspension culture sphere formation assay of BEAS-2B-Cr(VI) cells treated with a vehicle control or an ACLY inhibitor SB204990 (30 µM) (mean ± SD, n = 3). *p < .05, compared with the vehicle control-treated cells.
Some studies have shown that ACLY upregulation plays important roles in cancer (Migita et al., 2008; Zhao et al., 2014). We next determined whether ACLY plays a role in the proliferation and CSC-like property of Cr(VI)-transformed cells. The clonogenic assay showed that the inhibition of ACLY activity significantly reduces the clone forming capability of Cr(VI)-transformed cells (Figure 3F), suggesting that ACLY activity is critical for Cr(VI)-transformed cell growth. Moreover, inhibition of ACLY activity also significantly decreases the suspension culture sphere forming ability of Cr(VI)-transformed cells (Figure 3G), indicating that ACLY activity plays an important role in the CSC-like property of Cr(VI)-transformed cells.
The Upregulation of Acetylation Leads to Increased Expression of ACLY in Cr(VI)-transformed Cells
Our results demonstrated that ACLY inhibition decreases acetyl-CoA production and histone acetylation levels in Cr(VI)-transformed cells. Next, we investigated the mechanism of how ACLY expression is upregulated in Cr(VI)-transformed cells. First, our qPCR analysis results showed that ACLY mRNA levels are significantly increased in Cr(VI)-transformed cells (Figure 4A), suggesting that ACLY gene transcription is increased. Enrichment of histone acetylation in a gene promoter region is associated with increased gene transcription. Considering that histone acetylation marks are drastically increased in Cr(VI)-transformed cells, we decided to investigate the hypothesis that the upregulation of ACLY expression is at least partially due to the increased enrichment of histone acetylation mark at the ACLY gene promoter region. To test this hypothesis, acetyl-histone 3 antibody was used for the ChIP from Cr(VI)-transformed cells and passage-matched control cells. Our ChIP results showed that the enrichment of histone 3 acetylation mark was significantly increased in the ACLY gene promoter region of Cr(VI)-transformed cells (Figure 4B), demonstrating that ACLY upregulation is at least partially due to the increased enrichment of H3 acetylation mark at the ACLY gene promoter region, which facilitates ACLY gene transcription.
![The upregulation of protein acetylation leads to the increased expression of ATP citrate lyase (ACLY) in hexavalent chromium [Cr(VI)]-transformed cells. A, The mRNA level of ACLY in BEAS-2B-Control and BEAS-2B-Cr(VI) cells analyzed by quantitative PCR (qPCR) (mean ± SD, n = 3). *p < .05, compared with BEAS-2B-Control cells. B, Chromatin immunoprecipitation (ChIP)-qPCR analysis of Ac-Histone3 enrichment in ACLY promoter region in BEAS-2B-Control and BEAS-2B-Cr(VI) cells. The results are expressed as percent input (mean ± SD, n = 3). *p < .05, compared with BEAS-2B-Control cells. C, Representative Western blot analysis of ACLY protein levels in BEAS-2B-Cr(VI) treated with nicotinamide (NAM) (10 mM) and/or MG132 (10 µM). D and E, Representative Western blot analysis of ACLY protein levels in BEAS-2B-Cr(VI) (D) and BEAS-2B-Control (E) cells treated with cycloheximide (CHX) (10 µM) alone, or pretreated with NAM (10 mM) for 8-h plus CHX treatment for 0.5, 1, 2, and 4 h. The quantitative results are presented as mean ± SD (n = 3). *p < .05, compared with BEAS-2B-Cr(VI) vehicle control treatment group. F, Representative Western blot analysis of ACLY and ubiquitin protein levels from the ACLY immunoprecipitation experiment using BEAS-2B-Cr(VI) cells treated with a vehicle control or NAM (10 mM) for 8 h. ACLY was immunoprecipitated and ACLY protein and ubiquitilated ACLY levels were detected by Western blot.](https://oup.silverchair-cdn.com/oup/backfile/Content_public/Journal/toxsci/177/1/10.1093_toxsci_kfaa086/2/m_kfaa086f4.jpeg?Expires=1750246852&Signature=rJZDPxyRwEt4R8oN1j6maD1eLxHclupsCY3QJL5O1k3sneMAsUOGYyJcFSbdOdaBS5p7EBZ3WrMvEBhbx6WNeboRJX6MeNFM~W~SlyuC5C1DzIxN-6uV4eVRo0mbUs1KC9f6qVM~0zSj4LNplE8okSkUJUHYoJKEinX6qO0HkO6BTiMNysJv8V5d4enU~3Fk~LC01GBhPNHSDrogDX~ugHPkv5cftFeFbfS~NaoSCtukpqoPswmxIhxDluR-V0ibjECZTYBp~Vyus8EbAz9oKctfGwOIZ~CrxoQrXvjZtUpnE5YHGhap8ssH2qIV4luBHaXHQftClyd4AENUzd0YjQ__&Key-Pair-Id=APKAIE5G5CRDK6RD3PGA)
The upregulation of protein acetylation leads to the increased expression of ATP citrate lyase (ACLY) in hexavalent chromium [Cr(VI)]-transformed cells. A, The mRNA level of ACLY in BEAS-2B-Control and BEAS-2B-Cr(VI) cells analyzed by quantitative PCR (qPCR) (mean ± SD, n = 3). *p < .05, compared with BEAS-2B-Control cells. B, Chromatin immunoprecipitation (ChIP)-qPCR analysis of Ac-Histone3 enrichment in ACLY promoter region in BEAS-2B-Control and BEAS-2B-Cr(VI) cells. The results are expressed as percent input (mean ± SD, n = 3). *p < .05, compared with BEAS-2B-Control cells. C, Representative Western blot analysis of ACLY protein levels in BEAS-2B-Cr(VI) treated with nicotinamide (NAM) (10 mM) and/or MG132 (10 µM). D and E, Representative Western blot analysis of ACLY protein levels in BEAS-2B-Cr(VI) (D) and BEAS-2B-Control (E) cells treated with cycloheximide (CHX) (10 µM) alone, or pretreated with NAM (10 mM) for 8-h plus CHX treatment for 0.5, 1, 2, and 4 h. The quantitative results are presented as mean ± SD (n = 3). *p < .05, compared with BEAS-2B-Cr(VI) vehicle control treatment group. F, Representative Western blot analysis of ACLY and ubiquitin protein levels from the ACLY immunoprecipitation experiment using BEAS-2B-Cr(VI) cells treated with a vehicle control or NAM (10 mM) for 8 h. ACLY was immunoprecipitated and ACLY protein and ubiquitilated ACLY levels were detected by Western blot.
In addition, previous studies have shown that the upregulation of ACLY levels could also be achieved by increasing ACLY protein acetylation to reduce its ubiquitination and prevent ACLY proteasome degradation (Guo et al., 2019; Zhao et al., 2014). Deacetylation of ACLY protein by the protein deacetylase sirtuin 2 (SIRT2) destabilizes ACLY protein and promotes its ubiquitination and subsequent proteasome degradation (Lin et al., 2013). To determine whether ACLY protein acetylation and deacetylation also plays a role in ACLY upregulation in our cell model, we treated Cr(VI)-transformed cells with a SIRT protein deacetylase family inhibitor NAM and a proteasome inhibitor MG132. It was found that the SIRT protein deacetylase inhibitor NAM treatment is capable of increasing ACLY protein levels in Cr(VI)-transformed cells (Figure 4C), which is likely due to the fact that the inhibition of SIRT family protein deacetylases by NAM increases ACLY protein acetylation and reduces ACLY ubiquitination, preventing its proteasome degradation. Indeed, NAM treatment combined with the proteasome inhibitor MG132 treatment could further increase ACLY protein levels (Figure 4C). Moreover, when new protein synthesis is inhibited by the CHX treatment in Cr(VI)-transformed cells, NAM treatment significantly reduces the rate of ACLY protein levels decreasing (Figure 4D), suggesting that NAM treatment increases ACLY protein stability. However, in passage-matched control cells, the NAM treatment did not have a significant effect on ACLY protein levels (Figure 4E), which is likely due to the fact that ACLY protein levels are significantly lower in the control cells (Figure 3A) or that the protein deacetylase SIRT2 activity is low in the control cells. Further Co-IP experiment showed that NAM treatment drastically reduces the level of ACLY protein ubiquitination in Cr(VI)-transformed cells (Figure 4F). Together, these results suggest that increased acetylation levels of both histone and ACLY protein contribute to the upregulation of ACLY levels in Cr(VI)-transformed cells.
The Upregulation of ACLY Increases c-Myc Expression, Forming a Positive Feedback Loop and Promoting Metabolic Shift in Cr(VI)-transformed Cells
Our recent study showed that c-Myc expression is upregulated resulting from the decreased level of microRNA-494 (miR-494) in Cr(VI)-transformed cells (Wang et al., 2019a). MicroRNAs usually regulate gene expression at the posttranscriptional level (Humphries et al., 2019). As mentioned earlier, the levels of several histone acetylation marks are increased in Cr(VI)-transformed cells and increased histone acetylation is associated with an open chromatin structure facilitating gene transcription. We sought to determine whether the upregulation of c-Myc expression in Cr(VI)-transformed cells also occurs at the transcription level due to the increased histone acetylation. First, our qPCR analysis revealed that the mRNA level of c-Myc is significantly higher in Cr(VI)-transformed cells (Figure 5A), suggesting that c-Myc gene transcription is increased. We next performed ChIP assay using acetyl-histone 3 antibody for ChIP of Cr(VI)-transformed cells and their passage-matched control cells. It was found that the enrichment of histone 3 acetylation mark in the c-Myc gene promoter region is significantly higher than that in the control cells (Figure 5B). Together, these results indicate that increased c-Myc gene transcription mediated by the high level of histone acetylation also contributes to the upregulation of c-Myc expression levels in Cr(VI)-transformed cells.
![The upregulation of ATP citrate lyase (ACLY) increases c-Myc expression, forming a positive feedback loop and promoting glycolytic shift in hexavalent chromium [Cr(VI)]-transformed cells. A, The mRNA levels of c-Myc in BEAS-2B-Control and BEAS-2B-Cr(VI) cells analyzed by quantitative PCR (qPCR) (mean ± SD, n = 3). *p < .05, compared with BEAS-2B-Control cells. B, Chromatin immunoprecipitation (ChIP)-qPCR analysis of Ac-Histone3 enrichment in the c-Myc promoter region in BEAS-2B-Control and BEAS-2B-Cr(VI) cells. The results are expressed as percent input (mean ± SD, n = 3). *p < .05, compared with BEAS-2B-Control cells. C, Representative Western blot analysis of c-Myc protein levels in BEAS-2B-Cr(VI) cells treated with a vehicle control or an ACLY inhibitor SB204990 (30 µM) for 24 h. D, Seahorse glycolytic stress tests in BEAS-2B-Cr(VI) cells treated with a vehicle control or an ACLY inhibitor SB204990 (30 µM) for 24 h (mean ± SD, n = 8) *p < .05, compared with BEAS-2B-Cr(VI) vehicle control treatment.](https://oup.silverchair-cdn.com/oup/backfile/Content_public/Journal/toxsci/177/1/10.1093_toxsci_kfaa086/2/m_kfaa086f5.jpeg?Expires=1750246852&Signature=g27UqTfxCY5DRSfjr8pD3l42sNuPncnF6gBWZKwXIMoW6Uim5d7Dmb9WZRfgqBMJz5~MmIgK3E7oedbk35O16okzOXp~aMuW242rPRpbpH7Vftle1btfMfPuUjvmtzEoYVr7YuayCCTQHIiEneo8QfwA7fk-cIGAqrLcBbKKRJn9VaDk4K1pa8jscXbn9yEL3dRoh~Cwra2SHbR9Uw4URrL1RIdgiwS3zTbpYky2ddUkvCKufrzzAhrCjtg7OLj-ujZgP-n-vavazIGTfd69heI~u0-~adFEltWHL536ItIRxbCf8AOM4n1hI7PE7sjYMENgPPM0yzDvCXeI2pDQbg__&Key-Pair-Id=APKAIE5G5CRDK6RD3PGA)
The upregulation of ATP citrate lyase (ACLY) increases c-Myc expression, forming a positive feedback loop and promoting glycolytic shift in hexavalent chromium [Cr(VI)]-transformed cells. A, The mRNA levels of c-Myc in BEAS-2B-Control and BEAS-2B-Cr(VI) cells analyzed by quantitative PCR (qPCR) (mean ± SD, n = 3). *p < .05, compared with BEAS-2B-Control cells. B, Chromatin immunoprecipitation (ChIP)-qPCR analysis of Ac-Histone3 enrichment in the c-Myc promoter region in BEAS-2B-Control and BEAS-2B-Cr(VI) cells. The results are expressed as percent input (mean ± SD, n = 3). *p < .05, compared with BEAS-2B-Control cells. C, Representative Western blot analysis of c-Myc protein levels in BEAS-2B-Cr(VI) cells treated with a vehicle control or an ACLY inhibitor SB204990 (30 µM) for 24 h. D, Seahorse glycolytic stress tests in BEAS-2B-Cr(VI) cells treated with a vehicle control or an ACLY inhibitor SB204990 (30 µM) for 24 h (mean ± SD, n = 8) *p < .05, compared with BEAS-2B-Cr(VI) vehicle control treatment.
As we determined that ACLY inhibition reduces the acetyl-CoA and histone acetylation levels (Figure 3), we next determined whether ACLY inhibition also decreases c-Myc expression levels. It was observed that the inhibition of ACLY activity by the treatment with ACLY inhibitor SB204990 reduces c-Myc protein levels in Cr(VI)-transformed cells (Figure 5C). This is likely due to the fact that inhibition of ACLY reduces the levels of acetyl-CoA and histone acetylation (Figure 3), which in turn decreases c-Myc gene transcription downregulating its expression.
In Figure 1, we showed that Cr(VI)-transformed cells undergo glycolytic shift depending on the upregulation of c-Myc expression. Therefore, we decided to investigate if ACLY inhibition which reduces the level of c-Myc expression could reverse the glycolytic shift in Cr(VI)-transformed cells. Indeed, our results from the Seahorse glycolysis stress test analysis showed that treatment with ACLY inhibitor SB204990 reverses glycolytic shift in Cr(VI)-transformed cells (Figure 5D).
Taken together, these results along with the above findings showing that the upregulation of c-Myc expression increases the level of ACLY demonstrate a positive feedback loop between the upregulation of c-Myc and ACLY expression, which promotes glycolytic shift in Cr(VI)-transformed cells.
Glucose Depletion Reverses Glycolytic Shift in Cr(VI)-transformed Cells and Impairs Their CSC-like Property and Tumorigenicity
Cancer cells primarily rely on glycolysis-mediated glucose metabolism for ATP generation and use glycolytic intermediates as anabolic building blocks to maintain some cancer hallmarks (Gillies et al., 2008; Pavlova and Thompson, 2016). We further determined whether glycolytic shift in Cr(VI)-transformed cells plays an important role in maintaining their malignant phenotypes such as enhanced cell proliferation, CSC-like property, and tumorigenicity. We removed glucose from Cr(VI)-transformed cell culture medium by replacing glucose with galactose. Although galactose could be converted to glucose-6-phosphate and enter the glycolytic pathway; breakdown of galactose via glycolysis to produce pyruvate has no net ATP generation, forcing cells to utilize mitochondrial OXPHOS to generate ATP (Hardonnière et al., 2016). It was found that the removal of glucose from Cr(VI)-transformed cells’ culture medium significantly reduces glycolysis and glycolytic capacity (Figure 6A). Western blot analysis revealed that glucose depletion greatly decreases the protein levels of c-Myc, ACLY, and several key rate-limiting glycolytic pathway enzymes including HK2, PFK, and LDH (Figure 6B). Moreover, the levels of several histone acetylation marks and cellular acetyl-CoA levels are also greatly reduced by glucose depletion (Figs. 6B and 6C).
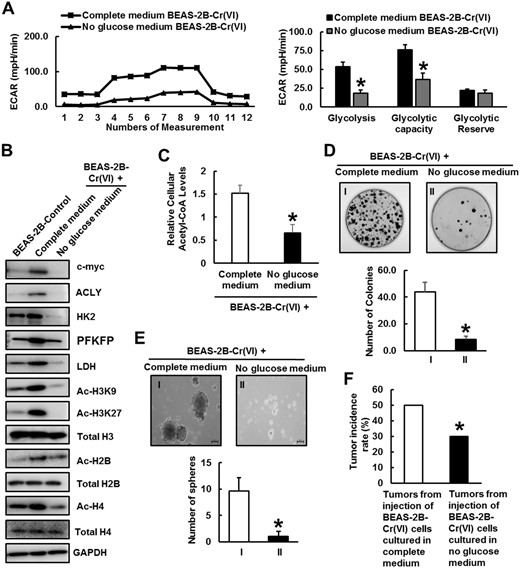
Glucose depletion reverses glycolytic shift in Cr(VI)-transformed cells and impairs their cancer stem cell-like property and tumorigenicity. A, Seahorse glycolytic stress tests of BEAS-2B-Cr(VI) cells cultured in complete medium or no glucose medium, respectively. The quantitative results are presented as mean ± SD (n = 8) *p < .05, compared with BEAS-2B-Cr(VI) cells cultured in complete medium. B, Representative Western blot analysis of c-Myc, hexokinase-2 (HK2), phosphofructokinase (PFK), lactate dehydrogenase (LDH), ATP citrate lyase (ACLY), Ac-H3K9, Ac-H3K27, Total H3, Ac-H2B, Total H2B, Ac-H4, and Total H4 protein levels in BEAS-2B-Control, BEAS-2B-Cr(VI) cells cultured in complete medium or no glucose medium. C, Relative cellular acetyl coenzyme A levels of BEAS-2B-Cr(VI) cells cultured in complete medium or no glucose medium (mean ± SD, n = 3). *p < .05, compared with BEAS-2B-Cr(VI) cells cultured in complete medium. D, Representative images and quantitative results of clonogenic assay of BEAS-2B-Cr(VI) cells cultured in complete medium or no glucose medium (mean ± SD, n = 3). *p < .05, compared with BEAS-2B-Cr(VI) cells cultured in complete medium. E, Representative images and quantitative results of suspension culture sphere formation assays of BEAS-2B-Cr(VI) cells cultured in complete medium or no glucose medium (mean ± SD, n = 3). *p < .05, compared with BEAS-2B-Cr(VI) cells cultured in complete medium. F, Nude mouse tumor forming rates of BEAS-2B-Cr(VI) cells cultured in complete medium or no glucose medium (n = 20). *p < .05, compared with BEAS-2B-Cr(VI) cells cultured in complete medium. Abbreviation: ECAR, Extracellular Acidification Rate.
Next, we investigated the effect of glucose depletion on the malignant phenotypes of Cr(VI)-transformed cells. The clonogenic and suspension culture sphere formation assays showed that Cr(VI)-transformed cells cultured in no glucose medium form significantly less colonies (Figure 6C) and spheres (Figure 6D), indicating that glucose depletion significantly reduces Cr(VI)-transformed cell growth and CSC-like property, respectively. Moreover, when injected into nude mice, Cr(VI)-transformed cells cultured in no glucose medium form significantly less tumors (Figure 6E), indicating that glucose depletion significantly decreases the tumorigenicity of Cr(VI)-transformed cells. Together, these results suggest that glycolytic shift and glycolysis-mediated glucose metabolism play critical roles in maintaining the malignant phenotypes of Cr(VI)-transformed cells.
DISCUSSION
Although it is well known that Cr(VI) is one of the most common environmental carcinogens causing lung cancer and other types of cancer, the mechanism of Cr(VI) carcinogenesis has not been clearly defined. Studies have shown that metabolism dysregulation plays critical roles in cancer development and progression (Gillies et al., 2008; Pavlova and Thompson, 2016). However, little is known about whether chronic Cr(VI) exposure causes metabolic dysregulation and whether metabolism reprograming plays an important role in Cr(VI) carcinogenesis. Our recent study showed that chronic Cr(VI) exposure significantly increases the level of the proto oncogene c-Myc and that the upregulation of c-Myc expression plays a crucial role in Cr(VI)-induced cell transformation, CSC-like property and tumorigenesis (Wang et al., 2019a). Because c-Myc is a key player in cancer cell metabolism dysregulation (Dang, 2013; Dang et al., 2009), the upregulation of c-Myc expression implies that chronic Cr(VI) exposure may cause metabolism dysregulation. In addition, recent studies have shown that mRNA levels of some genes involved in glycolysis pathway and lactate production are increased in Cr(VI)-transformed cells (Clementino et al., 2018; Dai et al., 2017), providing additional evidence to support that Cr(VI)-transformed cells may have a metabolic shift. By using the Seahorse Metabolic Analyzer, it was demonstrated in this study that Cr(VI)-transformed cells display abnormal metabolism as evidenced by the increased glycolysis or glycolytic shift (Figure 1). Subsequent mechanistic studies determined that glycolytic shift in Cr(VI)-transformed cells depends on the upregulation of c-Myc expression (Figure 1). It is important to emphasize that cells used in this study were transformed by exposure to 0.25 µM of K2Cr2O7 [25.7 µg of Cr(VI)/l] for 20 weeks, which is occupational chromate exposure relevant. It was reported that the average chromium level in the lungs of chromate workers are 51.5 µg/g of lung tissue (range: 24.8–210 µg/g of lung tissue) (Kishi et al., 1987). The mean urine chromium concentration in chromate workers was about 20.6 µg/dl (range: 12.0–36.0 µg/dl) (equals to 206 µg/l, range: 120–360 µg/l) (Tachi et al., 1961).
How does the upregulation of c-Myc expression lead to glycolytic shift in Cr(VI)-transformed cells? One potential underlying mechanism is that c-Myc is a transcription factor capable of increasing the expression of critical genes in the glycolytic pathway (Miller et al., 2012). Indeed, our Western blot analysis demonstrated that the protein levels of several important glycolysis regulatory enzymes such as HK2, PFK, and LDH are increased in Cr(VI)-transformed cells (Figure 1). It was further determined that stably knocking down c-Myc expression or overexpressing c-Myc greatly reduces or increases the protein levels of these glycolysis regulatory enzymes, respectively (Figure 1). It is thus likely that chronic Cr(VI) exposure induces c-Myc expression, which in turn upregulates the expression of several critical glycolysis regulatory enzymes to cause metabolic shift toward glycolysis.
What is the significance of glycolytic shift in Cr(VI) carcinogenesis? It is known that cancer cells usually display uncontrolled and accelerated growth. Cancer cells adapt their metabolism to glycolysis, which not only provides the energy supply for cancer cells, but also provides a large amount of materials (such as glycolytic intermediate products) for the synthesis of cellular macromolecules to support their rapid growth (Gillies et al., 2008; Pavlova and Thompson, 2016). Increased glycolysis is thus considered to play an important role in maintaining some cancer hallmarks (Gillies et al., 2008). In this study, it was demonstrated that depletion of glucose in the culture media not only reverses glycolytic shift, but also significantly reduces the growth, CSC-like property and tumorigenicity of Cr(VI)-transformed cells (Figure 6). These findings indicate that glycolytic shift plays a critical role in maintaining the malignant phenotypes of Cr(VI)-transformed cells, suggesting that glycolytic shift has an important role in Cr(VI) carcinogenesis. However, further studies are needed to determine whether glycolytic shift occurs at the early stage of Cr(VI) exposure and whether it plays a causal role in Cr(VI) exposure-induced cell malignant transformation, CSC-like property and tumorigenesis.
Ours and other studies have shown that Cr(VI) exposure also causes epigenetic dysregulations (Wang et al., 2018; Wang and Yang, 2019), which may play important roles in Cr(VI) carcinogenesis. However, how Cr(VI) exposure causes epigenetic dysregulations has not been well understood. Interestingly, studies have shown there are inter-regulations or cross talks between metabolism and epigenetics (Yu et al., 2018; Zhao et al., 2014). For example, whereas the expression levels of important metabolic enzymes could be regulated by epigenetic mechanisms, several metabolic products such as acetyl-CoA and SAM serve as critical substrates for important epigenetic modification enzymes such as HATs, DNA and histone methyl transferases, respectively. The existence of inter-regulations between metabolism and epigenetics suggests that on one hand, metabolism dysregulation could lead to epigenetic dysregulation. On the other hand, dysregulated epigenetics such as increased histone acetylation could upregulate the expression levels of key metabolic enzymes causing metabolism reprograming. In this study, we found that c-Myc upregulation in Cr(VI)-transformed cells promotes glycolytic shift, which increases the level of acetyl-CoA and the subsequent upregulation of histone acetylation and nonhistone protein acetylation (Figs. 2 and 3). The upregulation of acetylation increases the expression of ACLY and c-Myc, forming a positive feedback loop to further promote glycolytic shift in Cr(VI)-transformed cells (Figs. 4 and 5). In this regard, glycolytic shift in Cr(VI)-transformed cells not only provides an alternative mechanistic explanation for the epigenetic dysregulations by Cr(VI) exposure, but also offers additional evidence supporting its important role in Cr(VI) carcinogenesis.
In summary, this study demonstrated that chronic Cr(VI) exposure-transformed cells display a glycolytic shift. Mechanistic studies revealed that the glycolytic shift in Cr(VI)-transformed cells depends on the upregulation of the proto oncogene c-Myc expression. It was further determined that glycolytic shift in Cr(VI)-transformed cells leads to an increased-production of acetyl-CoA and the elevation of histone acetylation, which in turn upregulates the expression of a key acetyl-CoA production enzyme ACLY and the expression of c-Myc. This results in the formation of a positive feedback loop between the upregulation of c-Myc expression, glycolytic shift and increased-histone acetylation. Furthermore, glucose depletion not only reversed the glycolytic shift in Cr(VI)-transformed cells, but also significantly reduced their transformed malignant phenotypes. Together, these findings suggest that metabolism dysregulation plays an important role in Cr(VI) carcinogenesis.
SUPPLEMENTARY DATA
Supplementary data are available at Toxicological Sciences online.
FUNDING
National Institutes of Health/National Institute of Environmental Health Sciences (R01ES029496, R01ES026151, R01ES029942, P30ES026529); the University of Kentucky Center for Appalachian Research in Environmental Sciences Career Development Award. This research was also supported by the Shared Resources Facilities on Redox Metabolism and Biospecimen Procurement and Translational Pathology at University of Kentucky Markey Cancer Center (P30CA177558).
AUTHOR CONTRIBUTIONS
M.C., C.Y., and Z.W. contributed to overall experimental design. M.C. performed all experiments and data analysis. J.X. and P.Y. contributed to immunoblotting analysis, in vivo tumorigenesis, and chemical treatments. H.L. contributed to qPCR analysis and sphere formation protocols, and Y.L. contributed to in vivo tumorigenesis. W.K.F. and H.T. provided operational support for most experiments. K.K. provided chromate worker lung cancer tissue slides. M.C. drafted the manuscript with the assistance from W.K.F., C.Y., and Z.W. revised the manuscript. Z.W. supervised the research.
DECLARATION OF CONFLICTING INTERESTS
The authors declared no potential conflicts of interest with respect to the research, authorship, and/or publication of this article.
REFERENCES
International Agency for Research on Cancer. (

Comments