


Abstract
In a mouse model, rifampicin and isoniazid combination treatment results in cholestatic liver injury that is associated with an increase in protoporphyrin IX, the penultimate heme precursor. Both ferrochelatase (FECH/Fech) and aminolevulinic acid synthase 1 (ALAS1/Alas1) are crucial enzymes in regulating heme biosynthesis. Isoniazid has recently been reported to upregulate Alas1 but downregulate Fech protein levels in mice; however, the mechanism by which isoniazid mediates disruption of heme synthesis has been unclear. Two metabolites of isoniazid, pyridoxal isonicotinoyl hydrazone (PIH, the isoniazid-vitamin B6 conjugate) and hydrazine, have been detected in the urine of humans treated with isoniazid. Here we show that, in primary human hepatocytes and the human hepatocellular carcinoma cell line HepG2/C3A, (1) isoniazid treatment increases Alas1 protein levels but decreases Fech levels; (2) hydrazine treatment upregulates Alas1 protein and Alas1 mRNA levels; (3) PIH treatment decreases Fech protein levels, but not Fech mRNA levels; and (4) PIH is detected after isoniazid treatment, with levels increasing further when exogenous vitamin B6 analogs are coadministered. In addition, the PIH-mediated downregulation of human FECH is associated with iron chelation. Together, these data demonstrate that hydrazine upregulates ALAS1, whereas PIH downregulates FECH, suggesting that the metabolites of isoniazid mediate its disruption of heme biosynthesis by contributing to protoporphyrin IX accumulation.
Heme is an essential cofactor for cytochrome P450 (CYP450) function, and the demand for heme increases as xenobiotic metabolism increases. Drug-induced disruption of the heme biosynthesis pathway has been implicated in the hepatotoxicity of antitubercular therapy (Li et al., 2013). Rifampicin and isoniazid, which are first-line drugs in antitubercular regimens, have been associated with a human pregnane X receptor (hPXR)-dependent, cholestatic pattern of hepatotoxicity in hPXR transgenic mice. Rifampicin is a well-characterized agonist of hPXR, a nuclear hormone receptor that upregulates the transcription of many genes encoding CYP450 enzymes or xenobiotic transporters (Brewer and Chen, 2016, 2017; Oladimeji et al., 2017; Wang et al., 2014; Watkins et al., 2003). Isoniazid treatment downregulates the level of mouse ferrochelatase (Fech) and upregulates that of δ-aminolevulinic acid synthase 1 (ALAS1/Alas1), 2 pivotal enzymes in heme biosynthesis. However, isoniazid does not affect Fech or Alas1 mRNA levels in mice (Sachar et al., 2016). Protoporphyrin IX (PPIX), the penultimate metabolite of heme biosynthesis, has been implicated in cholestasis of various etiologies in mice and humans. The PPIX is cytotoxic (Weiss et al., 2003) and reduces bile flow, leading to cholestasis and liver injury (Perez-Barriocanal et al., 1989). Protoporphyrin IX accumulation is associated with liver injury in mice when exogenously applied and with genetic or pharmacologic dysfunction of the heme biosynthetic pathway (Davies et al., 2005; Lyoumi et al., 2011). In view of these findings, we investigated whether and how isoniazid affected human ALAS1 and FECH.
FECH/Fech catalyzes the last enzymatic step in heme biosynthesis in mammals, the incorporation of an iron ion into the porphyrin ring of PPIX to form heme. FECH/Fech is expressed in the livers of humans and mice. Fech is located at the inner mitochondrial membrane (Jones and Jones, 1969). After translation, FECH/Fech is directed to the mitochondria by an N-terminal mitochondrial-localization sequence, which is cleaved to form the mature protein. FECH/Fech also has a C-terminal iron-sulfur [2Fe-2S] cluster, not involved in the enzyme activity. The C-terminal domain contains most of the cysteine residues constituting this cluster (Sellers et al., 1998). FECH may undergo a structural change when [2Fe-2S] center formation is impaired by the iron chelator deferoxamine, possibly leading to FECH degradation in low-iron conditions (Crooks et al., 2010; Taketani et al., 2000). Translation of Fech mRNA was unaffected by iron depletion in mouse erythroleukemia cells. Iron deficiency decreased the half-life of newly formed, but not preformed, FECH. Radiolabeled Fech formed after the onset of deferoxamine treatment was more susceptible to the treatment than was Fech radiolabeled and formed before the treatment. Indeed, the latter had a half-life of approximately 35 h, compared with less than 1 h for Fech formed after treatment (Crooks et al., 2010).
Aminolevulinic acid synthase 1 (ALAS1)/Alas1 catalyzes the condensation of succinyl CoA and glycine, the first and rate-limiting step in heme biosynthesis, with pyridoxal 5′-phosphate serving as a cofactor in the mitochondrial matrix (Ferreira and Gong, 1995). Aminolevulinic acid synthase is expressed predominately in the liver (ALAS1/Alas1) and bone marrow (ALAS2/Alas2). Alas1 is translated as a proenzyme, with an N-terminal mitochondrial-localization sequence of 49 amino acids that is required for mitochondrial importation (Goodfellow et al., 2001). Aminolevulinic acid synthase 1 expression may be regulated by xenobiotic receptors to increase the synthesis of heme for incorporation into enzymes such as CYP450s. Indeed, 2 enhancer elements 20–16 kb upstream of the transcriptional start site of ALAS1 are responsive to hPXR and hCAR (Podvinec et al., 2004). In contrast, ALAS1 transcription is repressed by heme via feedback inhibition by the product of the heme biosynthesis pathway (Zheng et al., 2008).
MATERIALS AND METHODS
Chemicals
Reagents were obtained from the following sources: The chemical SPA70 was prepared by WuXi Apptec (Shanghai, China) (Lin et al., 2017). Dimethyl sulfoxide (DMSO) was obtained from Corning (Corning, New York); Dulbecco’s phosphate-buffered saline (PBS), sodium pyruvate, penicillin-streptomycin, GlutaMAX, William’s E medium supplemented with cell maintenance cocktail B, and minimum essential medium (MEM) from Gibco (Little Rock, Arkansas); rifampicin, isoniazid, acetyl-nitrile, methanol, pyrogallol, 1,2-diacetylhydrazine, hydrazine, chrome azurol S (CAS), 5-sulfosalicyclic acid dihydrate, Chelex 100, and deferoxamine mesylate from Sigma-Aldrich (St Louis, Missouri); pyridoxal 5′-phosphate, pyridoxal hydrochloride, and iron (III) chloride from Acros Organics (Beel, Belgium); pyridoxal isonicotinoyl hydrazone from Cayman Chemical (Ann Arbor, Michigan); pyridoxine hydrochloride from MP Biomedicals (Solon, Ohio); Eagle’s MEM (EMEM) from American Type Culture Collection (ATCC) (Manassas, Virginia); charcoal/dextran-treated fetal bovine serum (FBS) (lot number: AZE190136) and FBS (lot number: AC10240623) (26 µM iron) from HyClone (Logan, Utah); menadione from Adipogen (San Diego, California); acetyl-isoniazid and anhydrous piperazine from Toronto Research Chemicals (Toronto, ON); acetyl-hydrazine from Oakwood Chemical (Estill, South Carolina); Noc-18 from Santa Cruz Biotechnologies (Dallas, Texas); and hexadecyltrimethyl ammonium bromide from Chem Service (West Chester, Pennsylvania).
Antibodies
Membranes were incubated with primary antibody overnight at 4°C then incubated with secondary antibody (diluted 1:10 000) for 1 h at room temperature (RT). Anti-FECH mouse monoclonal antibody (sc-377377) was obtained from Santa Cruz Biotechnology and was used at a dilution of 1:5000. Anti-ALAS1 mouse monoclonal antibody (ab54758) was obtained from Abcam (Cambridge, UK) and was used at a dilution of 1:2000. Anti-Cyp3a mouse monoclonal antibody (MAB10041) was obtained from EMD Millipore (Burlington, Massachusetts) and used at a dilution of 1:1000. Anti-CYP3A4 K03 mouse monoclonal antibody (Schuetz et al., 1996; Wang et al, 2013) was used at a dilution of 1:1000. Goat antimouse IRDye-conjugated (680 RD and 800 CW) secondary antibodies from LI-COR (Cambridge, UK) were used at a dilution of 1:10 000 to visualize proteins.
Cell culture
All cell lines and primary hepatocyte cultures were maintained in an incubator at 37°C in 5% CO2. The human hepatocellular carcinoma cell line HepG2/C3A was obtained from ATCC. HepG2/C3A cells were grown in culture in EMEM containing 10% FBS, sodium pyruvate, and GlutaMAX, unless otherwise indicated in figure legends. Primary human hepatocytes (PHHs) were provided through the Liver Tissue Cell Distribution System by the University of Pittsburgh (funded by NIH contract N01-DK-7-0004/HHSN267200700004C) (samples numbered 1, 2, 3, 4, 5, 8, and 9 in this paper correspond to donor ID nos. 17-002, 17-004, 17-008 17-006, 17-009, 17-012, and 18-001, respectively) or purchased from Lonza (Durham, North Carolina) (sample no. 6 in this paper corresponds to Lonza catalog no. HUM180251) and were treated for the specified time period with the compounds indicated. Hepatocytes were grown in culture in William’s E medium supplemented with cell maintenance cocktail B from Gibco (catalog no. A13448).
Mice
The 8- to 12-week-old hPXR transgenic or Pxr−/− C57BL/6 mice were used for all in vivo experiments (Xie et al., 2000). All animal studies were approved by the Institutional Animal Care and Use Committee at St Jude Children’s Research Hospital. Animals were housed in Association for Assessment and Accreditation of Laboratory Animal Care—Accredited facilities at St Jude Children’s Research Hospital. Mice were provided with chow containing rifampicin (100 mg/kg in chow) and autoclaved water containing isoniazid (400 mg/l in water) ad libitum for 6 weeks. Serum was collected weekly to monitor liver function. Chow was obtained from Purina (St Louis, Missouri).
Western blot analysis
Adherent cells were washed with PBS, trypsinized, and collected by centrifugation at 12 000 × g for 3 min at 4°C. The supernatant was aspirated, then the cells were resuspended and centrifuged again. The supernatant was again aspirated, and the cells were resuspended in 100 µl radio-immunoprecipitation assay (RIPA) buffer from ThermoFisher Scientific (Waltham, Massachusetts) and placed on ice for 30 min. Pierce RIPA buffer was used to extract proteins from mouse liver and cell pellets. PhoSTOP phosphatase inhibitor (Roche, Branford, Connecticut) and cOmplete Mini Protease Inhibitor Cocktail (Roche) were added to the RIPA buffer, then the cells were sonicated on a Vibra-Cell Ultrasonic Liquid Processor from Sonics and Materials, Inc. (Newtown, Connecticut) and stored at −80°C until Western blot analysis was performed. The bicinchoninic acid (BCA) assay was performed with the Pierce BCA Protein Assay Kit from ThermoFisher Scientific in accordance with the manufacturer’s instructions. For each sample, 2–10 µg protein was loaded unless otherwise noted. NuPAGE LDS loading buffer and reducing agent from Invitrogen (Carlsbad, California) were used to prepare protein lysates for electrophoresis. NuPAGE 4–12% Bis-Tris Protein Gels were obtained premade from Invitrogen. The Kaleidoscope protein marker from Bio-Rad (Hercules, California) was used to estimate protein size. Proteins were then transferred from the gel to an iBlot nitrocellulose membrane (Invitrogen) by dry transfer. Before probing with primary antibodies, membranes were incubated for 1 h at RT in TBST blocking buffer (LI-COR, Lincoln, Nebraska). After visualization, membranes were stripped using NewBlot Nitro Stripping Buffer (LI-COR), incubated with anti-β-actin primary antibody (a5441; Sigma-Aldrich) (diluted 1:1000) overnight at 4°C, then incubated with secondary antibody (diluted 1:10 000) for 1 h at RT. The protein bands were visualized by using an Odyssey infrared imager (LI-COR Biosciences), and the relative intensity of each band was determined by normalizing its intensity to that of actin, as reported previously (Lin et al., 2017).
Liquid chromatography/mass spectrometry
Pyridoxal isonicotinoyl hydrazone and isoniazid were prepared as 10 mM stock solutions in DMSO. Warfarin was used as the internal standard at a concentration of 4 mg/l in acetonitrile or methanol. The standard curve was prepared by adding the stock solutions to the designated matrix (medium for medium samples and liver homogenate for liver samples). A linear response for PIH was observed from 1 to 1000 nM, for isoniazid from 0.1 to 100 µM, and for the hydrazine adduct from 0.1 to 200 µM.
Analytes were extracted from samples by adding Milli-Q purified water at 4 µl/mg of cell pellet or tissue. Pyridoxal isonicotinoyl hydrazone and the hydrazine adduct were extracted by an additional 2-fold dilution with acetonitrile containing 4 mg/l warfarin per mg of cell pellet or tissue or with methanol for isoniazid. Samples were mixed with acetonitrile and warfarin and centrifuged, and the supernatant was transferred to a 96-well plate for analysis with an equal volume of 0.1% formic acid in Milli-Q water for PIH, by direct injection for the hydrazine adduct, or with a 9× volume of Milli-Q water for isoniazid. An Acquity UPLC system (Waters, Milford, Massachusetts) coupled to an Applied Biosystems Sciex API 6500 system (Foster City, California) with a triple-quadrupole mass spectrometer using an electronic spray ionization interface in positive mode was used to analyze PIH and isoniazid. The ion source temperature was maintained at 500°C and 450°C for PIH and isoniazid, respectively; the ion-spray voltage was set to 5000°C and 3000°C for PIH and isoniazid, respectively; and the multiple reaction monitoring mode was used for quantifying the analytes. The selected m/z transitions were 287 → 150 and 137.9 → 79.1 for PIH and isoniazid, respectively. High-purity nitrogen gas was used as collision-induced dissociation gas (settings 10 and 8 for PIH and isoniazid, respectively), curtain gas (setting 20), ion-source gas 1 (settings 37 and 60 for PIH and isoniazid, respectively), and ion-source gas 2 (setting 60).
The chromatographic separation for PIH was performed on an Acquity HSS C18 column (2.1 mm × 50 mm, i.d., 1.8-μm particle size; Waters, Ireland). Mobile phase A consisted of 0.1% acetic acid in water, and mobile phase B consisted of 0.1% acetic acid in acetonitrile. The total flow rate was 0.7 ml/min. The UPLC column was maintained at 55°C, and the gradient program over 2 min was as follows: 95% A to start, maintained for 0.2 min, followed by a change to 40% A over 0.8 min then to 95% B over 0.5 min, a hold at 95% B for 0.2 min, a change to 95% A over 0.1 min, and a final hold at 95% A for 0.2 min.
The chromatographic separation for isoniazid was performed on a T3 C18 column (2.1 mm × 50 mm, i.d., 1.8-μm particle size; Waters, Ireland). Mobile phase A consisted of 10 mM ammonium bicarbonate in water, and mobile phase B consisted of methanol. The total flow rate was 0.7 mL/min. The UPLC column was maintained at 55°C, and the gradient program over 2 min was as follows: 100% A to start, maintained for 0.8 min, followed by a change to 5% A over 0.4 min, a hold at 5% A for 0.4 min, a change to 99% A over 0.3 min, and a final hold at 99% A for 0.1 min.
The hydrazine adduct was detected with an Acquity UPLC system coupled to an Acquity SQD Mass Spectrometer (Waters, Milford, Massachusetts). The mass spectrometer was operated in positive-ion mode with electrospray ionization. The conditions were as follows: Capillary voltage, 3.5 kV; cone voltage, 25 V; source temperature, 150°C; desolvation temperature, 350°C; desolvation gas, 800 l/h; cone gas, 85 l/h. A full scan range from m/z 100 to 1000 in 0.2 s was used to acquire MS data. Single-ion recording mass spectrometry was used to quantify the samples. Chromatographic separation was performed on an Acquity UPLC BEH C18 1.7-μm, 2.1 mm × 50 mm column (Waters, Milford, Massachusetts). The total flow rate was 1.0 mL/min. The sample injection volume was 10 μl. The UPLC column was maintained at 60°C, and the gradient program over 2 min was as follows: 90% A (0.1% formic acid in Milli-Q water) to start, followed by a change to 70% A over 0.2 min then to 95% B (0.1% formic acid in acetonitrile) over 1.4 min, a hold at 95% B for 0.35 min, and a change to 90% A over 0.05 min.
Mass spectra were analyzed with Analyst software (version 1.6.3) for data acquisition and processing of PIH and isoniazid. MassLynx software (version 4.1) was used to analyze spectra for the hydrazine adduct. A 1/x2-weighted least-squares linear regression method was used to obtain calibration curves for the analytes by measuring the peak area ratio of each analyte to the internal standard.
Quantitative Real-time Polymerase Chain Reaction (qRT-PCR)
Mouse livers were collected and stored in RNAlater stabilization solution (ThermoFisher, Waltham, Maine) at 4°C for 24 h, then the RNAlater solution was removed and the samples were washed with PBS and stored at −80°C until homogenization was performed. Samples were homogenized with a Bullet Blender Storm 24 Homogenizer (Thomas Scientific, Swedesboro, New Jersey). Cell cultures were trypsinized and the cells collected. Whole RNA was extracted with a Maxwell 16 LEV SimplyRNA Tissue Kit (Promega, Madison, Wisconsin) on a Maxwell 16 Instrument (Promega) in accordance with the manufacturer’s instructions. RNA was measured with a NanoDrop 8000 UV-Vis Spectrophotometer (ThermoFisher). cDNA was synthesized with a SuperScript VILO cDNA Synthesis Kit (Invitrogen). TaqMan reagents (Invitrogen) and an Applied Biosystems 7500 Fast Real-Time PCR System (Applied Biosystems, Foster City, California) were used to perform qRT-PCR. The ΔΔCT method was used to determine the mRNA fold change relative to the control group for each mouse strain (using Gapdh as the mouse housekeeping gene) or vehicle control in cell culture (using the 18S rRNA gene as the human housekeeping gene). Gene expression was normalized to the species-specific housekeeping gene, the expression of which did not vary according to treatment. Experiments were performed in triplicate, with the analysis of each sample being performed in triplicate. The following TaqMan probes were used: CYP3A4 (Hs00604506_m1), ALAS1 (Hs00963534_m1), Alas1 (Mm01235914_m1), Fech (Mm00500394_m1), FECH (Hs01555261_m1), Cyp3a11 (Mm00731567), hPXR (Hs01114267_m1), 18S (Hs03928990_g1), and Gapdh (Mm99999915_g1).
Hydrazone adduct formation and detection
Hydrazine is highly volatile and, therefore, requires derivatization in order to be accurately quantified via liquid chromatography/mass spectrometry (LC/MS). This derivatization was carried out by hydrazone formation with p-anisaldehyde and hydrazine (Supplementary Figs. 1A and 1B) similar to a previous report (Isenberg et al., 2016). For in vitro samples, 300 µl of each sample was acidified by adding 2 µl of 18N HCl, which was followed by 1 µl of p-anisaldehyde (21.8 mM). The mixtures were allowed to react at RT for 24 h before LC/MS analysis was performed. For in vivo samples, 100 µl of each sample was acidified with 2 µl of 18N or 18 M HCl, after which 1 µl of p-anisaldehyde was added to give a final concentration of 66.5 mM. Low-volume samples were diluted 1:1 or 9:1 before the acidification and addition of 1 µl p-anisaldehyde. The samples were then incubated for 24 h at RT before being analyzed by LC/MS.
Siderophore assay
The CAS assay was used to study the iron-binding capacity of solutions. The liquid CAS assay was based on the CAS-agar plate assay described by Schwyn and Neilands (1987) and modified by Machuca and Milagres (2003), with some variations. Water was treated with Chelex-100 in accordance with the manufacturer’s instructions and used to prepare the assay buffer. Samples were incubated in CAS shuttle solution for 60 min at RT, then the absorbance at 630 nm was read. Normalized absorbance values were obtained by dividing the absorbance of samples by that of a blank sample containing cell culture medium, PBS for biochemical solutions, or Chelex-treated water for deferoxamine and PIH solutions.
Fluorescence imaging of PPIX
HepG2/C3A cells were plated in 100 µl of media at a density of 10 000 cells per well in tissue-culture-treated PerkinElmer 96-well Cell Carrier Ultra Plates (PerkinElmer, Waltham, Massachusetts) for 16 h. Cells were then treated with compounds as described for 24 or 48 h at 37°C in a final concentration of 0.1% DMSO. After incubation, each well was washed 3 times with 100 µl of DPBS then fixed with a final concentration of 4% paraformaldehyde and 1% BSA for 18 h at 4°C. After fixation, each well was washed 3 times with 100 µl of DPBS and the nuclei stained with a final concentration of 5 nM 4,6-daimindino-2-phenylindole (DAPI) and 1% BSA for 20 min at 4°C. After staining each well was washed for 3 times with 100 µl of DPBS and imaged using a GE IN Cell Analyzer 6000 Imaging System (GE Healthcare Bio-Sciences, Pittsburgh, Pennsylvania).
Four fields in 8 replicates per condition were examined in each well at 20× magnification. 4,6-Daimindino-2-phenylindole was observed using an excitation wavelength of 405 nM and an emission wavelength of 455 nM. Protoporphyrin IX was viewed using an excitation wavelength of 405 nM and an emission wavelength of 706 nM. Images were loaded into PerkinElmer Columbus Image Analysis software. Nuclei were detected and masked using the DAPI staining, and cytoplasmic boundaries were detected and masked using the PPIX background fluorescence. Protoporphyrin IX punctate staining was measured using spot detection and the total area of PPIX spots multiplied by the corrected spot intensity to determine the level of PPIX present in each cell.
Statistical analysis
Data from 3 independent experiments were pooled and analyzed as indicated in the figure legends, using GraphPad Prism 7.0 software. p-Values of <.05 were considered to indicate significant differences. Results are expressed as the mean ±standard error of the mean (SEM).
RESULTS
The accumulation of PIH and hydrazine in patients taking isoniazid has been reported previously (Isenberg et al., 2016; Li et al., 2011). Pyridoxal isonicotinoyl hydrazone has been reported to chelate iron, and FECH is downregulated in low-iron conditions (Crooks et al., 2010; Taketani et al., 2000). Hydrazine has been reported to N-alkylate heme moieties (Wen et al., 2002) and heme suppresses ALAS1 expression at multiple levels (Zheng et al., 2008). Isoniazid upregulates mouse Alas1 protein and downregulates Fech protein in mouse liver (Sachar et al., 2016). These effects of isoniazid on heme biosynthesis enzymes were not previously reported for the human proteins, nor was it determined whether the effects observed in mouse systems were due to isoniazid or to a metabolite of isoniazid. Therefore, we report (1) the detection of PIH in biological systems, with a demonstration of the enzyme-independent formation of PIH from multiple vitamin B6 analogs and isoniazid; (2) the iron-dependent downregulation of FECH; and (3) the hydrazine-mediated upregulation of ALAS1.
Isoniazid Decreases Human FECH Protein and Increases Human ALAS1 Protein and mRNA Levels but Does Not Affect FECH mRNA Levels
Consistent with the results of a previous study that demonstrated the regulation of Alas1 and Fech by isoniazid in mice (Sachar et al., 2016), we observed a decrease in Fech protein and an increase in Alas1 protein in C57BL/6 mice livers after 6 weeks of treatment with isoniazid (in drinking water at 400 mg/l in water) (Supplementary Figs. 2A and 2B). The changes in Fech and Alas1 protein levels occurred independently of hPXR status, as similar observations were made regardless of the presence of the hPXR transgene in the mPxr knockout mice (Pxr-/-). Consistent with this independence from hPXR status, coadministration of rifampicin (in chow at 100 mg/kg in chow) with isoniazid did not alter the effect of isoniazid (Supplementary Figs. 2A and 2B). Increased Alas1 and decreased Fech would result in an increased accumulation of PPIX in response to isoniazid treatment in mice (Sachar et al., 2016) and might contribute to the hepatotoxicity in hPXR mice treated with rifampicin and isoniazid concurrently (Li et al., 2013). To test the effect of isoniazid on human ALAS1 and FECH, we used PHHs and the HepG2/C3A cells (Figure 1). We found that isoniazid affected human ALAS1 and FECH protein levels in a much shorter time and at lower doses than it reportedly takes to cause toxicity in HepG2/C3A cells (Bhadauria et al., 2010). Treatment of PHHs with 200 µM isoniazid for 72 h resulted in a 50% decrease in FECH protein (p < .01) (Figure 1A). The inhibitory effect of isoniazid on FECH protein expression was observed in PHHs at doses higher than 50 µM (p < .05) (Figure 1B). Isoniazid inhibition of FECH protein expression was also observed in HepG2/C3A cells (p < .01) (Figure 1D). Similar to the hPXR independency shown in Supplementary Figure 2A, neither an agonist (rifampicin, RIF) nor an antagonist (SPA70) of hPXR altered the effect of isoniazid on FECH protein levels. Although the levels of FECH protein were reduced by isoniazid, FECH mRNA levels were unaffected (Figs. 1C and 1E). At a concentration of 200 µM, isoniazid affected the levels of FECH (Figure 1A), but not those of ALAS1 protein (Figure 2A) or ALAS1 mRNA (Figure 2C), in PHHs. At a higher concentration (800 µM), isoniazid increased the protein levels of ALAS1 3-fold (p < .01) (Figure 2B). However, isoniazid at that concentration did not increase the levels of ALAS1 protein (Figure 2D) or ALAS1 mRNA (Figure 2E) in HepG2/C3A cells. Isoniazid increased the levels of Alas1 protein in mice (Supplementary Figure 2B), and the levels of Alas1 mRNA (data not shown). Rifampicin had no effect on Alas1 protein levels in mice (Supplementary Figure 2B), but increased Alas1 mRNA levels (data not shown).
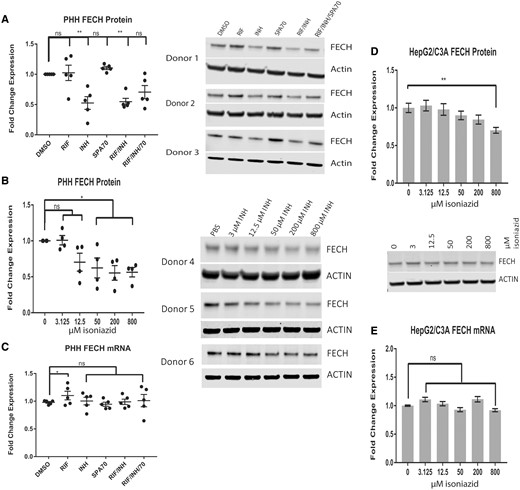
Isoniazid decreases human FECH protein levels, but not mRNA levels. Western blot analysis of FECH in primary human hepatocytes (PHHs) treated with 10 µM rifampicin (RIF), 10 µM SPA70, 200 µM isoniazid (INH), or a combination of these drugs (A) and a dose-response assay of isoniazid for 72 h (B). C, Quantitative Real-time Polymerase Chain Reaction (qRT-PCR) analysis of FECH expression in (A). Western blot analysis (D) and qRT-PCR analysis (E) of FECH expression in HepG2/C3A cells treated with isoniazid for 72 h. For PHHS, the results are presented as the mean fold change in expression±SEM. For HepG2/C3A cells, the results are presented as the mean fold change in expression for 3 biological repeats, each with 3 technical repeats. Two-way ANOVA followed by Tukey’s post hoc analysis was used to compare group means for qRT-PCR analysis. One-way ANOVA followed by Dunnett’s post hoc analysis was used to compare group means for Western blot analysis. **p < .01; *p < .05.
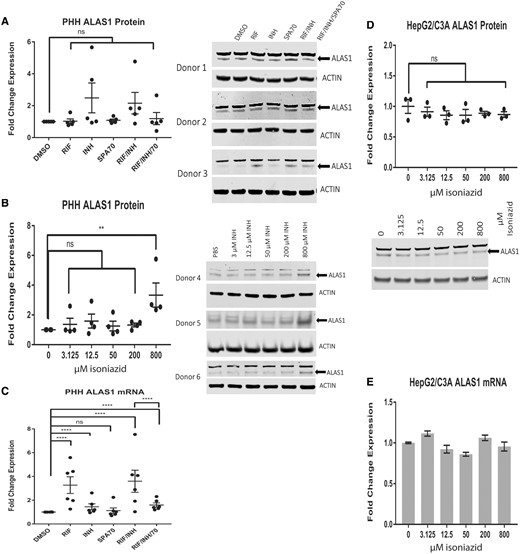
Isoniazid increases human aminolevulinic acid synthase (ALAS1) protein levels. Western blot analysis of ALAS1 in primary human hepatocytes (PHHs) treated with 10 µM rifampicin (RIF), 10 µM SPA70, 200 µM isoniazid (INH), or a combination of these drugs (A) and a dose-response assay of isoniazid for 72 h (B). (C) qRT-PCR analysis of ALAS1 expression in (A). Western blot analysis (D) and qRT-PCR analysis (E) of ALAS1 in HepG2/C3A cells treated with isoniazid for 72 h. For PHHs, the results are presented as the mean fold change in expression±SEM. For HepG2/C3A cells, the results are presented as the mean fold change in expression for 3 biological repeats. Two-way ANOVA followed by Tukey’s post hoc analysis was used to compare group means for qRT-PCR analysis. One-way ANOVA followed by Dunnett’s post hoc analysis was used to compare group means for Western blot analysis. ***p < .0001; **p < .01.
Iron Levels Modulate Human FECH Protein Levels
The downregulation of iron-dependent FECH protein has been reported previously. Bone marrow aspirates from Irp2−/− mice reportedly display only 50% of the Fech activity seen in wild-type mice (Crooks et al., 2010). Administration of the N-donor S-nitroso-N-acetylpenicillamine to lysates of cells overexpressing human recombinant FECH caused a 60% decrease in FECH activity (Furukawa et al., 1995). Treatment of FVB/NJ mice with isoniazid for 14 days produced a 60% decrease in Fech protein and a 3- to 4-fold increase in Alas1 protein (Sachar et al., 2016). These previous studies have established the relation between the [2Fe-2S]-containing FECH and iron levels in murine erythroleukemia cells, macrophage cell line RAW 264.7, and K562 cells and have shown that FECH is downregulated in iron-limiting conditions and upregulated in iron-replete conditions. However, there have been reports of the relation between FECH and iron levels in the liver hepatoma cell line HepG2/C3A, which is commonly used to study hepatotoxicity in vitro and has been used to demonstrate the toxicity of rifampicin and isoniazid at millimolar concentrations (Elmorsy et al., 2017; Shih et al., 2013; Singh et al., 2011; Tostmann et al., 2008). Additionally, because the FBS added to cell culture medium contained iron at a concentration of 26 µM, the cell culture medium conditions required for iron-mediated rescue by exogenous iron administration had to be established for HepG2/C3A cells. As shown in Figure 3A, the iron-specific chelator deferoxamine decreased FECH protein levels in HepG2/C3A cells in a dose-dependent manner: By 10%, 40%, and 60% at concentrations of 1.2 µM (p < .01), 4.7 µM (p < .0001), and higher than 18.8 µM (p < .0001), respectively, after 24 h of treatment in medium containing 10% FBS (containing 2.6 µM iron). In contrast, the administration of FeCl3 at a concentration as low as 0.1 µM in 1% FBS (containing 0.26 µM iron) (Figure 3B) increased FECH protein levels 2-fold, rising to 3-fold at a concentration of 1 µM in HepG2/C3A cells after 24 h of treatment (p < .0001). However, in the presence of 10% FBS (containing 2.6 µM iron), only a high concentration (100 µM) of additional FeCl3 increased FECH protein levels (p < .01) (Figure 3C, lane 6). Similar to the results shown in Figure 3A, 4.7 µM deferoxamine decreased the levels of FECH protein (Figure 3C, lane 7), and this effect was rescued by adding more FeCl3 at concentrations between 0.1 and 100 µM (Figure 3C, lanes 9–12), as there was no significant difference in FECH protein levels after treatment with a combination of 4.7 µM deferoxamine and 0.1–100 µM FeCl3 (Figure 3C, lanes 9–12) or with the vehicle control (Figure 3C, lane 1). As expected, there was a significant difference (p < .0001) between the results with 4.7 µM deferoxamine (Figure 3C, lane 7) and with the combination of 4.7 µM deferoxamine and 100 µM FeCl3 (Figure 3C, lane 12). Together, these data indicate a correlation between iron and FECH protein levels in HepG2/C3A cells.
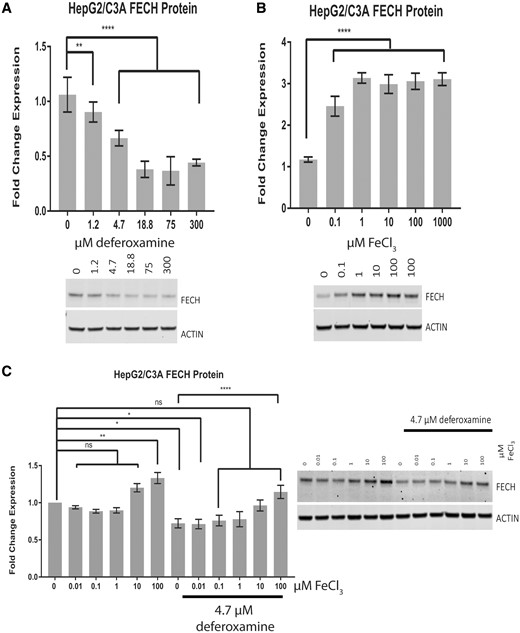
Iron levels affect FECH protein levels. Western blot analysis of FECH in HepG2/C3A cells treated for 24 h with deferoxamine mesylate in 10% fetal bovine serum (FBS)-containing medium (A), with FeCl3 in 1% FBS (B), and with FeCl3 in 10% FBS in the presence or absence of 4.7 µM deferoxamine (C). The results are presented as the mean fold change in expression±SEM for 3 biological repeats, each with 3 technical repeats. One-way ANOVA followed by Dunnett’s post hoc analysis was used to compare group means for Western blot analysis. ****p < .0001; **p < .01; *p < .05.
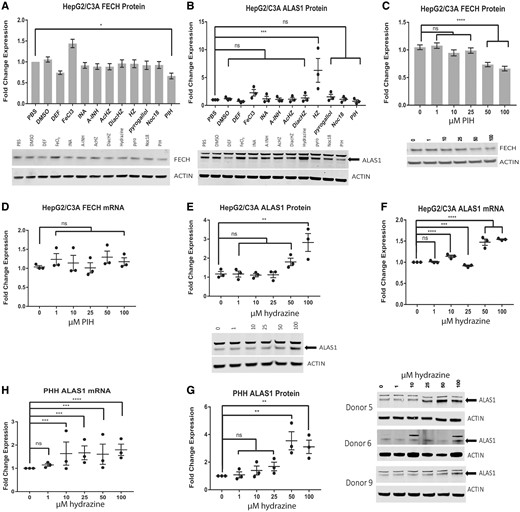
The effect of isoniazid metabolites on FECH and aminolevulinic acid synthase (ALAS1) levels. Western blot analysis of FECH (A) and ALAS1 (B) in HepG2/C3A cells treated for 16 h with the indicated compound at a concentration of 100 µM. Western blot analysis (C) and qRT-PCR analysis (D) of FECH in HepG2/C3A cells treated for 24 h with the indicated dose of pyridoxal isonicotinoyl hydrazone. Western blot analysis (E) and qRT-PCR analysis (F) of ALAS1 in HepG2/C3A cells treated for 24 h with the indicated dose of hydrazine. Western blot analysis (G) and qRT-PCR analysis (H) of ALAS1 in primary human hepatocytes (PHHs) treated for 24 h with the indicated dose of hydrazine. For qRT-PCR analysis and Western blot analysis of FECH, the results are presented as the mean fold change in expression±SEM for 3 biological repeats, each with 3 technical repeats. For Western blot analysis of ALAS1, the results are presented as the mean fold change in expression±SEM for 3 biological repeats. Two-way ANOVA followed by Tukey’s post hoc analysis was used to compare group means for qRT-PCR analysis. One-way ANOVA followed by Dunnett’s post hoc analysis was used to compare group means for Western blot analysis. ****p < .0001; ***p < .001; **p < .01; *p < .05. DEF, Deferoxamine mesylate; INA, isonicotinic acid; A-INH, acetyl-isoniazid; Ac-HZ, acetyl-hydrazine; DiacHZ, diacetylhydrazine; HZ, hydazine; PIH, pyridoxal isonicotinoyl hydrazone.
The Isoniazid and Vitamin B6 Conjugate PIH Downregulates Human FECH Protein
Pyridoxal isonicotinoyl hydrazone and hydrazine are used in this study at micromolar ranges based on the detection of PIH and hydrazine after pyridoxal HCl and isoniazid treatments (Figs. 5H, 5G, and 6). The opposing effects of isoniazid and iron in regulating the protein levels of FECH prompted us to test whether metabolites of isoniazid might act to decrease the iron and, thus, FECH protein levels. Isoniazid metabolites detected in humans after isoniazid treatment include isonicotinic acid, acetyl-hydrazine, diacetylhydrazine, acetyl-isoniazid, menadione (ROS), and noc-18 (NOS) (Blair et al., 1985; Defranceschi and Zamboni, 1954; Johnson, 1954; Kaneo et al., 1981; Preziosi and Porcellati, 1953; Zamboni and Defranceschi, 1954). In addition, an aroyl hydrazone adduct of isoniazid and vitamin B6, PIH, is detected following isoniazid treatment in humans. We first tested the isoniazid metabolites and relevant compounds at a high concentration of 100 µM in HepG2/C3A cells, as this concentration is near the upper limit of what would be expected to be present in portal hepatocytes and would, therefore, enable us to rule out metabolites that did not mediate the effect of isoniazid. As expected, FECH protein levels were increased by FeCl3 and decreased by deferoxamine after 16 h of treatment (Figure 4A), which is similar to the findings of previous studies in which FeCl3 was used as a positive control for FECH upregulation and deferoxamine was used as a positive control for FECH downregulation (Crooks et al., 2010; Taketani et al., 2000). We chose to treat the cells for 16 h because we expected to detect the effect of isoniazid metabolites before that of isoniazid itself, and a shorter incubation with the compound would also reduce the chances of further breakdown of the isoniazid metabolites in the cells. A further consideration was the reported long half-life of FECH, which precluded using an even earlier time point. Among the compounds tested, only PIH downregulated FECH protein levels (Figure 4A). It should be noted that Noc18 used at a higher concentration (300 µM) decreased FECH protein (data not shown). Pyridoxal isonicotinoyl hydrazone at a concentration greater than 50 µM decreased the FECH protein by up to 40% in a dose-dependent manner in HepG2/C3A cells (p < .0001) (Figure 4C) but did not affect FECH mRNA (Figure 4D). In PHHs, daily administration of isoniazid at a concentration of 50 µM or higher for 72 h was sufficient to significantly reduce FECH protein levels by approximately 50% (p < .05) (Figure 1B).
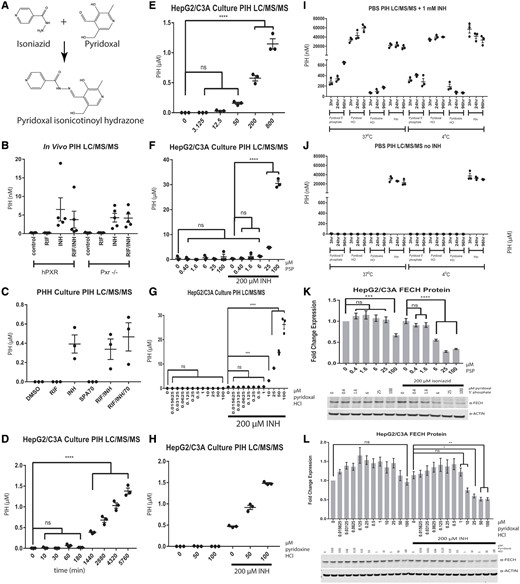
Detection of pyridoxal isonicotinoyl hydrazone (PIH) after isoniazid (INH) application. (A) Pyridoxal isonicotinoyl hydrazone is formed from isoniazid and pyridoxal. The LC/MS/MS analysis of pyridoxal isonicotinoyl hydrazone in the livers of mPxr−/−-C57BL/6 mouse with (hPXR) and without (Pxr-/-) hPXR-transgene, treated for 6 weeks with control chow, control water, chow containing 100 mg/kg rifampicin, and/or water containing 400 mg/l isoniazid (B); in primary human hepatocyte (PHH) cell culture medium treated for 72 h with DMSO, 10 µM rifampicin, 200 µM isoniazid, 10 µM SPA70, or a combination of these drugs (C); and in HepG2/C3A cell culture medium in a time-dependent (D) and a dose-dependent (E) manner after treatment with isoniazid or other compounds as indicated. The LC/MS/MS analysis of pyridoxal isonicotinoyl hydrazone in HepG2/C3A cell culture medium treated for 24 h with various concentrations of pyridoxal 5′-phosphate (F), pyridoxal HCl (G), or pyridoxine HCl (H). The LC/MS/MS analysis of pyridoxal isonicotinoyl hydrazone in phosphate-buffered saline treated with the indicated vitamin B6 analog (1 mM) at the indicated times and temperatures in the presence (I) or absence (J) of 1 mM isoniazid. Western blot analysis of FECH in HepG2/C3A cells treated for 24 h with pyridoxal 5′-phosphate (K) or pyridoxal HCl (L) in the presence or absence of 200 µM isoniazid. The results for PIH levels are presented as the mean fold change for 3 biological replicates±SEM for the in vitro data and as the mean (n = 4–5 per group)±SEM for the in vivo data. The results for Western blot analysis of FECH are presented as the mean fold change in expression±SEM for 3 biological repeats, each with 3 technical repeats. One-way ANOVA followed by Dunnett’s post hoc analysis was used to compare group means for Western blot analysis and LC/MS/MS analysis. ****p < .0001; ***p < .001; **p < .01; *p < .05.
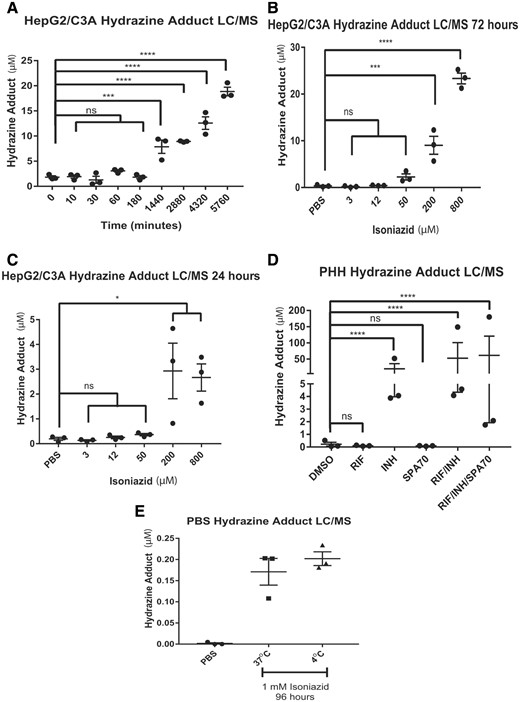
Detection of hydrazine after isoniazid administration. The LC/MS analysis of hydrazine adduct in HepG2/C3A cell culture medium at various times after treatment with a single dose of 200 µM isoniazid (A) and at 72 h (B) and 24 h (C) after treatment with various single isoniazid doses after 3 daily isoniazid doses. D, LC/MS analysis of hydrazine adduct in primary human hepatocyte (PHH) cell culture medium at 72 h after 3 daily doses of 200 µM isoniazid. E, LC/MS analysis of phosphate-buffered saline (PBS) after a 96-h incubation with 1 mM isoniazid at the indicated temperature. Hydrazine-adduct levels in HepG2/C3A cells and PBS are presented as the mean±SEM for 3 biological replicates. Hydrazine-adduct levels in PHHs are presented as the mean±SEM for 3 biological and 3 technical replicates. Two-way ANOVA followed by Tukey’s post hoc analysis was used to compare group means for LC/MS analysis of PHHs. One-way ANOVA followed by Dunnett’s post hoc analysis was used to compare group means for LC/MS analysis of HepG2/C3A cells and PBS. ****p < .0001; ***p < .001, *p < .05.
The first-line therapy for active tuberculosis consists of daily oral doses of rifampicin, isoniazid, pyrazinamide, and ethambutol, and the treatment for latent tuberculosis consists of a daily oral dose of 5 mg/kg isoniazid (or 15 mg/kg twice weekly). The plasma concentrations of isoniazid were 22–29 µM in a Moroccan population 3 h after administration of rifampicin and isoniazid in patients with active TB infections (Aït Moussa et al., 2016); in another study, the plasma isoniazid Cmax was between 10 and 50 µM after 6 weeks of rifampicin and isoniazid administration in patients with active TB infections (Aarnoutse et al., 2017). These concentrations in humans were measured in the systemic circulation, whereas the portal and hepatic concentrations of isoniazid would be expected to be several magnitudes higher than that in the systemic circulation and to persist for months. Therefore, an isoniazid dose sufficient to decrease FECH liver protein levels should be achievable. To reduce FECH protein levels significantly, higher doses of isoniazid were required in HepG2/C3A cells (Figure 1D) than in PHHs (Figs. 1A and 1B). This could be because intracellular vitamin B6 concentrations are lower in HepG2/C3A cells than in PHHs and/or because there is a less reactive ortholog of vitamin B6 in the cell culture medium. (William’s E medium contains 0.001 g/l pyridoxal HCl, and EMEM contains 0.001 g/l pyridoxine HCl.) In vivo, intracellular and more active phosphorylated forms of vitamin B6 would be expected. Pyridoxal HCl is much more efficient than pyridoxine HCl at producing PIH in the presence of isoniazid (Figure 5I). A concentration of 50 µM PIH was sufficient to reduce FECH levels significantly in HepG2/C3A cells after 24 h of treatment (p < .0001) (Figure 4C). Because of the long half-life of FECH (35 h), longer exposure to lower PIH doses may exert a more severe effect than was observed with this brief period of treatment (Furukawa et al., 1995). Together, these studies showed that PIH decreased the levels of FECH protein.
The Isoniazid Breakdown Product, Hydrazine, Upregulates Human ALAS1
We further tested whether the isoniazid metabolites upregulated ALAS1. Aminolevulinic acid synthase 1 protein levels were increased 5-fold after 16 h of treatment with 100 µM hydrazine (p < .001) but were not affected by the isoniazid metabolites and breakdown products isonicotinic acid, acetyl-hydrazine, diacetylhydrazine, acetyl-isoniazid, menadione, or noc-18 in HepG2/C3A cells (Figure 4B). Treatment of HepG2/C3A cells with 100 µM hydrazine for 24 h increased ALAS1 protein 3-fold (p < .01) (Figure 4E), and treatment with 50 µM hydrazine increased mRNA levels 2-fold (p < .0001) (Figure 4F). The changes in ALAS1 mRNA level induced by hydrazine at concentrations lower than 50 µM were very marginal and not robust. Similarly, in PHHs, 50 µM hydrazine increased ALAS1 protein 3-fold (p < .01) (Figure 4G), and concentrations higher than 10 µM increased mRNA levels 1.5-fold (p < .001) (Figure 4H). The dose of isoniazid required to produce a significant 3-fold increase in ALAS1 protein levels (p < .01) in PHHs was 800 µM. This dose is far higher than the plasma isoniazid doses attained in humans. However, N-alkylation of the heme moiety of P450 enzymes and other proteins may lead to increased recycling of these proteins and depletion of the regulatory heme pool over time. Therefore, a lower dose administered over a period of months may be required in order for the effect to be observed in vivo. Likewise, treatment of PHHs with 50 µM hydrazine for 24 h resulted in a significant 3-fold increase in ALAS1 protein levels (p < .01) (Figure 4G). Indeed, hydrazine concentrations increased with the length of treatment (Figure 6A) and with the number of treatments (Figs. 6B and 6C). Hydrazine formation may depend on amidase activity (Sarich et al., 1999), and hydrazine may require activation by P450 enzymes in order to interact with cellular proteins (Delaney and Timbrell, 1995; Lauterburg et al., 1985; Nelson et al., 1976; Sarich et al., 1999). Human cell lines and primary hepatocytes may not quantitatively reflect the in vivo activity of enzymes that metabolize xenobiotics (Turpeinen et al., 2009).
Pyridoxal Isonicotinoyl Hydrazone Is Formed by a Reaction Between Vitamin B6 Analogs and Isoniazid
As no previous report had definitively characterized the formation of PIH (Figure 5A), we next characterized PIH formation under enzyme-free conditions. Briefly, 1 mM of each indicated compound was added to PBS, incubated at the indicated temperature for the indicated time, and then analyzed for the presence of PIH by mass spectrometry. Pyridoxal isonicotinoyl hydrazone is formed in a cell- and enzyme-independent reaction by combining isoniazid with a vitamin B6 ortholog, such as pyridoxal 5′-phosphate, pyridoxal hydrochloride, or, to a lesser extent, pyridoxine hydrochloride (Figs. 5A, 5I, and 5J). The combination of isoniazid and pyridoxal hydrochloride produced PIH at a level 2 orders of magnitude greater (30–60 µM, depending on that incubation time) than that obtained with pyridoxal 5′-phosphate (the enzymatically active form) (0.3–0.6 µM) (Figure 5I), whereas the combination of isoniazid and pyridoxine HCl produced much less PIH (0.1 µM) (Figure 5I). Pyridoxal isonicotinoyl hydrazone at a concentration of 1 mM spontaneously breaks down to approximately 100 µM isoniazid after incubation for 96 h at 37°C and to a much lower extent after incubation at 4°C (Supplementary Figs. 3A and 3B). Slightly more PIH is formed after incubation of isoniazid with vitamin B6 analogs at 37°C than is formed at 4°C (Figure 5I). These data are characteristic of the endothermic dehydration reaction that produces PIH from vitamin B6 analogs and isoniazid (Figure 5A).
Pyridoxal Isonicotinoyl Hydrazone Is Detected After Treatment of Human Cells and Humanized Transgenic Animals With Isoniazid
We next detected and characterized PIH formation in mouse liver and in cell culture medium with PHHs or HepG2/C3A cells present. Approximately 5 nmol/mg tissue of PIH was detected in the livers of C57BL/6 mice (with the mouse PXR knocked out and with or without transgenic hPXR) treated with isoniazid for 6 weeks (Figure 5B), and approximately 400 nM PIH was detected in the cell culture medium of PHHs treated for 72 h with daily dosing of isoniazid (Figure 5C). Neither a PXR agonist (RIF) nor an antagonist (SPA70) altered the isoniazid-mediated formation of PIH, consistent with the hPXR independency shown in Supplementary Figures 2A and 2B. Pyridoxal isonicotinoyl hydrazone was detected in the culture medium of HepG2/C3A cells in a time-dependent manner after a single dose of 200 µM isoniazid, ranging from approximately 0.5 µM at 24 h to 1.5 µM at 96 h (p < .0001) (Figure 5D). Pyridoxal isonicotinoyl hydrazone was generated in HepG2/C3A cells in an isoniazid dose-dependent manner after 72 h of daily isoniazid treatment, with approximately 0.5 µM PIH being generated from 200 µM isoniazid and 1.2 µM PIH from 800 µM isoniazid (p < .0001) (Figure 5E). A vitamin B6 analog did not affect the PIH levels when used alone but further increased them when combined with isoniazid (Figs. 5F–H). Pyridoxal 5′-phosphate at a concentration of 25 or 100 µM combined with 200 µM isoniazid generated 5 and 30 µM PIH, respectively (Figure 5F). Pyridoxal HCl at a concentration of 10 or 100 µM combined with 200 µM isoniazid produced 3 and 27 µM PIH, respectively (Figure 5G). Pyridoxine HCl at a concentration of 50 or 100 µM combined with 200 µM isoniazid resulted in the formation of 1 and 1.5 µM PIH, respectively (Figure 5H). Treating HepG2/C3A cells with 200 µM isoniazid alone for 24 h did not decrease the FECH protein levels (it takes 72 h for an isoniazid-mediated decrease in FECH protein to be observed), but the combination of 200 µM isoniazid with 6 µM pyridoxal 5′-phosphate decreased FECH protein by 50%, which increased to 70% with the combination of 200 µM isoniazid and 25 µM pyridoxal 5′-phosphate (p < .0001) (Figure 5K) or 25 µM pyridoxal HCl (p < .05) (Figure 5L). A combination of 100 µM pyridoxine HCl and 200 µM isoniazid did not affect FECH protein levels (data not shown).
Hydrazine Is Detected in Human Cell Lines and PHHs After Isoniazid Treatment
When isoniazid was added to PBS, relatively low levels of hydrazine were formed (150 nM hydrazine after incubation of 1 mM isoniazid in PBS for 96 h) (Figure 6E). In HepG2/C3A cells, 8 µM hydrazine was detected at 24 h after treatment with a single dose of 200 µM isoniazid (p < .001), increasing to 9, 12, and 17 µM at 48, 72, and 96 h, respectively (Figure 6A). In HepG2/C3A cell culture medium treated with 800 µM isoniazid daily for 72 h, hydrazine was detected at a concentration of 22 µM (p < .0001) (Figure 6B), but only 3 µM hydrazine was detected after 24 h of treatment (p < .05) (Figure 6C). The hydrazine concentration in the cell culture medium from PHHs from 3 donors was analyzed after it had been treated for 72 h with 200 µM isoniazid, with the medium and drug being refreshed daily (Figure 6D). The amount of hydrazine detected in the cell culture medium after isoniazid treatment varied considerably depending on the donor, ranging from approximately 4 µM for 2 donors to 50 µM for the third. No hydrazine was detected when the cells were treated with a specific hPXR antagonist (SPA70) or rifampicin alone, but hydrazine was detected when isoniazid was used in combination with these drugs.
Pyridoxal Isonicotinoyl Hydrazone Reduces Human FECH Protein Levels by Decreasing Iron Availability
Considering the vulnerability of FECH to low-iron conditions, especially in the presence of iron chelators, we next tested whether exogenous iron application would rescue the PIH-mediated downregulation of FECH protein levels. In HepG2/C3A cells (Figure 7A) and PHHs (Figure 7B), the decrease in FECH protein levels due to 50 µM PIH could be rescued by the coadministration of FeCl3. Treatment of HepG2/C3A cells with 50 µM PIH for 24 h resulted in a 40% reduction in FECH protein, when compared with that in PBS-treated cells (p < .05) (Figure 7A). The addition of 10 and 100 µM FeCl3 significantly rescued the PIH-mediated decrease in FECH protein levels (p < .0001). Isoniazid treatment of PHHs for 24 h resulted in a 40% reduction in FECH protein (p < .01) that was not rescued by adding FeCl3 (Figure 7B). However, PIH treatment of PHHs for 24 h resulted in a 40% reduction in FECH protein (p < .01) that was abrogated by 0.1 and 1 mM FeCl3 (Figure 7B). Both deferoxamine (Figure 7C) and PIH (Figure 7D) chelate iron. The CAS shuttle assay has iron present, and chelation of this iron results in a decrease in absorbance at 630 nm. In other words, the more free iron available, the higher the absorbance at 630 nm. This iron chelation also occurs as a result of the product of pyridoxal HCl and isoniazid formation in PBS after incubation for 96 h at 37°C (p < .0001) (Figure 7E) and in HepG2/C3A cell culture medium treated for 24 h (p < .01 for 50 µM pyridoxal HCl and 200 µM isoniazid and p < .0001 for 100 µM pyridoxal HCl and 200 µM isoniazid) (Figure 7F). Together, these data demonstrate that PIH-mediated iron chelation decreases FECH protein levels.
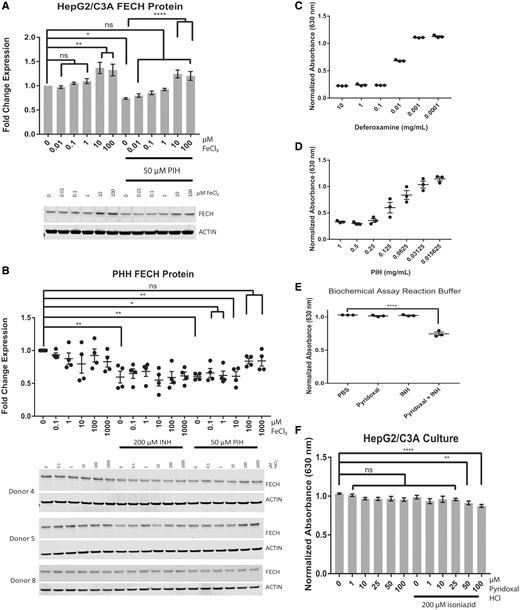
Pyridoxal isonicotinoyl hydrazone decreases FECH levels by decreasing iron availability in EMEM containing 10% fetal bovine serum. Western blot analysis of HepG2/C3A cells (A) and primary human hepatocytes (PHHs) (B) treated with increasing doses of FeCl3 in the presence or absence of pyridoxal isonicotinoyl hydrazone (PIH) (in HepG2/C3A cells) and in the presence or absence of PIH and isoniazid (in PHHs). Spectrophotometric analysis of CAS shuttle assays of deferoxamine (C), PIH (D), biochemical reaction products of pyridoxal HCl and isoniazid (E), and HepG2/C3A cell culture medium (F) treated with pyridoxal in the presence or absence of isoniazid (100 µM). For Western blot analysis of FECH in HepG2/C3A cells, the results are presented as the mean fold change in expression±SEM for 3 biological repeats, each with 3 technical repeats. For Western blot analysis of FECH in PHHs from donors, the results are presented as the mean fold change in expression±SEM. The results of spectrophotometric analysis of the background-subtracted absorbance (630 nm) of the CAS shuttle solution are presented as the mean±SEM of 3 repeats for deferoxamine and PIH dilutions and biochemical reaction products and as the mean±SEM for 3 biological repeats, each with 3 technical repeats, for the HepG2/C3A cell culture medium. One-way ANOVA followed by Dunnett’s post hoc analysis was used to compare group means for Western blot analysis and spectrophotometric analysis. ****p < .0001; ***p < .001; **p < .01; *p < .05.
DISCUSSION
Long-term tuberculosis therapy with isoniazid results in the hepatic accumulation of PIH, an aroyl hydrazone metabolite in urine, which chelates iron (Isenberg et al., 2016; Li et al., 2011). Iron chelation decreases FECH protein levels, with a much less stable protein being formed under iron-limiting conditions (Crooks et al., 2010; Taketani et al., 2000). Hydrazine has also been detected in humans after isoniazid administration (Blair et al., 1985). Hydrazine N-alkylates and inactivates CYP450 enzymes, possibly through direct interaction with the heme moiety (Wen et al., 2002). This deactivation could lead to increased turnover of CYP450 and heme, resulting in a smaller regulatory heme pool. Therefore, the presence of both hydrazine and PIH would be expected to result in increased PPIX accumulation in the liver.
Acetyl-hydrazine or acetyl-isoniazid, but not isoniazid itself, causes hepatotoxicity in rats (Nelson et al., 1976). When the acetyl group, but not the aromatic ring, is radiolabeled in acetyl-isoniazid, covalent binding of liver proteins is observed (Nelson et al., 1976). This suggests that the toxicity observed in rats after treatment of acetyl-isoniazid was due to the breakdown product of acetyl-isoniazid, acetyl-hydrazine. However, high doses of acetyl-hydrazine have been reported as hepatotoxic, in contrast to hydrazine which is highly toxic (Richards et al., 2004). No validated animal model captures the chronic cholestatic pattern of hepatotoxicity seen in humans taking rifampicin and isoniazid as part of multidrug antitubercular therapy. In a previous study (Li et al., 2013) that linked hPXR genetic status to rifampicin and isoniazid hepatotoxicity in mice, only bile plugs were found upon histopathologic examination and there was no semiquantitative histopathologic scoring of lesions.
Iron-sulfur [2Fe-2S] clusters bind a [Cys-X-Cys-X-Cys-X-Cys] motif, which is known to react with hydrazine. Four cysteine residues are conserved between Drosophila and humans: Cys-196, Cys-403, Cys-406, and Cys-411 are ligands for the [2Fe-2S] cluster in FECH (Crouse et al., 1996). NOS inhibits Fech in rat hepatocytes and purified recombinant human FECH (Kim et al., 1995; Rouault and Klausner, 1996). A labile iron-sulfur [2Fe-2S] cluster is found in animal ferrochelatase but is missing from the analogous plant, bacterial, and yeast enzymes (Dailey et al., 1994; Day et al., 1998). Therefore, the [2Fe-2S] cluster appears to be unnecessary for catalysis. However, in mammalian enzymes, when this structure is targeted by NOS, degradation of FECH/Fech is increased (Sellers et al., 1996). Indeed, NOS decreases the visible absorption spectrum of the [2Fe-2S] cluster of human and mouse FECH, as observed by Electron paramagnetic resonance (EPR) spectroscopy (Kim et al., 1995; Rouault and Klausner, 1996; Sellers et al., 1996). The yeast enzyme was affected by NOS to a much lesser degree, presumably because of its lack of an [2Fe-2S] cluster. Iron-limiting conditions decrease FECH protein levels as a result of the formation of an unstable protein with a half-life of approximately 1 h, when compared with over 35 h for the protein formed in iron-replete conditions (Crooks et al., 2010). Therefore, the iron-limiting conditions in the presence of the vitamin B6-isoniazid conjugate PIH may lead to the formation of an FECH protein that is less stable than that formed in iron-replete conditions.
Isonicotinic acid, hydrazine, acetyl-isoniazid, acetyl-hydrazine, diacetylhydrazine, and hydrazone derivatives of pyruvic and α-ketoglutaric acids have been identified as metabolites of isoniazid (Blair et al., 1985; Defranceschi and Zamboni, 1954; Johnson, 1954; Kaneo et al., 1981; Preziosi and Porcellati, 1953; Zamboni and Defranceschi, 1954). The aroyl hydrazone iron chelator PIH was the only 1 tested that decreased FECH protein levels (Figs. 4A and 4C). This downregulation was found to be iron-dependent (Figs. 7A and 7B). Furthermore, iron chelation by deferoxamine increased PPIX level in HepG2 cells. Pyridoxal isonicotinoyl hydrazone also individually increased PPIX levels, but there was no synergistic effect between deferoxamine and PIH, or deferoxamine and INH, at the concentration tested (Supplementary Figure 4). The iron-limiting condition induced by deferoxamine has previously been shown to reduce the half-life of FECH formed after treatment (Crooks et al., 2010). This may result from a reduction in the availability of iron to form [2Fe-2S] clusters or from an effect at another point in the iron-sulfur cluster assembly machinery.
Isoniazid treatment has been linked to peripheral neuropathy secondary to vitamin B6 depletion (Aita and Calame, 1972; Mahashur, 1992) and may be associated with conjugation of isoniazid to the vitamin B6 species pyridoxal, pyridoxine, and pyridoxal 5′-phosphate, resulting in decreased pyridoxal levels in humans and rats (Carlson et al., 1956; Cilliers et al., 2010; Demiroglu and Dündar, 1997; Sevigny et al., 1966). Isoniazid-induced vitamin B6–dependent peripheral neuropathy is treated in part by administering vitamin B6. Further studies will be necessary to study the potential relation of vitamin B6 levels to hepatotoxicity in antitubercular therapy. Hydrazine increases the levels of ALAS1 protein (Figs. 4E and 4G) and mRNA (Figs. 4F and 4H), but we did not elucidate the mechanism by which hydrazine upregulates ALAS1. However, hydrazine has been reported to N-alkylate, deactivate, and increase the turnover of CYP450 enzymes (Wen et al., 2002). If this leads to a decrease in the regulatory heme pool, then this could be expected to result in ALAS1 upregulation at both the protein and mRNA levels (Zheng et al., 2008).
Cholestatic liver injury due to rifampicin and isoniazid is associated with PPIX accumulation and heme biosynthesis disruption. The heme biosynthesis disruption observed in animal systems after isoniazid administration (Sachar et al., 2016) also affects the human proteins (Figs. 1 and 2). Furthermore, the effects are not due to isoniazid itself but to a metabolite of isoniazid, hydrazine (Figs. 4 and 6), and a vitamin B6 conjugate, PIH (Figs. 4 and 5). Pyridoxal isonicotinoyl hydrazone is formed in an enzyme-independent reaction between multiple vitamin B6 orthologs and isoniazid (Figure 5), and it decreases FECH protein levels in an iron-dependent manner (Figure 7). Hydrazine is formed in the culture medium of PHHs and HepG2/C3A cells and may require metabolic activation of isoniazid to achieve high concentrations (Figure 6). Hydrazine upregulates ALAS1 at the mRNA and protein levels (Figure 4). Together, these effects begin to explain the observed increase in PPIX accumulation after isoniazid coadministration (Figure 8).
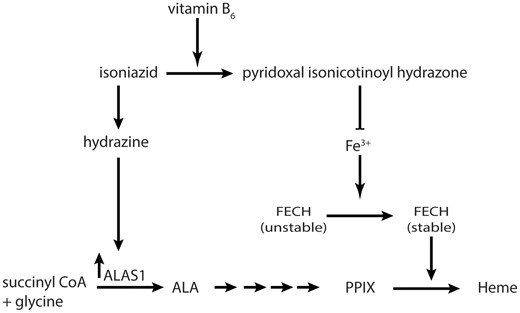
The proposed mechanism of regulation of heme biosynthesis. Vitamin B6 analogs form pyridoxal isonicotinoyl hydrazone (PIH) in the presence of isoniazid. Pyridoxal isonicotinoyl hydrazone chelates iron and prevents the stabilization of FECH. Isoniazid breaks down to hydrazine, and hydrazine upregulates aminolevulinic acid synthase at the transcription level. Both effects may be expected to increase the levels of liver protoporphyrin IX and lead to cholestatic liver injury. ALA, aminolevulinic acid.
Low-iron levels regulate FECH by preventing the formation of a stable protein by decreasing iron levels via chelation (Crooks et al., 2010; Taketani et al., 2000); however, whether this is achieved by disrupting iron metabolism, transport, or storage; by directly destroying the [Fe-S] cluster of FECH; or by disrupting the [Fe-S]-cluster assembly machinery proteins remains to be seen. Further studies, such as EPR spectroscopy of FECH formed after PIH application, similar to that in a previous report (Sellers et al., 1996) that characterized the effect of deferoxamine on FECH protein, are needed to determine whether purified recombinant FECH formed in the presence of PIH differs from that formed under iron-replete conditions. EPR spectroscopy could directly observe malformation of the [Fe-S] cluster. Likewise, a proteomics analysis of mice after isoniazid treatment might elucidate additional mechanisms and other [2Fe-2S]-containing proteins that are affected by PIH.
In conclusion, our studies demonstrate that isoniazid breaks down to hydrazine, which upregulates ALAS1 protein, and isoniazid reacts with vitamin B6 in an enzyme-independent manner to form PIH, which chelates iron and decreases FECH protein levels in an iron-independent manner. Both increased ALAS1 protein and reduced FECH protein levels promote liver injury.
SUPPLEMENTARY DATA
Supplementary data are available at Toxicological Sciences online.
ACKNOWLEDGMENTS
We thank the Liver Tissue Cell Distribution System of the University of Pittsburgh (Pittsburgh, Pennsylvania) for providing human primary hepatocytes; the Animal Resources Center at St Jude Children’s Research Hospital for technical Assistance; Dr Wen Xie of the University of Pittsburgh for providing the hPXR humanized transgenic and mouse PXR knockout mouse models; Dr Keith A. Laycock (St Jude Department of Scientific Editing) for editing the manuscript; and other members of the Chen research laboratory for valuable discussions of the paper. The authors declare no conflict of interest.
FUNDING
This work was supported, in part, by ALSAC and by the National Institutes of Health [grant numbers R35-GM118041 (to T.C.), P30-CA21765 (to St Jude), and F31DK116523 (to C.T.B.)].

Comments