


Abstract
Prioritizing the risk posed by thousands of chemicals potentially present in the environment requires exposure, toxicity, and toxicokinetic (TK) data, which are often unavailable. Relatively high throughput, in vitro TK (HTTK) assays and in vitro-to-in vivo extrapolation (IVIVE) methods have been developed to predict TK, but most of the in vivo TK data available to benchmark these methods are from pharmaceuticals. Here we report on new, in vivo rat TK experiments for 26 non-pharmaceutical chemicals with environmental relevance. Both intravenous and oral dosing were used to calculate bioavailability. These chemicals, and an additional 19 chemicals (including some pharmaceuticals) from previously published in vivo rat studies, were systematically analyzed to estimate in vivo TK parameters (e.g., volume of distribution [Vd], elimination rate). For each of the chemicals, rat-specific HTTK data were available and key TK predictions were examined: oral bioavailability, clearance, Vd, and uncertainty. For the non-pharmaceutical chemicals, predictions for bioavailability were not effective. While no pharmaceutical was absorbed at less than 10%, the fraction bioavailable for non-pharmaceutical chemicals was as low as 0.3%. Total clearance was generally more under-estimated for nonpharmaceuticals and Vd methods calibrated to pharmaceuticals may not be appropriate for other chemicals. However, the steady-state, peak, and time-integrated plasma concentrations of nonpharmaceuticals were predicted with reasonable accuracy. The plasma concentration predictions improved when experimental measurements of bioavailability were incorporated. In summary, HTTK and IVIVE methods are adequately robust to be applied to high throughput in vitro toxicity screening data of environmentally relevant chemicals for prioritizing based on human health risks.
The report by the National Research Council “Risk Assessment in the Federal Government” (National Research Council, 1983) specifies that knowledge of both inherent chemical toxicity and plausible human or ecological exposure are necessary to determine the risk posed by a chemical. With the exception of pharmaceuticals, pesticides, and food additives, most other chemicals have been subject to minimal testing, resulting in thousands of chemicals in commerce with little or no toxicity or exposure data (Breyer, 2009; Egeghy et al., 2012; Judson et al., 2009). However, the Toxic Substances Control Act, which outlines the safety-related requirements for many non-pharmaceutical chemicals was recently updated by the Frank R. Lautenberg Chemical Safety for the 21st Century Act. The new law requires that the U.S. Environmental Protection Agency identify chemical priorities among these thousands of chemicals, gives the Agency new authority for requesting data when necessary, and promotes the use of non-animal alternative methods when demonstrated to be of equivalent or better scientific quality (Congress, 2016).
Toxicokinetics (TK) is a critical component in understanding toxicological responses by linking chemical exposure to internal tissue concentrations. High throughput in vitro and in silico approaches offer a promising approach to estimating the in vivo TK properties for hundreds of chemicals. The high-throughput TK (HTTK) methods include in vitro assays that assess metabolic clearance using in vitro liver systems (i.e., hepatocytes) (Shibata et al., 2002) and binding to plasma protein (Waters et al., 2008). These chemical-specific HTTK data (i.e., hepatocyte metabolic clearance, protein binding) rely on in vitro-to-in vivo extrapolation (IVIVE) to scale the in vitro data and parameterize TK models of varying sophistication.
IVIVE based upon HTTK methods was developed initially to assist in the design of human clinical trials for the development of pharmaceuticals (Jamei et al., 2009; Lukacova et al., 2009; Wang, 2010). As the only source of TK information for many chemicals, the accuracy and suitability of HTTK-derived IVIVE predictions need to be determined for the types of chemicals found in the environment (Wambaugh et al., 2015; Yoon et al., 2014). The properties of environmental and industrial chemicals may vary from pharmaceuticals in important ways that influence the TK including hydrophobicity and ionization (Feher and Schmidt, 2003; Lipinski, 2004; Richard et al., 2016; Strope et al., 2018). An important difference between pharmaceuticals and non-therapeutic chemicals is that pharmaceuticals in many cases are designed with the purpose of being absorbed following oral administration, whereas this is not the case for other chemicals.
HTTK measurement of hepatocellular clearance and plasma protein binding allows chemical-specific estimates of two mechanisms of chemical clearance from the body: hepatic metabolism and passive renal excretion. While the ability of in vitro hepatocyte assays to predict in vivo hepatic metabolism specifically has been thoroughly evaluated (Lau et al., 2002; McGinnity et al., 2004; Obach, 1999; Obach et al., 1997; Shibata et al., 2002; Wang, 2010), here these two mechanisms are the only available surrogates for whole body clearance, which includes these and other clearance processes.
Comparison between in vitro-based HTTK predictions of in vivo TK and in vivo TK data have shown HTTK to be predictive of maximal plasma concentration (Cmax) and area under the plasma concentration time curve (AUC), but that predictions are biased toward underestimation of total clearance (Sohlenius-Sternbeck et al., 2012; Wood et al., 2017), resulting in a low (R2 value approximately 0.34) chemical-to-chemical variance explained in predicted steady-state plasma concentration (Css) (Wambaugh et al., 2015). Hypotheses for the prediction bias and lack of explained variance between HTTK predictions and in vivo values include (1) larger variability due to documented presence of inter-study variability in chemical TK outputs across published in vivo studies (Wetmore et al., 2012,, 2015) that are typically conducted on a per chemical basis, (2) underestimation of metabolic clearance in the liver by the use of 4 h incubations with in vitro suspensions of primary hepatocytes known to have short-lived metabolic capability (Wambaugh et al., 2015), (3) lack of ability to predict extra-hepatic metabolism because of the use of primary hepatocytes (Wilk-Zasadna et al., 2015), (4) lack of data to characterize oral absorption (Fraczkiewicz et al., 2014), and (5) lack of transporter-mediated movement of chemicals within tissues, particularly the kidney and liver (Wambaugh et al., 2015). While systems do exist for understanding the confidence with which IVIVE may be applied to pharmaceuticals (e.g., Camenisch, 2016), the relative lack of non-pharmaceutical in vivo data makes systematic evaluation of the performance on IVIVE difficult (Wambaugh et al., 2015).
Here we report on new, in vivo experiments in rat for 26 non-pharmaceutical chemicals. The physico-chemical properties of these chemicals are intended to be more representative of chemicals that may be present in our environment. The new experiments included both oral and iv dosing, allowing characterization of oral absorption through estimation of both fraction absorbed from an oral dose and the rate of absorption. We developed a uniform TK statistical analysis to estimate relevant TK parameters (e.g., volume of distribution, rate of elimination) for both these new TK data as well as data from previously published studies. Our systematic analysis generated a library of rat in vivo estimated TK parameters for 44 chemicals that all have corresponding in vitro HTTK data for rats. By direct comparison to rat-specific HTTK predictions for all 44 chemicals, we were able to address the first 3 of the above hypotheses related to accuracy of IVIVE. Further, we were able to evaluate chemical structure-based models for oral absorption (Simulations Plus, 2017), steady-state volume of distribution (Pearce et al., 2017a; Poulin and Theil, 2009; Schmitt, 2008), and expected accuracy of IVIVE methods (Wambaugh et al., 2015). By directly comparing TK estimated using rat-specific, in vitro HTTK with rat in vivo data, we aim to estimate if and when HTTK methods might be expected to work well for humans and when they might fail.
MATERIALS AND METHODS
We illustrate our study design in Figure 1: a single, harmonized approach was used for all chemicals. Plasma concentration time course data collected from in vivo rat studies were obtained from 3 sources: (1) new experiments conducted by the National Health and Environmental Effects Research Laboratory (NHEERL) of the U.S. EPA, (2) the RTI International (RTI), and (3) previously published studies curated from the peer-reviewed literature as summarized in Wambaugh et al. (2015). Twenty chemicals were tested by NHEERL and eight by RTI using a harmonized testing protocol. Processed data and models are provided in R package “httk” (Pearce et al., 2017b) version 1.8 (https://cran.r-project.org/web/packages/httk/; last accessed February 5, 2018). Raw data (doi: 10.5061/dryad.32v7b), graphs, and analysis scripts are available as Supplementary Material.
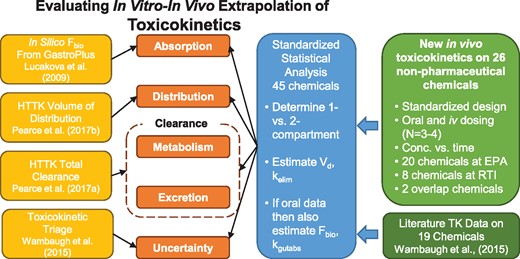
Overview of experiments and analysis. We collected new TK data and jointly analyzed that data with literature data in order to evaluate 4 key issues in IVIVE. Predictions of oral absorption, volume of distribution, clearance, and uncertainty were all evaluated. Data were modeled with both 1- and 2-compartment models (Figure 2) and if the 2-compartment model was selected, the volumes of the 2 compartments were added to make a volume of distribution and the rate for the second (elimination) phase was used as kelim.
Chemicals
Newly studied chemicals are those listed in Table 1 with either RTI or NHEERL as sources. There were two chemicals—bensulide and propyzamide—analyzed by both RTI and NHEERL. NHEERL performed experiments on 20 chemicals, all of which were supplied by Chem Service (West Chester, PA) except for triclosan, which was from Sigma Aldrich (St. Louis, MO). Chemical purity was greater than 97% (listed by manufacturer). Kolliphor EL and glycerol were bought from Sigma-Aldrich. Ethanol (200 proof) was purchased from Decon Laboratories (King of Prussia, PA). Heparin was obtained from Henry Schein (Melville, NY).
Chemicals Tested
| Compound | Abbrev. | CAS | DSSTox | Source | Oral Dose(s) (mg/kg BW) | Iv Dose(s) (mg/kg BW) |
|---|---|---|---|---|---|---|
| 2, 4-D | 2, 4D | 94-75-7 | DTXSID0020442 | 2 | 1 | 0.2, 0.21 |
| Alachlor | Alac | 15972-60-8 | DTXSID1022265 | 2 | 5.2, 5.3 | 1, 0.97 |
| Alprazolam | Alpr | 28981-97-7 | DTXSID4022577 | 3 | 7, 12 | 1.2 |
| Antipyrine | Anti | 60-80-0 | DTXSID6021117 | 3 | NA | 15 |
| Bensulide | Bens | 741-58-2 | DTXSID9032329 | 1, 2 | 5.3, 5.1, 5.2, 5 | 1, 0.98 |
| Bensulide | Bens | 741-58-2 | DTXSID9032329 | 1 | 5 | 1 |
| Bensulide | Bens | 741-58-2 | DTXSID9032329 | 2 | 5.3, 5.1, 5.2 | 1, 0.98 |
| Bisphenol A | BPA | 80-05-7 | DTXSID7020182 | 1 | 3 | 0.6 |
| Boscalid | Bosc | 188425-85-6 | DTXSID6034392 | 1 | 5 | 1 |
| Bosentan | Bose | 147536-97-8 | DTXSID7046627 | 3 | 1 | 10 |
| Carbaryl | Cbyl | 63-25-2 | DTXSID9020247 | 1 | 5 | 1 |
| Carbendazim | Cbzm | 10605-21-7 | DTXSID4024729 | 3 | 1000 | NA |
| Chloridazon | Cdzn | 1698-60-8 | DTXSID3034872 | 2 | 4.2, 4.1 | 0.73, 0.83, 0.85 |
| Chlorpyrifos | Cpfs | 2921-88-2 | DTXSID4020458 | 3 | 5, 10, 50, 100 | NA |
| Cyclanilide | Cycl | 113136-77-9 | DTXSID5032600 | 1 | 1 | 0.2 |
| Cyclosporin A | CycA | 59865-13-3 | DTXSID0020365 | 3 | NA | 5.9, 6 |
| Diazinon-o-analog | Diaz | 962-58-3 | DTXSID5037523 | 2 | 5, 5.1 | 1, 0.99, 1.1 |
| Diclofenac | Dicl | 15307-86-5 | DTXSID6022923 | 3 | 18 | NA |
| Diltiazem | Dilt | 42399-41-7 | DTXSID9022940 | 3 | 20 | 20 |
| Dimethenamid | Dime | 87674-68-8 | DTXSID4032376 | 1 | 5 | 1 |
| Etoxazole | Etox | 153233-91-1 | DTXSID8034586 | 1 | 2 | 0.4 |
| Fenarimol | Fena | 60168-88-9 | DTXSID2032390 | 1 | 2 | 0.4 |
| Flufenacet | Fluf | 142459-58-3 | DTXSID2032552 | 2 | 5.3, 5.2, 5.1 | 0.99, 0.98, 1 |
| Formetanate hydrochloride | Form | 23422-53-9 | DTXSID4032405 | 1 | 5 | 1 |
| Hexobarbitone | Hexo | 56-29-1 | DTXSID9023122 | 3 | NA | 60 |
| Ibuprofen | Ibup | 15687-27-1 | DTXSID5020732 | 3 | NA | 2.5, 25 |
| Imazalil | Imaz | 35554-44-0 | DTXSID8024151 | 1 | 5 | 1 |
| Imidacloprid | Imid | 138261-41-3 | DTXSID5032442 | 1 | 5 | 1 |
| Imipramine | Imip | 50-49-7 | DTXSID1043881 | 3 | 50 | 10 |
| Metoprolol | Meto | 51384-51-1 | DTXSID2023309 | 3 | 20 | NA |
| Midazolam | Mida | 59467-70-8 | DTXSID5023320 | 3 | 15 | 5 |
| Nilvadipine | Nilv | 75530-68-6 | DTXSID2046624 | 3 | 10 | 0.1 |
| Novaluron | Nova | 116714-46-6 | DTXSID5034773 | 1 | 2 | 0.4 |
| Ondansetron | Onda | 99614-02-5 | DTXSID8023393 | 3 | 4, 8, 20 | 1, 4, 8, 20 |
| Perfluorooctanoic acid | PFOA | 335-67-1 | DTXSID8031865 | 1 | 1 | 0.2 |
| Permethrin | Perm | 52645-53-1 | DTXSID8022292 | 1 | 5 | 1 |
| Phenacetin | Pacn | 62-44-2 | DTXSID1021116 | 3 | NA | 23 |
| Phenytoin | Pytn | 57-41-0 | DTXSID8020541 | 3 | 25 | 40, 25 |
| Propamocarb hydrochloride | Prop | 25606-41-1 | DTXSID6034849 | 1 | 5 | 1 |
| Propyzamide | Prpy | 23950-58-5 | DTXSID2020420 | 1, 2 | 3.2, 3.1, 3 | 0.6, 0.61 |
| Propyzamide | Prpy | 23950-58-5 | DTXSID2020420 | 1 | 3 | 0.6 |
| Propyzamide | Prpy | 23950-58-5 | DTXSID2020420 | 2 | 3.2, 3.1 | 0.6, 0.61 |
| Pyrithiobac sodium | Pyri | 123343-16-8 | DTXSID8032673 | 2 | 1 | 0.21, 0.2, 0.19 |
| Resmethrin | Resm | 10453-86-8 | DTXSID7022253 | 1 | 4 | 0.8 |
| S-Bioallethrin | S-Bi | 28434-00-6 | DTXSID2039336 | 1 | 4 | 0.8 |
| Simazine | Sima | 122-34-9 | DTXSID4021268 | 1 | 2 | 0.4 |
| Tolbutamide | Tolb | 64-77-7 | DTXSID8021359 | 3 | 20 | 10 |
| Triclosan | Tric | 3380-34-5 | DTXSID5032498 | 1 | NA | 1 |
| Valproic acid | Valp | 99-66-1 | DTXSID6023733 | 3 | 200, 600 | 10, 50, 100 |
Sources: NHEERL,1 RTI,2 and peer-reviewed literature summarized in Wambaugh et al. (2015).3
RTI performed experiments on 8 chemicals all of which were supplied by Sigma Aldrich, with the exception of pyrithiobac sodium and diazoxon, which were obtained from Crescent Chemical Co (Islandia, NY). Dose vehicle ingredients used at RTI included ethanol (Decon Laboratories) Cremophor (Sigma Aldrich) and PBS (Amresco).
Non-labelled internal standards (Isoxaben and 2-methyl-4-chlorophenoxyacetic acid, MCPA) and all calibration standards were purchased from Sigma-Aldrich with the exception of the standard of S-bioallethrin, which was purchased from Crescent Chemical. Some calibration standards (bensulide, formetanate hydrochloride, and propamocarb) were also used as non-labelled internal standards when appropriate. Stable isotope-labelled internal standards (13C12-bisphenol A, 13C6-carbaryl, phenoxy-13C6-cis-permethrin, 13C12-triclosan) were purchased from Cambridge Isotope Laboratories (Tewksbury, MA) except 13C2-perfluoro-n-octanoic acid (PFOA) was obtained from Wellington Laboratories (Guelph, Ontario, Canada). Dichloromethane, ethyl acetate, and methanol were purchased from VWR International (Radnor, PA).
Animals
Adult male Sprague-Dawley rats (ca. 350 g) were obtained from Charles River Laboratories (Raleigh, NC). Rats were received with a jugular vein catheter (JVC) surgically implanted by the vendor. Rats were housed in a facility accredited by the Association for Assessment and Accreditation of Laboratory Animal Care. All procedures with animals were approved by the Institutional Animal Care and Use Committee for each facility (U.S. EPA/NHEERL, RTI International). Animals were housed individually in plastic box cages with pine shaving bedding and provided feed (Purina Rodent Chow 5001, LabDiet, Richmond, IN) and autoclaved tap water ad libitum. Animals were acclimated to the facility for at least 4 days before dosing and were weighed daily.
Animals for studies conducted at RTI were housed singly in polycarbonate cages with Sanichips bedding (PJ Murphy Forest Products, Montville, NJ) and stainless steel wire lids that accommodate a water bottle and feed. Rats were offered Purina 5001 feed and water (Durham City, NC) from a reverse osmosis system ad libitum. Rats were received 1–2 days following JVC surgery and were acclimated to the facility for 4 days prior to dosing.
Treatment
Before chemical administration, blood (0.3 ml) was removed from each rat via the catheter. Saline (0.3 ml) was then infused into the catheter followed by 0.05 ml of glycerol/saline (1:9, v/v) containing 10% heparin (i.e., lock solution). Animals were either administered chemical by oral gavage (5 ml/kg) or intravenously (1 ml/kg) via the tail vein. For the new studies, two chemical-specific doses (one each for the oral and iv routes) were back-calculated to span the range of ToxCast bioactive concentrations and are reported in Table 1. Three to four animals were treated per group. For most of the chemicals, the vehicle was ethanol/Kolliphor/saline (10:30:60; v/v/v). For water soluble chemicals, the vehicle was saline. After oral administration, blood (0.3 ml) was removed via the catheter at 15 and 30 min and 1, 2, 4, 8, 12, 24, 48, and 72 h. After intravenous administration, blood (0.3 ml) was removed via the catheter at 5, 10, and 30 min and 1, 2, 4, 8, 12, 24, 48, and 72 h. For both administration routes, after removing blood, 0.3 ml of saline was infused into the catheter followed by 0.05 ml of lock solution. All blood samples were transferred to Microtainer® tubes (Becton, Dickinson and Company, Franklin, NJ) and placed in ice. Blood was separated into plasma and red blood cells by spinning the tubes in a microcentrifuge at 9000 rpm for 15 min at 4°C. Plasma was transferred to cryo tubes and stored at −80°C until analyzed for chemical concentration.
Analysis of chemical concentrations
For samples analyzed at EPA, plasma samples were stored at −80°C. All analytes of interest were extracted from plasma thawed to room temperature by using supported liquid extraction (SLE) (Isolute SLE+ plate, Biotage, Charlotte, NC), except for triclosan, which was extracted by phospholipid depletion (PLD) (Isolute PLD+ plate, Biotage, Charlotte, NC). Plasma (50 µl) was diluted 1:4 with buffer, spiked with internal standard (Supplementary Table 1) for a plasma concentration of 50 ng/mL, vortexed at 2500 rpm for 2 min and applied to the extraction plate. After 5 min, samples were eluted to a collection plate with 1 ml of extraction solvent under gravity flow for 5 min followed by 2 min vacuum. Diluents and extraction solvents used by the EPA lab are given in Supplementary Table 1. For the PLD extraction, plasma samples (50 µl) were applied to wells that were pretreated with 350 µl acetonitrile with 0.1% formic acid. (Thermo Fisher Scientific, Waltham, MA) The plate was vortexed (1 min) and then vacuum was applied (−0.2 bar, 5 min). For both extraction methods, samples were evaporated to dryness under nitrogen (40°C) and reconstituted in 100 µl 20:80 (v/v) methanol: water with 0.1% formic acid and 4 mM ammonium formate (Sigma-Aldrich, St. Louis, MO). A matrix-matched blank and matrix-matched blank spike (25 ng/mL) were included with each extraction batch for quality control. Matrix-matched calibration curve standards were extracted in the same manner. The controls and calibration curves were prepared in control plasma from male Sprague Dawley rats (BioreclamationIVT, Chesterton, MD). The calibration range was 1–500 ng/ml.
Extracts were analyzed by liquid chromatography/tandem mass spectrometry (LC/MS/MS) with electrospray ionization in positive or negative ion mode and MRM (multiple reaction monitoring) on a Thermo Electron (West Palm Beach, FL) Surveyor chromatograph and TSQ Quantum Ultra AM triple quadrupole mass spectrometer or a Shimadzu (Columbia, MD) Prominence chromatograph and AB Sciex (Framingham, MA) 4000 QTrap linear ion trap mass spectrometer. Instrument source parameters and compound-specific tuning parameters are given in Supplemental Table 2. Chromatographic separation was achieved with gradient elution (20% B to 28% B over 4 min) and a Kinetex XB-C18 column (30 × 2.1 mm, 2.6 µm) (Phenomenex, Torrance, CA). Mobile phases ([A] water and [B] methanol) both had 0.1% formic acid and 4 mM ammonium formate additives. The injection volume was 20 µl and the flow rate was 300 µl/min.
For samples analyzed at RTI, (Supplemental Table 3) plasma was thawed on ice and aliquots (25 µl) were mixed with 5 µl of methanol and 100 µl of ice-cold methanol containing 100 ng/ml of internal standard (Supplemental Table 4); isoxaben for positive ionization methods and MCPA for negative ionization. Samples were vortexed (5 s on a Vortex Genie 2 at maximum speed) and centrifuged at 16,000 g for 3 min in a VWR Microcentrifuge. Supernatant (100 µl) was mixed with 100 µl of mobile phase (0.1% formic acid in water or 10 mM NH4OAc). Samples (10 µl) were analyzed by LC-MS/MS. Standard curves and QC samples were prepared similarly by mixing 5 µl of methanol containing a known amount of test article (instead of 5 µl methanol only) to 25 µl plasma and processing as described above for samples. Analyses were conducted by LC-MS on an API 4000 (Applied Biosystems, Foster City, CA) triple quadrupole mass spectrometer system with an Agilent, Santa Clara, CA 1100 LC system, and a reverse-phase column Restek, Bellefonte, PA Ultra C18 (50 × 2 mm, 5 μm) with C18 guard cartridge (flufenacet, bensulide, propyzamide) in positive ion mode, with a gradient of 0.1% formic acid and methanol at a flow rate of 0.3 mL/min, and an injection volume of 10 µl. 2, 4-D was analyzed with the same system in negative ion mode, with a mobile phase of 0.1% acetic acid and 10 mM ammonium acetate in water and methanol. For the remaining compounds (chloridazon, diazoxon, imipramine, pyrithiobac sodium, and alachlor), an API 5000 (Applied Biosystems) triple quadrupole system was used with a Waters, Milford, MA Aquity UPLC system. A Phenomenex Synergi Hydro-RP (50 × 2 mm, 4 µm) with C18 guard cartridge eluted with a gradient of 0.1% formic acid in water and methanol was used for chloridazon, diazoxon, and imipramine. The analysis of chemical concentration was conducted in the positive ion mode. A Waters Acquity UPLC HSS C18 (2.1 × 5 mm, 1.8 µM) with C18 guard cartridge column was used for pyrithiobac sodium and alachlor. Instrument and compound parameters for RTI are given in Supplemental Tables 5–8.
Literature in vivo TK data
Various strains of rat TK data were collected from peer-reviewed literature by Netherlands Organisation for Applied Scientific Research and reported in Wambaugh et al. (2015) for 26 chemicals. Of those chemicals, data for one chemical were entirely from subcutaneous exposure and were omitted. Four other chemicals did not have any in vitro HTTK data available (see below). Two additional chemicals had some in vitro HTTK data, but did not have a successful plasma protein binding measurement, meaning that no tissue partitioning could be predicted. Thus, only 19 of the 26 chemicals were analyzed here.
High throughput toxicokinetics in vitro data
In vitro data for ToxCast Phase I compounds collected using rat hepatocytes and plasma protein previously reported in Wetmore et al. (2013). Intrinsic hepatocyte metabolic clearance (Clint) was measured using a substrate depletion approach observing parent chemical loss in the presence of cryopreserved rat primary hepatocytes during a 4 h incubation. Hepatocytes were from a four donor pool derived from male Wistar Hannover rats. Hepatocellular metabolism by both phase I and phase II enzymes was characterized for 7-ethoxycoumarin and 7-hydroxycoumarin and found to be within acceptable historical ranges. Fraction unbound in plasma (plasma protein binding, fup) was measured using Rapid Equilibrium Dialysis (RED) (Waters et al., 2008) with male Wistar rat plasma. Chemical-specific analytical chemistry methods were developed to quantify changes in concentrations. All in vitro TK data were obtained from the R package “httk” v1.8 (Pearce et al., 2017b). Chemicals for which fup was below the limit of detection are withheld from some analyses since fup is an important parameter for predicting chemical partitioning into tissue (Pearce et al., 2017a).
Prediction of toxicokinetics
The R package “httk” version 1.8 was used to predict clearance, volume of distribution (Vd), Cmax, and AUC based upon in vitro measured fup and Clint, and physico-chemical properties. All in vitro values and physico-chemical properties used are provided in Supplementary Table 10 (doi: 10.5061/dryad.32v7b). Steady-state Vd was predicted as in Poulin and Theil (2009) using a modified version of Schmitt’s method (Schmitt, 2008), wherein the total volume of distribution was calculated as the sum of tissue-specific partition coefficient predictions weighted by the species appropriate tissue volumes (Pearce et al., 2017b; Poulin and Theil, 2009). Each tissue-specific partition coefficient (except red blood cells) was calibrated through comparison to a library of in vivo measured partition coefficients (Pearce et al., 2017a). Physico-chemical properties were obtained from literature and predicted using EPA’s Estimation Program Interface (EPI) Suite version 4.10 (USEPA, 2015) for most parameters except pKa which was predicted using ChemAxon (ChemAxon, 2015; Strope et al., 2018).
The orally bioavailable fraction of dose (Fbio) was predicted using GastroPlusTM version 9.5 (Simulations Plus). Replicating the in vivo scenario, models were built assuming a solution was given orally to a 0.25 kg fed rat using the GastroPlus PBPK model. A single oral dose was assumed from Table 1, with the smallest integer oral dose used if multiple given. The GastroPlus default in silico parameters were used (e.g., physico-chemical properties, fup, renal clearance (fup* glomerular filtration rate), metabolic clearance (3A4HLM_othersrCYP). Models were run for 72 h and Fbio reported.
Statistical analysis of toxicokinetic in vivo data
TK model parameters were estimated for each chemical using a single uniform statistical analysis method developed in the open source R statistical language v3.2.5. The analysis software, a custom developed R package “invivoPKfit,” is available as Supplementary Material. All concentration time-course data are available in Supplementary Table 9 (doi: 10.5061/dryad.32v7b). The time-course data and summary values (e.g., time-integrated area under the plasma concentration curve, AUC) are available from the public R package HTTK version 1.8 in tables “chem.invivo.PK.data,” “chem.invivo.PK.aggregate.data,” and “chem.invivo.PK.summary.data.”
Each chemical was initially modeled using non-compartmental analysis using the R package “PK” (Jaki and Wolfsegger, 2011). All concentration data was normalized by dose. A “batch” analysis was conducted allowing for different studies with the same route of exposure to be analyzed jointly, however the oral and iv routes had to be analyzed separately. Vd and kelim were determined from the iv data, while Fbio was determined as the ratio of the oral AUC to the iv AUC.
Compartmental model analysis allowed data from both iv and oral doses to be jointly analyzed, when data from both routes was available. As in Figure 2, for orally dosed animals the dose was modeled as first entering the gut, from which a fraction Fbio of the total dose was being absorbed with rate kgutabs for the orally dosed animals, while the iv animals were modeled with the total dose appearing in the central compartment at time zero. If no oral dosing data were available, only quantities that can be estimated from iv dosing were estimated (e.g., Vd, kelim) while absorption rate and bioavailability were not estimated.
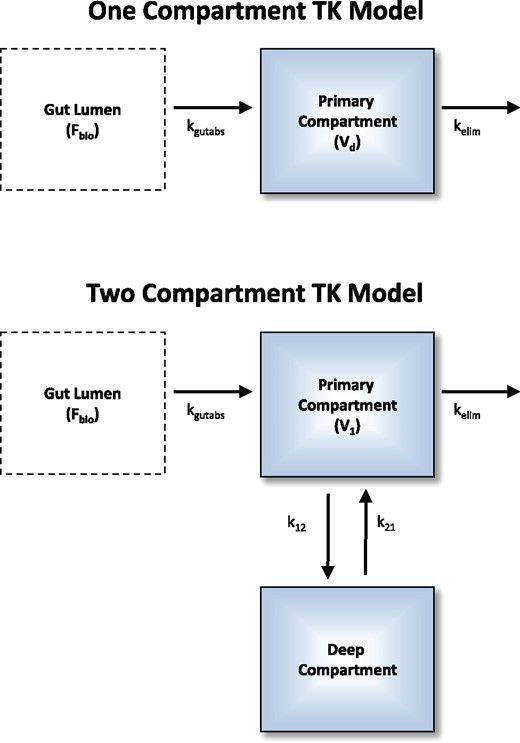
Both the empirical 1- and 2-compartment models were investigated for each chemical time course. A single set of model parameters were optimized to describe all available plasma concentration data (i.e., simultaneously for both oral and intravenous doses and for all data sources). Fbio is the fraction (between 0 and 1) of the oral dose that is absorbed at a rate of kgutabs into the primary compartment. Intravenous doses are added to the intravenous compartment at time 0. Vd is the volume of distribution in the 1-compartment model, and for the 2-compartment model. Elimination (e.g., metabolic, renal) is characterized by the rate kelim.
Parameters were estimated by maximizing a likelihood function that assumed that the data were log-normally distributed around the concentrations predicted by the TK model (Cox and Hinkley, 1979). Each data source and chemical was assigned its own standard deviation (σ) for log-normally distributed measurement error, such that a chemical with data from two sources would have two separate standard deviations estimated. Confidence intervals on the estimated parameters were calculated using the Hessian of the likelihood function to estimate standard deviations of the log parameter (Bartlett, 1953a,b). Standard deviations sd around the optimized parameters are reported in Supplementary Table 10 (doi: 10.5061/dryad.32v7b) and remain on the log scale—a 95% confidence interval may be calculated as . Because the log of the parameter was optimized, both arithmetic and geometric means and standard deviations could be calculated, but only geometric means and standard deviations are reported.
Both a 1-compartment and a 2-compartment TK model (Figure 2) were investigated for each chemical. For the 2-compartment model, the standard deviation for parameters that were composites of multiple estimated parameters (e.g., Vd) was calculated by adding the squares of the fractional standard deviations and taking the square root (i.e., quadrature). Both the 1- and 2-compartment models included a separate “gut” compartment from which oral doses were absorbed through a first-order process characterized by the rate kgutabs. To estimate bioavailability, only a fraction, 0 < Fbio < 1, of orally administered doses was absorbed from the gut compartment.
For an oral dose, the 2-compartment model allows for three phases of TK: absorption, distribution to tissues (rate ), and elimination (rate ) (O'Flaherty, 1981). The rate is the effective steady-state elimination rate for the 2-compartment model. The 1-compartment model describes an oral dose with only absorption and elimination phases (steady-state elimination rate is given purely by kelim). For either model, iv doses have no absorption phase.
The R package optimx (Nash, 2014; Nash and Varadhan, 2011) version 2013.8.7 was used to perform a bounded optimization of the likelihood function using the method “L-BFGS-B” that implements the bounded (i.e., limits on lower and upper values) approach (Byrd et al., 1995). The log-transformed parameters were estimated. Rates kgutabs and kelim were estimated with an upper bound of 1000 l/h (i.e., very fast). Fractions were estimated with an upper limit of 1. Volumes of distribution were estimated using a lower bound of 0.01 l. The 2-compartment model was optimized using the slopes of the distribution phase () and elimination phase () which was re-parameterized in terms of the ratio of α to kelim (Rα: kelim) and ratio of β to α (Fβofα) with the constraints that Rα: kelim > 1 and 0 < Fβofα < 1. The steady-state volume of distribution for the 2-compartment model was calculated as (Obach et al., 2008).
Given how we have parameterized our empirical TK models, elimination rate (kelim) is directly estimated and clearance (CLtot, L/h/kg BW) must be calculated as the product of kelim and Vd. In vitro HTTK predicts CLtot as a combination of hepatic metabolism and passive glomerular filtration in the kidneys (Pearce et al., 2017b).
Initial values for the optimizer were chosen using the in vivo data. For both the 1- and 2-compartment models, Vd was determined from the maximum iv concentration and dose (while the new experiments were conducted with a single dose for the oral and iv groups, the literature data sometimes contained multiple dose groups per route). Initial estimates of rates were determined by regression of the concentration data on time. To determine alpha (distribution) and beta (elimination) phase rates for the 2-compartment model, the data were divided in half by time and separate regressions were performed to get initial values. Fbio was initialized whenever oral and iv data were available using the maximum concentrations and doses, and was initially set to 0.5 otherwise. kgutabs was always initially set to 10.
All observations within a factor of two of the limit of quantitation were treated as “censored.” Any prediction below twice the limit of quantitation added the cumulative distribution from zero to the limit to the likelihood. If the limit of quantitation was unknown, it was assumed to be 45% of the lowest observed value.
The optimized likelihood for both the 1- and 2-compartment models were compared using the Akaike Information Criterion (AIC) (Akaike, 1974). Study-specific standard deviations were included in the number of parameters used to calculate AIC (e.g., if there were data from two studies, there were two standard deviation parameters estimated and factored into the AIC). The model with the lesser AIC was always selected (Burnham and Anderson, 2003).
Determination of TK summary statistics from in vivo data
Summary statistics for TK prediction from in vitro data (e.g., AUC and maximal plasma concentration, Cmax) were calculated using the function “solve_pbtk” within the R package “httk” (Pearce et al., 2017b). For each chemical with new in vivo data (as opposed to the literature studies) there were at least three biological replicates. For the purpose of summary statistics only, at each time point all replicates with plasma concentrations above the limit of detection were averaged. The peak plasma concentration (Cmax) was determined as the maximum average measured concentration at any time. The time-integrated plasma concentration (area under the curve or AUC) was determined using the trapezoid rule, summing the product of each time interval between measurements by the average concentration at the time points. Css was calculated for a 1 mg/kg/day dose rate using the estimated total clearance: .
Regressions were performed using the R base function “lm” on the log-transformed data. R2 and mean-squared error (MSE) are reported as calculated by “lm.” When standard deviation estimates were available, each observation was weighted using . Observations without standard deviation estimates were omitted from weighted regressions.
RESULTS
New In Vivo TK Parameter Estimates
Here we report in vivo rat TK data and in vitro–based TK predictions for 45 compounds to evaluate IVIVE methods for TK. The chemicals studied are summarized in Table 1. New in vivo data were collected for 26 non-pharmaceutical compounds; these chemicals were selected to represent the diversity of chemicals that may be present in the environment (e.g., pesticides and plasticizers), in contrast to the pharmaceutical compounds for which IVIVE has been more commonly evaluated.
For each chemical a non-compartmental analysis was performed to identify data issues. The data for formetanate hydrochloride was found to be too noisy for non-compartmental or other analysis. For each of the other chemicals (44 of 45) a single set of parameters for both compartmental models (Figure 2) was optimized to maximize the likelihood of all concentration time-course data for both routes of exposure (if available) and all doses (some literature studies included multiple doses). We note that in the models the bioavailability Fbio is simply a fraction that multiplies the oral dose to (potentially) reduce how much of the chemical is available systemically. Since the model parameters are estimated empirically from in vivo data, the estimated Fbio reported here includes multiple absorption processes as well as first-pass metabolism. For each chemical we used the AIC (Akaike, 1974) to select the more likely of the one- or 2-compartment models. Triclosan and bisphenol A were rapidly metabolized (Doerge et al., 2010), making the oral data on parent compound unsuitable for bioavailability analysis.
Table 2 lists the values estimated for any TK parameters (e.g., Vd, kelim) that could be estimated. Thirty chemicals (19 nonpharmaceuticals) are better described by the 2-compartment model, while 14 (10 nonpharmaceuticals) are better described by the 1-compartment model. Time-course plots and model fits are provided in Supplementary Figures 1 and 2. In Supplementary Figure 1 (1-compartment model) the in vitro predicted concentration time course is provided, but as we do not have predictors for 2-compartment parameters no such predictions are provided in Supplementary Figure 2.
Toxicokinetic Model Parameters Estimated From In Vivo Data
| Compound | Source | Selected Model | Vd (l/kg BW) | kelim (l/h) | CLtot (l/kg BW/h) | kgutabs (l/h) | Fbio | Css (mg/l) |
|---|---|---|---|---|---|---|---|---|
| 2, 4-D | 2 | 1 compartment | 1.2 | 0.66246 | 0.77 | 0.23 | 1.00 | 1.3043 |
| Alachlor | 2 | 2 compartment | 297.7 | 0.17479 | 52.04 | 22.54 | 0.03 | 0.0006 |
| Alprazolam | 3 | 1 compartment | 3.6 | 2.43931 | 8.85 | 0.86 | 0.35 | 0.0400 |
| Antipyrine | 3 | 2 compartment | 1.9 | 0.11394 | 0.22 | NA | NA | NA |
| Bensulide | 1, 2 | 2 compartment | 3.3 | 0.36161 | 1.19 | 3.07 | 0.05 | 0.0447 |
| Bensulide | 1 | 1 compartment | 2.7 | 1.29619 | 3.45 | 1.24 | 0.01 | 0.0027 |
| Bensulide | 2 | 2 compartment | 11.7 | 0.20080 | 2.34 | 23.52 | 0.03 | 0.0112 |
| Bisphenol A | 1 | 2 compartment | 0.3 | 2.51355 | 0.75 | NA | NA | NA |
| Boscalid | 1 | 2 compartment | 46.2 | 0.01977 | 0.91 | 2.18 | 0.25 | 0.2750 |
| Bosentan | 3 | 1 compartment | 2.9 | 0.48757 | 1.43 | 0.86 | 0.41 | 0.2839 |
| Carbaryl | 1 | 2 compartment | 65.4 | 1.34717 | 88.15 | 11.77 | 0.31 | 0.0035 |
| Carbendazim | 3 | 1 compartment | NA | 0.36656 | NA | 0.80 | NA | NA |
| Chloridazon | 2 | 1 compartment | 9.0 | 0.57641 | 5.19 | 0.47 | 1.00 | 0.1925 |
| Chlorpyrifos | 3 | 2 compartment | NA | 0.22851 | NA | 0.58 | NA | NA |
| Cyclanilide | 1 | 2 compartment | 1.2 | 0.00319 | 0.00 | 2.96 | 0.31 | 81.2312 |
| Cyclosporin A | 3 | 2 compartment | 2.0 | 0.08208 | 0.16 | NA | NA | NA |
| Diazinon-o-analog | 2 | 1 compartment | 2.6 | 0.19529 | 0.50 | 1.92 | 0.70 | 1.4054 |
| Diclofenac | 3 | 2 compartment | NA | 0.09625 | NA | 418.30 | NA | NA |
| Diltiazem | 3 | 2 compartment | 4.3 | 0.32378 | 1.39 | 100.87 | 0.17 | 0.1225 |
| Dimethenamid | 1 | 1 compartment | 299.2 | 0.04606 | 13.78 | 102.34 | 0.06 | 0.0040 |
| Etoxazole | 1 | 2 compartment | 27.6 | 0.05884 | 1.63 | 1.52 | 1.00 | 0.6143 |
| Fenarimol | 1 | 2 compartment | 6.5 | 0.26673 | 1.72 | 2.19 | 0.25 | 0.1480 |
| Flufenacet | 2 | 2 compartment | 24.3 | 0.13086 | 3.18 | 29.13 | 0.06 | 0.0198 |
| Hexobarbitone | 3 | 2 compartment | 0.5 | 1.89165 | 0.89 | NA | NA | NA |
| Ibuprofen | 3 | 2 compartment | 0.5 | 0.26688 | 0.12 | NA | NA | NA |
| Imazalil | 1 | 1 compartment | 16.0 | 0.79373 | 12.67 | 5.19 | 0.00 | 0.0002 |
| Imidacloprid | 1 | 1 compartment | 4.7 | 0.08384 | 0.39 | 1.80 | 1.00 | 2.5566 |
| Imipramine | 3 | 2 compartment | 68.5 | 0.02233 | 1.53 | 1.36 | 0.26 | 0.1694 |
| Metoprolol | 3 | 2 compartment | NA | 1.21368 | NA | 1000.00 | NA | NA |
| Midazolam | 3 | 1 compartment | 2.9 | 1.74579 | 5.10 | 0.78 | 0.11 | 0.0217 |
| Nilvadipine | 3 | 2 compartment | 12.0 | 0.24032 | 2.89 | 4.97 | 0.15 | 0.0520 |
| Novaluron | 1 | 2 compartment | 49.3 | 0.00184 | 0.09 | 0.24 | 1.00 | 11.0061 |
| Ondansetron | 3 | 2 compartment | 0.1 | 1.55383 | 0.22 | 352.00 | 0.10 | 0.4418 |
| Perfluorooctanoic acid | 1 | 2 compartment | 1.4 | 0.00034 | 0.00 | 2.19 | 1.00 | 2162.1954 |
| Permethrin | 1 | 2 compartment | 432.8 | 0.03278 | 14.19 | 1.80 | 1.00 | 0.0704 |
| Phenacetin | 3 | 2 compartment | 1.0 | 0.75998 | 0.75 | NA | NA | NA |
| Phenytoin | 3 | 2 compartment | 13.8 | 0.00078 | 0.01 | 1000.00 | 0.30 | 27.5119 |
| Propamocarb hydrochloride | 1 | 1 compartment | 8.5 | 2.44657 | 20.81 | 12.69 | 0.01 | 0.0004 |
| Propyzamide | 1, 2 | 2 compartment | 21.2 | 0.19670 | 4.18 | 1.88 | 1.00 | 0.2393 |
| Propyzamide | 1 | 2 compartment | 17.8 | 0.13389 | 2.38 | 2.74 | 1.00 | 0.4195 |
| Propyzamide | 2 | 1 compartment | 22.8 | 0.15108 | 3.44 | 0.58 | 1.00 | 0.2905 |
| Pyrithiobac sodium | 2 | 2 compartment | 1.8 | 0.28906 | 0.53 | 1.99 | 1.00 | 1.8774 |
| Resmethrin | 1 | 2 compartment | 373.9 | 0.02484 | 9.29 | 1.73 | 1.00 | 0.1076 |
| S-Bioallethrin | 1 | 2 compartment | 46.5 | 0.30404 | 14.13 | 4.18 | 0.12 | 0.0082 |
| Simazine | 1 | 1 compartment | 2.7 | 3.28457 | 8.97 | 1.27 | 0.05 | 0.0054 |
| Tolbutamide | 3 | 1 compartment | 0.2 | 0.19710 | 0.03 | 6.20 | 1.00 | 29.7101 |
| Triclosan | 1 | 1 compartment | 7.2 | 2.71699 | 19.68 | NA | NA | NA |
| Valproic acid | 3 | 2 compartment | 0.2 | 0.58264 | 0.13 | 453.08 | 1.00 | 7.5408 |
Sources: NHEERL,1 RTI,2 and peer-reviewed literature summarized in Wambaugh et al. (2015).3
As described in the Methods, a numerical approximation to the Hessian of the data likelihood function was used to estimate a standard deviation for each parameter. The standard deviation provides an estimate of the confidence or certainty in the parameter value (i.e., larger standard deviations indicate lesser confidence). However, calculating the numerical Hessian failed for some chemicals and parameters, meaning that no estimate of standard deviation could be obtained. Failure likely indicates that the estimated parameter value has not uniquely maximized the likelihood. Thus we have instances where the data are clearly bi-phasic (at least requiring a 2-compartment model) but the data are insufficient to “identify” the specific parameter values (Garcia et al., 2015). We have therefore performed analyses in two ways: using all parameter estimates (ignoring estimated standard deviation), and weighting the estimates by the standard deviation (omitting those chemicals for which the estimate failed, which are likely to be more uncertain estimates). All properties, parameter estimates and log-scale standard deviations are included in Supplementary Table 10 (doi: 10.5061/dryad.32v7b).
In Figure 3, we show the diversity of physico-chemical properties (a mix of estimated and in silico predicted values from EPI Suite, USEPA, 2015), in vitro measured HTTK parameters, and TK parameters estimated from in vivo data. Each property was scaled by the standard deviation across the chemicals and centered by subtracting the mean such that the values indicated by intensity in Figure 3 indicate the number of standard deviations above or below the mean for the 38 chemicals. The bar on the left-hand side of Figure 3 indicates pharmaceuticals (gray) and all other chemicals (black). Hierarchical clustering was used to minimize the Euclidean distance between adjacent pairs of chemicals. This clustering approach is intended to group chemicals with similar properties; however, other than grouping chemicals based upon ionization state (acid, base, or neutral) at the pH of plasma (i.e., pH 7.4), no discernable pattern in the TK properties emerges. The pharmaceutical chemicals appear to be dispersed among the other chemicals; that is, there is no obvious distinction between pharmaceutical and non-pharmaceutical chemicals. This indicates that simple models based upon physico-chemical or even in vitro measured properties may be inadequate for predicting any differences in TK between pharmaceuticals and nonpharmaceuticals.
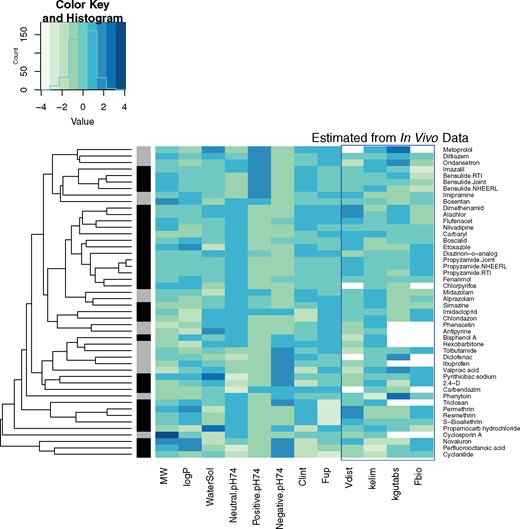
A “heatmap” of physico-chemical properties, in vitro TK parameters (Wetmore et al., 2013), and TK parameters estimated from in vivo plasma concentration. Rows (chemicals) are clustered by Euclidean distance so that adjacent rows are more similar to each other. Each column (chemical properties) was scaled by the standard deviation of the column and the mean value was subtracted, such that a value of 0 corresponds to the mean and values of −1 or 1 correspond to values one standard deviation above or below the chemicals, respectively. In some cases, TK parameters could not be estimated (e.g., no oral data available for estimating Fbio and kgutabs). Fraction of the compound that is neutral, positively, or negatively ionized at pH 7.4 is indicated by “neutral ph74,” “positive ph74,” and “negative ph74.” The bar at the left-hand side indicates pharmaceuticals in gray and other chemicals in black.
The new in vivo experiments were conducted in two separate laboratories (NHEERL and RTI), with two common chemicals between the labs: propyzamide and bensulide. The data from the two laboratories was analyzed separately (indicated by the postfix “.NHEERL” and “.RTI” in Figure 3) and jointly (indicated by “.Joint”). Both chemicals cluster together indicating similarity, although the clustering algorithm considers physico-chemical properties and in vitro HTTK data in addition to estimated TK parameters (i.e., the chemicals are already similar due to shared properties). The analytical chemistry for these two chemicals was more sensitive in the RTI laboratory, leading to more (lower) concentrations measured at later time points. For propyzamide, the estimated parameters are very consistent between the two labs for Vd, kelim, kgutabs, and Fbio. For bensulide, the concentrations measured by the two labs appear to be described by a 2-compartment model, and overlap in the alpha phase. However, there are relatively few points in the beta phase for the RTI data and none for NHEERL data set, leading to disagreement, for example, on the estimates for Vd and kelim. This is a problem with parameter estimation, and not a disagreement between the data sets, which clearly overlap (see Supplementary Figs. 1 and 2).
Evaluating Predictions of Volume of Distribution
In Figure 4, we evaluate the HTTK predicted Vd (Pearce et al., 2017a) against the values inferred from the in vivo experiments. Chemicals are plotted by name to aid in identification of outliers. If the best model selected was a 2-compartment model, we used the steady-state volume of distribution (sum of the 2-compartment volumes) (Obach et al., 2008). In panel A, we observe a weak trend, with bisphenol A and ondansetron appearing as obvious outliers. Our estimated Vd for bisphenol A is roughly a 10th of what has been observed in other studies (Doerge et al., 2010; Yoo et al., 2000) indicating that measurement error may have been a factor. A larger Vd for bisphenol A would be more consistent with the predictions from HTTK.
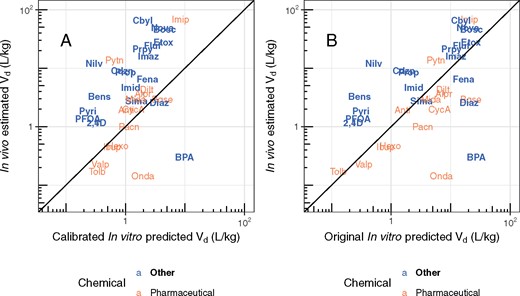
Comparison of measured volumes of distribution (Vd) with predictions based upon in vitro data and in silico methods (Pearce et al., 2017a; Schmitt, 2008). The solid line in each panel indicates the identity line (1:1, perfect predictions). Chemicals can be identified by their chemical abbreviation given in Table 1.
Pearce et al. (2017a) calibrated the Schmitt (2008) method by analyzing a data set of mostly pharmaceutical compounds and using linear regression to account for tissue-specific prediction error (e.g., bias). These calibrations therefore may be expected to be more appropriate for pharmaceuticals than other chemicals classes. When these calibrations are removed, as in panel B of Figure 4, the MSE is reduced from 4.4 to 2.9. The range of predictions is observed to be broader, with many Vd predicted to be greater than 10 l/kg bodyweight. Thus, it may be that the mostly pharmaceutical data set in Pearce et al. (2017a) is biased toward chemicals with lower Vd than is observed for broader classes of chemicals. Ideally, the Pearce et al. (2017a) calibrations might be repeated using more chemicals with greater tissue partitioning.
Evaluating Predictions of Clearance
We next evaluate in vitro HTTK predictions of total clearance. In Figure 5 we compare against the clearance estimated from in vivo data (i.e., Vd * kelim). Parameter estimates for the more likely empirical TK model (or non-compartmental estimates) are used for each chemical. When analyzing pharmaceuticals and nonpharmaceuticals separately, we observe some predictive ability for both classes of chemicals. Most importantly, hepatic metabolism-based HTTK methods are shown to underestimate total clearance of nonpharmaceuticals more so than they underestimate total clearance of pharmaceuticals, pointing to a larger role for extra-hepatic metabolism in non-pharmaceutical chemicals.
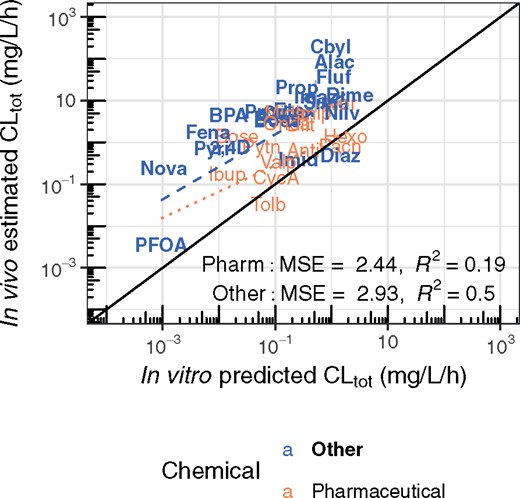
Comparison of the TK clearance estimated from the in vivo data with the clearance predictions made using HTTK data. The more likely empirical TK model (either 1 or 2 compartments, as in Figure 2) is selected for each chemical using the AIC (Akaike, 1974). Estimated standard deviation is indicated by a vertical line, and is often smaller than the plotted text. The solid line indicates the identity line (1:1, perfect predictions), while the dotted and dashed lines indicate the linear regression (log-scale) trend lines for pharmaceuticals and other chemicals, respectively. Chemicals can be identified by their chemical abbreviation given in Table 1.
Evaluating Assumptions about Oral Bioavailability
In Figure 6, we examine the distribution of estimated absorption rates. Previous IVIVE approaches have assumed that 1 l/h was a sufficiently “fast” rate of absorption (kgutabs) usable for all chemicals (Wambaugh et al., 2015). We find that the average value for kgutabs (approximately 44.5 l/h) is much faster than previously assumed although the median value is only 2.2 l/h. It also is evident that there are a few chemicals with absorption rates significantly faster (max rate was cut off at 1000 l/h) or slower (minimum of approximately 0.23 l/h) than average.
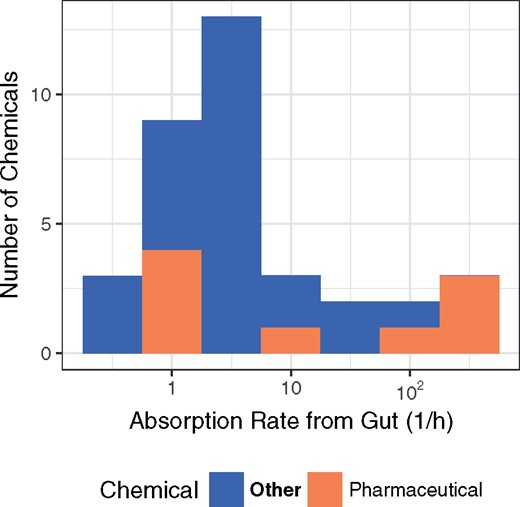
Distribution of gut absorption rate for environmental and pharmaceutical chemicals.
In our models, Fbio is an overall multiplier of oral dose, such that a compound with Fbio= 0.1 has a tissue exposure a 10th that of a compound with Fbio= 1. Therefore, predicting Fbio is critical to IVIVE, especially for attempts to predict in vivo toxicological effects from in vitro data. In panel A of Figure 7, we compare predictions of Fbio as estimated using Gastroplus (Lukacova et al., 2009) with the values we estimate from contrasting oral and intravenous time course data. Unfortunately, we do not observe much concordance between model predictions and in vivo estimated Fbio. In panel B of Figure 7, we show that the estimates of Fbio ranged from 0.098 to 1 for pharmaceutical compounds, but was observed to be as low as 0.00296 (imazalil) for other compounds.
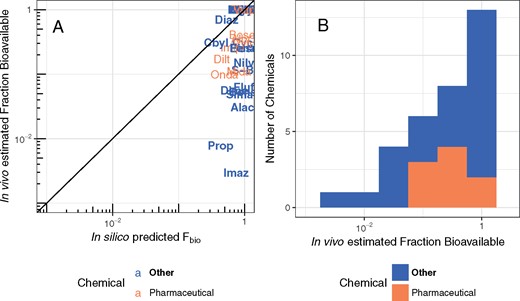
In panel A, the observed fraction of oral dose absorbed from the gut is compared with predictions made using gastroplus (Simulations Plus, 2017). The solid line indicates the identity line (1:1, perfect predictions). These fractions are distrusted from nearly 0 to effectively 100% (panel B). Chemicals can be identified by their chemical abbreviation given in Table 1.
Evaluating Predictions of Steady-State Plasma Concentration
The estimated TK parameters can in turn be used to calculate TK summary statistics that have been used for IVIVE of bioactivity assays, including Css (Ring et al., 2017; Rotroff et al., 2010; Wetmore et al., 2012, 2013,, 2014, 2015), Cmax (Sipes et al., 2017), and AUC (Wambaugh et al., 2013). In Figure 8, we compare the Css calculated using the in vivo-estimated clearance with in vitro-based predictions for the Css that would result from a fixed infusion dosing rate of 1 mg/kg bodyweight/day. These Css values are used to infer an exposure that would cause plasma concentration equal to in vitro concentrations that have been identified as bioactive. Since we generally under-predict clearance, in panel A of Figure 8 we see a pronounced tendency to overestimate Css when using HTTK in vitro methods. The bias and predictive ability are similar to that found using heterogeneous literature data for humans in Wambaugh et al. (2015).
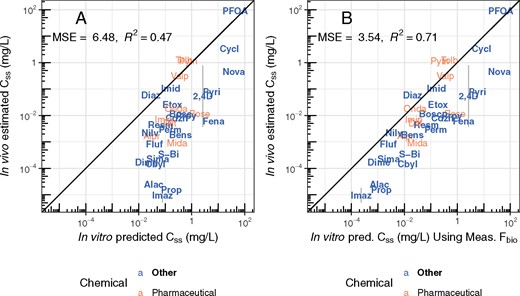
Rat in vivo data were collected for diverse environmental chemicals to evaluate the predictive ability of HTTK, especially with respect to predicting steady-state serum concentration (Css). Chemicals can be identified by their chemical abbreviation given in Table 1. The abbreviations are centered at the measured and predicted values. The solid line indicates the identity line (1:1, perfect predictions). In panel A, the 1-compartment model is parameterized with a predicted volume of distribution and clearance, based upon in vitro measured parameters. Fbio is assumed to be 100%. In panel B, the in vivo measured Fbio is used to reduce the amount of the oral dose absorbed in the 1-compartment model, to illustrate the improvement possible if Fbio could be predicted accurately.
In panel B of Figure 8, the in vivo measured Fbio is used to illustrate the improvement possible if Fbio could be predicted accurately. For the model predictions in panel A Fbio is assumed to be 100%. In panel B, the in vivo measured Fbio is used to reduce the amount of the oral dose absorbed in the 1-compartment model, to illustrate the improvement possible if Fbio could be predicted accurately. Accurate knowledge of Fbio would improve the variance explained to an R2 of 0.71 and reduce the MSE of the predictions.
Evaluating Predictions of HTTK Uncertainty
Bias in predicting Css can be accounted for in risk prioritization if the degree of that bias can be predicted on a per chemical basis. HTTK methods do not always under-estimate clearance. Wambaugh et al. (2015) developed a method for prediction of HTTK-based Css biases, which indicated that many chemicals should be within a factor of 3 of in vivo data, while most other chemicals should be overestimated (i.e., health conservative for reverse dosimetry). In Figure 9, we evaluate those predicted biases. Chemicals were predicted to be in one of six categories, five indicating the degree to which Css was expected to be over- or under-estimated, and one indicating problematic aspects of the chemical or assays that prevented the chemical from being placed in the other five categories. The thick gray bars in Figure 9 indicate where a chemical should appear to be consistent with its predicted error. We note that none of our evaluation chemicals were predicted to be underestimated between 3.2 and 10 times so that bin is not present. The balanced accuracy of the Wambaugh et al. (2015) method for the “on the order” category was only 64%, and here we see that the method tends to underestimate the degree to which in vitro HTTK methods overestimate Css.
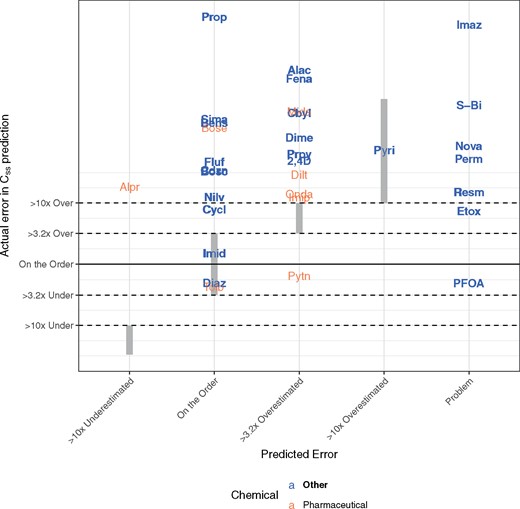
Evaluation of Wambaugh et al. (2015) classification scheme for predicting errors made when using HTTK data to predict in vivo steady-state plasma concentration (Css). Chemicals were placed into categories, depending upon the size of the error. “On the order” represented the best case, where errors were within 3.2 times over or under the true value. Some chemicals were determined to be problematic due to limitations in the HTTK methods (e.g., plasma protein binding estimation) or failure to come to steady state. Wherever the chemical names overlap the vertical, gray bands, the observed errors are consistent with predicted error. Chemicals can be identified by their chemical abbreviation given in Table 1.
Of the chemicals analyzed for which Css could be estimated in vivo, the HTTK uncertainty predictions estimated that only alprazolam would be underestimated significantly. Four chemicals in Figure 9 (the pharmaceuticals phenytoin and tolbutamide, the perfluorinated surfactant PFOA, and the pesticide diazinon) were observed to be underestimated. Diazinon and tolbutamide were predicted to be “on the order” (within a factor of 3) which was consistent with the amount of error observed. Phenytoin was expected to be more than three times overestimated but was actually on the order.
For the chemicals that were expected to be either “on the order” (i.e., within 3.2× of the prediction) or slightly overestimated (within 3.2 to 10× of the prediction) we do see some chemicals correctly categorized, but most are in fact greatly overestimated (>10× the prediction). All chemicals for which the Wambaugh et al. (2015) method could not make predictions (“problem” chemicals) has overestimated Css. As in Figure 8, the bias toward over-prediction is a conservative error for reverse dosimetry applications.
Evaluating Predictions of Maximum and Time-Integrated Plasma Concentration
The maximum plasma concentration (Cmax) has also been used for HTTK-based risk priority setting (Sipes et al., 2017). In Figure 10, a single point is plotted comparing in vivo derived Cmax with predicted Cmax for each combination of chemical, dose amount, and dose route, either iv or oral (po) (all values for Figs. 10 and 11 are provided in Supplementary Table 11, doi: 10.5061/dryad.32v7b). As in Figure 8, the model has been considered both with assumption of 100% absorbed (panel A) and the in vivo estimated Fbio (panel B). In both panels of Figure 10, the 1-compartment model is parameterized with the predicted volume of distribution and clearance, based upon in vitro measured parameters. Accurate knowledge of Fbio would improve the variance explained from an R2 of 0.48 and MSE of 5 in panel A to an R2 of 0.73 and MSE of 2.7 in panel B.
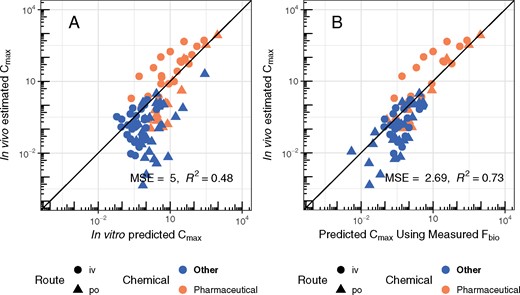
Evaluation of the ability of in vitro HTTK data, coupled with a 1-compartment model, to predict important TK statistics like the maximum plasma concentration (Cmax) for characterizing tissue exposure. A single point is plotted for each combination of chemical, dose amount, and dose route, either intravenous (iv) or per oral (po). In panel A, the 1-compartment model is parameterized with a predicted volume of distribution and clearance, based upon in vitro measured parameters. Fbio is assumed to be 100%. In panel B, the in vivo measured Fbio is used to reduce the amount of the oral dose absorbed in the 1-compartment model, to illustrate the improvement possible if Fbio could be predicted accurately.
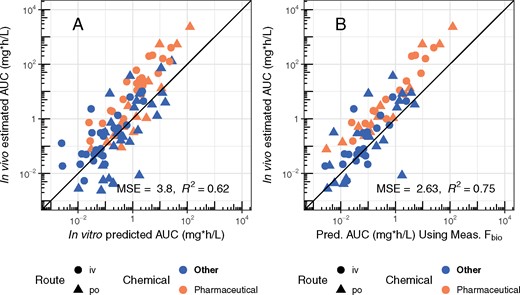
Evaluation of predictions for the time-integrated plasma concentration (i.e., AUC). A single point is plotted for each combination of chemical, dose amount, and dose route, either intravenous (iv) or per oral (po). In panel A, the 1-compartment model is parameterized with a predicted volume of distribution and clearance, based upon in vitro measured parameters. Fbio is assumed to be 100%. In panel B, the in vivo measured Fbio is used to reduce the amount of the oral dose absorbed in the 1-compartment model, to illustrate the improvement possible if Fbio could be predicted accurately. The solid line in each panel indicates the identity line (1:1, perfect predictions).
Similarly, in Figure 11, we evaluate our ability to predict time-integrated plasma concentration (area under the curve or AUC). Each plot point compares in vivo derived Cmax with predicted Cmax for each combination of chemical, dose amount, and dose route, either iv or po. In panel A of Figure 11, the in vivo calculated the 1-compartment model is parameterized with the predicted volume of distribution and clearance, based upon in vitro measured parameters. For the model predictions, Fbio is assumed to be 100%. In panel B, the in vivo measured Fbio is used to reduce the amount of the oral dose absorbed in the 1-compartment model, to illustrate the improvement possible if Fbio could be predicted accurately. Accurate knowledge of Fbio would improve the variance explained from an R2 of 0.62 in panel A to an R2 of 0.75 in panel B.
DISCUSSION
New In Vivo TK Data for Non-Pharmaceutical Chemicals
Here we report on new, in vivo TK experiments in rat for 26 non-pharmaceutical chemicals. The new data were collected from two different laboratories (EPA NHEERL and RTI), with two overlapping chemicals (bensulide and propyzamide), which demonstrated sufficient consistency to provide confidence in the standardized TK experimental protocol that was used by both laboratories. We applied a uniform statistical analysis approach to estimate relevant TK parameters (e.g., volume of distribution, rate of elimination) for both these chemicals and in vivo rat data from an additional 19 chemicals from previously published studies. For all chemicals there were rat-specific HTTK data allowing direct evaluation of IVIVE for rat. We evaluated 4 key issues in IVIVE: oral bioavailability, underestimation of clearance, volume of distribution, and expected uncertainty (i.e., predictive error).
A systematic curve fitting approach was used to analyze the concentration time-course data for each chemical. Each chemical required development of a separate analytical chemistry method. These analytical chemistry methods are more or less accurate depending upon the ability to distinguish mass spectrometry features corresponding to the test chemical from the significant background due to the plasma itself. Further, since a standardized test protocol with the same time points for each chemical was used, those chemicals with clearance that is either too rapid or too slow to be observed at these points are expected to be ill-characterized. Finally, we note that it was of particular methodological importance to properly handle data that were below the limit of quantitation using censored likelihoods in order to achieve proper curve fits.
Bioavailability experiments, either in vivo or potentially in vitro, are clearly needed to provide data to allow better prediction of Fbio. Pharmaceutical chemicals are typically designed to be well absorbed (Lipinski, 2004) and the default Fbio used for previous reverse dosimetry studies has been 100% (Wetmore et al., 2015). Here Fbio was estimated to range from 0.1 to 1 for pharmaceutical compounds, but was observed to be as low as 0.003 for other compounds. We found that knowledge of Fbio, which includes fraction absorbed from the gut and first-pass metabolism, would improve overall ability to predict TK; that is, in vitro HTTK predictions of Css, AUC, and Cmax improved when in vivo measured Fbio values were used. Tools developed to predict the absorption of pharmaceuticals (Lukacova et al., 2009) were not able to predict Fbio for non-pharmaceutical chemicals. However, these tools were used in the most basic functionality (i.e., prediction from physico-chemical properties and dose alone). Additional data, such as in vitro measures of membrane transport (e.g., CACO2, Hubatsch et al., 2007) are known to enhance the prediction of bioavailability of pharmaceuticals (Camenisch, 2016). A revised analytical chemistry protocol for rapid in vivo TK studies that separates samples to treat and potentially unconjugate rapid metabolites may produce a better estimate of bioavailability in some cases (e.g., bisphenol A, Doerge et al., 2010).
The absorption rates (kgutabs) reported here are especially valuable since no in silico tool exists for predicting absorption rate. The median rate observed was faster than the default assumption of 1 l/h used in the HTTK R package, and has been adopted in the new version 1.8 of that software. Additional analysis of the relationship between kgutabs, Fbio, and physico-chemical properties may eventually yield in silico relationships to allow categorization of chemicals if not outright prediction of these quantities, but additional in vivo data may first need to be either mined from the scientific literature or collected from new experiments in order to allow sufficient statistical analysis.
In vitro hepatocyte metabolism methods are well known to underestimate total clearance (Brown et al., 2007; Hallifax and Houston, 2009; Wetmore et al., 2012,, 2015), leading HTTK methods to over-predict quantities such as Css (Wambaugh et al., 2015; Yoon et al., 2014). We observed that the underestimation of total clearance appears more pronounced for non-pharmaceutical chemicals. Underestimation of clearance could be due to inadequacies of in vitro hepatocyte systems for reproducing hepatic clearance, inappropriate model assumptions (e.g., restrictive hepatic metabolism), or neglected biological mechanisms such as extrahepatic metabolism, biliary clearance, or active transport in the kidneys (as in the hypothesized saturable renal resorption of some perfluorinated fatty acid analogs (Andersen et al., 2006)).
HTTK methods rely upon in vitro methodologies that are subject to the well-known limitations of in vitro assays with respect to chemical partitioning (Groothuis et al., 2015; Gulden and Seibert, 2003). Often the nominal concentration (say 1 uM) might be expected to differ from the actual free concentration that is being assayed due to factors such as chemical binding to the walls of the in vitro test well (Armitage et al., 2014; Fischer et al., 2017). However, both the hepatic clearance and plasma protein binding assays are conducted in a way to minimize some of these problems since only the relative concentrations with respect to time is needed for clearance and the relative concentration between wells with and without plasma is needed for plasma binding (Shibata et al., 2002; Waters et al., 2008). For the clearance assay, less than nominal chemical concentration would act to reduce the impact of potential metabolic saturation, meaning that the nominal concentration in vivo might produce a slower metabolism rate. For the plasma binding assay, if non-plasma binding prevents the chemical from truly coming to equilibrium between the free and plasma components then plasma binding might be overestimated, which may act to underestimate predicted clearance.
We found that the chemical plasma concentration as a function of time for many of the chemicals were better described using a bi-phasic (i.e., 2-compartment) model with pronounced distribution and elimination phases. The terminal (elimination) phase of a bi-phasic model is slower than the distribution phase (O'Flaherty, 1981). Thus, past estimates of in vivo clearance may in fact be over-estimates, confounded by distribution to tissues.
Statistically guided approaches rely upon large data sets, and even the 45 chemicals here are likely insufficient to allow the association of chemical structure features with TK properties (Golbraikh et al., 2014). There are many other data sets that exist, for instance those that are reported only as graphics (i.e., figures) in the scientific literature. Obtaining these data in a format that allows analysis should improve statistical modeling. Further, we observed in the case of bisphenol A that it might be desirable to supplement the data generated here with measurements from experiments that focused on a single chemical and its metabolites (Doerge et al., 2010; Yoo et al., 2000). If the set of chemicals with plasma concentration vs. time data can be expanded, using both novel and/or literature data, then the standardized analysis tools developed here can be applied to develop a larger data set for further analysis. Any concentration vs. time data could be distributed as part of the R package “httk” and made available to other public databases.
The Predictive Ability of HTTK Methods
We have used a minimal (6–8 animal) study design to generate new in vivo TK studies that, along with literature data, allow evaluation of several aspects of HTTK-based IVIVE. While we identify areas for improvement, including prediction of bioavailability, we find that it is possible to predict some in vivo TK parameters (Vd) and statistics (AUC, Cmax, and Css) using a combination of in vitro assays and mathematical models. Many predictions were greatly improved when measured data on the fraction bioavailable was available.
The MSE indicated that AUC could be predicted better than Cmax, which could be predicted better than Css. A likely explanation is that while the Css used here is independent of dose because it is calculated for all chemicals at the same exposure rate of 1 mg/kg BW/day, both Cmax and AUC depend upon dose. For the available evaluation data, the linear dose models are apparently sufficient to explain some dose-related differences between treatments. We note that while we have evaluated summary statistics, it might also be possible to compare chemical-specific goodness of fit for the entire concentration time course.
We find that ability to predict total (whole body) clearance from hepatic metabolism and passive renal excretion is relatively weak. We observed that the total clearance may be under-estimated more for nonpharmaceuticals than for pharmaceuticals, indicating a greater need to characterize extra-hepatic metabolism for those compounds (Wilk-Zasadna et al., 2015). We have used in vitro metabolism data from experiments conducted at 1 µM with the assumption that metabolism is linear (i.e., not saturated) at that concentration. If metabolism is actually saturated in vitro and real world exposures lead to lower concentrations than were tested, then the in vivo clearance would be higher and Css would be lower. This underestimation would be another source of conservative bias.
Although HTTK is uncertain, if that uncertainty can be quantified and predicted then HTTK may be suitable for many applications. Past reverse dosimetry work for risk prioritizations have argued that the tendency of HTTK to bias toward the over-estimation of Css is a conservative error in that it reduces the predicted margin between potentially hazardous doses and possible exposure (Ring et al., 2017; Rotroff et al., 2010; Thomas et al., 2013; Tonnelier et al., 2012; Wetmore et al., 2012,, 2015). If, for a given chemical, Css is not overestimated then this conservative bias is not present, making careful characterization of error in HTTK predictions even more important. The Wambaugh et al. (2015) method for predicting HTTK uncertainty appears to be conservatively biased—the degree of overestimation (predicted Css divided by in vivo Css) for most chemicals is larger than predicted. Among all the chemicals examined, only two had smaller errors than predicted. It is important to note that overestimation of tissue concentrations is only a conservative bias for reverse dosimetry applications where a dose capable of causing a given tissue concentration is back-calculated. If TK predictions of tissue concentrations associated with a dose known to cause toxicity are overestimates (i.e., using forward dosimetry), then the chemical is in fact more potent than estimated (Bell et al., 2018). Eventually new machine learning models (Wambaugh et al., 2015) and other classification systems (Camenisch, 2016) may need to be revised using data from non-pharmaceutical chemicals.
Finally, we found that predictions of volume of distribution (Vd) calibrated using data on pharmaceutical chemicals were not effective for more diverse chemicals. Most of the compounds examined in Pearce et al. (2017a) were pharmaceuticals, and it may be that there are aspects of chemical partitioning that are not present among pharmaceuticals that need to be better considered when predicting partitioning of other chemical classes.
HTTK methods as they stand appear appropriate for predicting TK in the absence of other data, as is the case for thousands of chemicals. IVIVE methods may enable the use of high throughput in vitro toxicity screening to prioritize chemicals on the basis of risk posed to human health (Thomas et al., 2013). IVIVE has more typically been performed on a single chemical basis using detailed physiologically based TK (PBTK) models with chemical-specific insight into toxicodynamics (Rostami‐Hodjegan, 2012; Yoon et al., 2012). If higher throughput methods for TK can be used with confidence (Wetmore, 2015), then chemicals might be screened in a cost-effective and efficient manner that also significantly reduces animal testing (Basketter et al., 2012; Bessems et al., 2014; Coecke et al., 2013).
SUPPLEMENTARY DATA
Supplementary data are available at Toxicological Sciences online.
ACKNOWLEDGMENTS
This project was supported by appointments to the Internship/Research Participation Program at the Office of Research and Development, U.S. Environmental Protection Agency, administered by the Oak Ridge Institute for Science and Education through an interagency agreement between the U.S. Department of Energy and EPA. We thank Annie Lumen and Rogelio Tornero-Velez for providing technical review of this manuscript. We thank David Ross, Brenda Edwards, Yusupha Sey, Beth Padnos, Hunter Hayes, and William Green for technical assistance in the conduct of the in vivo experiments.
FUNDING
The United States Environmental Protection Agency through its Office of Research and Development funded the research described here. The Oak Ridge Institute for Science and Education provided funding for C. Ring and R. Pearce. Caroline L. Ring is now employed by ToxStrategies, Inc., a scientific consulting firm whose clients include private industry, trade associations, and governmental entities. However, Dr. Ring received no funding from ToxStrategies or any of its clients for this project, and neither ToxStrategies nor any of its clients was involved in the development or approval of this research or this report. The National Institute of Environmental Health Sciences provided funding for N.S. Sipes.
REFERENCES
Author notes
Present address: ToxStrategies, Inc.
Disclaimer: The views expressed in this article are those of the authors and do not necessarily represent the views or policies of the U.S. Environmental Protection Agency. Reference to commercial products or services does not constitute endorsement.

Comments