


Abstract
Particulate matter (PM) and ozone (O3) are dominant air pollutants that contribute to development and exacerbation of multiple cardiopulmonary diseases. Mature adults with cardiovascular disease (CVD) are particularly susceptible to air pollution-related cardiopulmonary morbidities and mortalities. The aim was to investigate the biologic potency of ultrafine particulate matter (UFPM) combined with O3 in the lungs of mature adult normotensive and spontaneously hypertensive (SH) Wistar-Kyoto rats. Conscious, mature adult male normal Wistar-Kyoto (NW) and SH rats were exposed to one of the following atmospheres: filtered air (FA); UFPM (∼ 250 μg/m3); O3 (1.0 ppm); or UFPM + O3 (∼ 250 μg/m3 + 1.0 ppm) combined for 6 h, followed by an 8 h FA recovery period. Lung sections were evaluated for lesions in the large airways, terminal bronchiolar/alveolar duct regions, alveolar parenchyma, and vasculature. NW and SH rats were similarly affected by the combined-pollutant exposure, displaying severe injury in both large and small airways. SH rats were particularly susceptible to O3 exposure, exhibiting increased injury scores in terminal bronchioles and epithelial degeneration in large airways. UFPM-exposure groups had minimal histologic changes. The chemical composition of UFPM was altered by the addition of O3, indicating that ozonolysis promoted compound degradation. O3 increased the biologic potency of UFPM, resulting in greater lung injury following exposure. Pathologic manifestations of CVD may confer susceptibility to air pollution by impairing normal lung defenses and responses to exposure.
Ambient air pollution is a major contributor to the global burden of disease (Cohen et al., 2005). Particulate matter (PM) and ozone (O3) are ubiquitous components of air pollution correlated with cardiopulmonary morbidities and mortalities in mature adult populations, particularly individuals with cardiovascular disease (CVD) (Brook et al., 2010). Although both PM and O3 affect the cardiopulmonary system (Bell et al., 2004), fine (PM2.5, aerodynamic diameter < 2.5 μm) and ultrafine particulates (PM0.1, aerodynamic diameter < 0.1 μm) are the most consistently associated with adverse health effects (Hoek et al., 2010; Lanzinger et al., 2016). Atmospheric interactions between PM and O3 may have additive exposure-related health effects (Hoek et al., 1997; Pönkä et al., 1998). As a potent oxidant, O3 readily reacts with chemical constituents adsorbed onto the PM surface, specifically, polycyclic aromatic hydrocarbons (PAHs) (Pitts et al., 1980). Ozonation of ambient PM increases the biologic potency of PAHs and other aromatics present on the surface of PM (Kozumbo and Agarwal, 1990; Madden et al., 2000; Pitts et al., 1986). Because vehicular exhaust is the dominant contributor of atmospheric PM0.1 and PM2.5, as well as a primary source of O3, reactions between PM and O3 are particularly relevant in areas with high traffic. Evidence from some studies suggest that simultaneous exposure to PM and O3 may increase pulmonary injury and inflammation, however, reported results are inconsistent with epidemiologic data (Bouthillier et al., 1998; Elder et al., 2000).
Aging is a progressive process of decline that leads to compromised physiological function, even in the absence of disease (Janssens et al., 1999; Zeleznik, 2003). This progressive deterioration is particularly notable in the lung; age-related changes affect immune responses and antioxidant defenses in addition to altering airway receptor activity (Wang et al., 2010). Structural changes also can occur, impairing lung compliance and increasing work associated with breathing (Green and Pinkerton, 2004). These age-related changes are accelerated by pathologic manifestations of CVD, which is prevalent among mature adult populations (Bentayeb et al., 2012). In mature adults, acute exposure to air pollution is associated with increased incidence of cardiopulmonary-related hospital admissions (Fan et al., 2009; Schwartz, 1995) Furthermore, mature adults with CVD exposed to traffic-related air pollution are at increased risk for cardiovascular (CV)-related events, including myocardial infarction (Peters et al., 2001). It is clear from the epidemiologic data that the incidence and severity of air pollution-induced adverse health effects are much greater in mature adults with CVD, compared to younger healthy populations. However, examination of the pulmonary effects of PM0.1 or O3 in an animal model predisposed to CVD has been limited (Dye et al., 2015; Elder et al., 2004; Kodavanti et al., 2015). Furthermore, to our knowledge, no studies have investigated the effects of combined exposure to PM0.1 and O3 in mature adult animals with fully developed CVD.
In the current study, we examined lung injury and inflammation resulting from acute exposure to either ultrafine particulate matter (UFPM), O3, or UFPM and O3 combined (UFPM + O3), in mature adult Normal Wistar-Kyoto (NW) and spontaneously hypertensive (SH) rats. In this animal model of CVD, mature adults (36–54-week-old) demonstrate common manifestations of CVD (i.e., unprovoked atrial tachyarrhythmias and decreased heart rate variability) (Scridon et al., 2012). We created a combined-pollutant exposure atmosphere containing O3 and premixed flame-generated PM0.1 particulates. We hypothesized that the combination of UFPM and O3 increases the biologic potency of exposure, resulting in increased lung injury and inflammation. Furthermore, we hypothesized that CVD alters normal physiologic responses, exacerbating the pathologic effects of single and combined-pollutant exposure. The objectives of this study were: (1) to characterize the UFPM + O3 atmosphere and quantify free and fused PAH content within the exposure chamber, (2) to define UFPM + O3 effect on lung injury and inflammation in mature adults, and (3) to determine whether CVD impacts susceptibility to air pollution.
MATERIALS AND METHODS
Animals and housing
This study adheres to the ARRIVE guidelines for animal research (Kilkenny et al., 2010). The Institutional Animal Care and Use Committee at the University of California, Davis (Davis, CA) approved this study following guidelines mandated by the U.S. Federal Government (PL 89-544, 1966). Mature adult male NW and SH rats were delivered from the vendors (Charles River, Laboratories, Wilmington, MA; and Envigo Laboratories, Indianapolis, IN) and housed in filtered air (FA) chambers in facilities approved by the American Association for Accreditation of Laboratory Animal Care. Rats were housed in a temperature- (22.0 ± 1.0°) and humidity-controlled (55.0 ± 5%) room with a 12 h light/dark cycle and air turnover 10 times per hour.
Telemetry implantation
Rats were acclimated for at least 5 days in vivarium following delivery prior to undergoing surgical procedures. Rats were fasted for a minimum of 12 h prior to surgery. Rats were anesthetized with 3%–5% isoflourane and a two-lead biopotential telemeter (TR50B Millar, Inc) was then placed in the abdominal cavity and the telemeter leads secured to the thorax. After anesthesia but prior to surgery, rats were treated with meloxicam (2 mg/kg, SQ) and enrofloxacin (5 mg/kg, IM). Lead placement sites were chosen to minimize artifact associated with breathing and movement. Following surgery rats were treated with 0.01 mg/kg buprenorphine (SQ) and 2 mg/kg meloxicam (SQ) and allowed to recover. Rats were monitored every half an hour for 24 h post-surgery and returned to the vivarium. Rats were monitored daily for mobility, pain, and suture integrity for 12 days. Rats were studied approximately 2 weeks post-surgery (Table 1).
Baseline Characteristics of NW and SH Exposure Groups
| NW | SH | |||||||
|---|---|---|---|---|---|---|---|---|
| FA n =11 | UFPM n = 9 | O3n = 8 | UFPM + O3n = 10 | FA n = 12 | UFPM n = 8 | O3n = 10 | UFPM + O3n = 12 | |
| Age (wks) | 47.5 ± 1.2 | 47.7 ± 1.6 | 48.9 ± 2.6 | 46.7 ± 1.8 | 44.9 ± 0.9 | 46.3 ± 1.0 | 45.0 ± 1.3 | 45.6 ± 1.8 |
| Weight (g) | 592.2 ± 15.0 | 595.4 ± 19.9 | 599.4 ± 28.8 | 582.6 ± 22.7 | 326.3 ± 6.7 | 336.5 ± 7.3 | 326.7 ± 9.5 | 331.2 ± 12.9 |
| TI/E (wks) | 2.5 ± 0.3 | 3.5 ± 0.4 | 2.4 ± 0.2 | 2.6 ± 0.2 | 3.3 ± 0.5 | 2.3 ± 0.1 | 2.5 ± 0.2 | 2.8 ± 0.4 |
Note: Mean age, weight, and number of weeks post-telemeter implantation of NW and SH rats on date of experimental exposure. Abbreviations: NW, normal Wistar rat; SH, spontaneously hypertensive rat; FA, filtered air; UFPM, ultrafine particulate matter; O3, ozone; UFPM + O3, ultrafine particulate matter combined with ozone; wks, age in weeks; wks, time between telemeter implantation and exposure (TI/E). Values are shown as the means ± SEM.
Experimental exposure protocol
Age-matched mature adult NW and SH rats were randomly assigned to one of the four experimental exposure groups 1 week prior to the study. Rodent characteristics (e.g., age and weight) of each experimental exposure group are reported in Table 1. On the day of study, rats were transferred into a standard rodent cage with an open wire mesh top with a perforated Teflon plate inserted ∼1 inch above bottom of the standard cage. Rats were placed in exposure chamber at least 1 h prior to exposure protocol. Rats underwent a whole-body exposure to one of the following experimental atmospheres: (1) FA; (2) ∼250 μg/m3 UFPM; (3) 1.0 ppm O3; and, (4) ∼250 μg/m3 UFPM and 1.0 ppm O3 (UFPM + O3). Total number of rats per exposure group are reported in Table 1. The experimental protocol was: (1) 1 h FA control period, (2) 6 h exposure period, and (3) 8 h FA recovery period. Rats were necropsied immediately following 8 h recovery period. Rats had ad libitum access to food (Laboratory Rodent Diet 5001, LabDiet, St. Louis, MO) and water throughout protocol. Protocols began at ∼5:00 pm (PST) and concluded the following morning at ∼8:00 am (PST); standard vivaria 12 h light/dark cycle was maintained. Telemetry data were collected continuously throughout the experimental exposure protocol; resulting data are analyzed and reported elsewhere (submitted).
Ozone generation and monitoring
Ozone was generated as described previously (Schelegle et al., 2001) by passing oxygen through an ozonizer (model 100, Sanders, Uetze-Eltze, Germany). After being mixed with FA, the gas was delivered (10 L/min) to the top compartment of the exposure chamber. All flows were controlled using mass flow controllers (Tylan General, San Diego, CA). The concentration of ozone was kept constant using a proportional controller (Inhalation Facility, University of California, Davis, California Regional Primate Research Center, Davis, CA) interfaced with an ultraviolet ozone analyzer (model 1003-AH, Dasibi Environmental, Glendale, CA). The ozone analyzer was calibrated using the ultraviolet absorption photometric method at the University of California, Davis, California Regional Primate Research Center.
Particle generation and monitoring
UFPM was generated using a co-annular premixed flame burner (Lee et al., 2010). The burner consists of a 7.1-mm tube (inner diameter) surrounded by an 88.9-mm concentric outer tube (inner diameter) and is enclosed in a Pyrex tube to isolate the burner from ambient air. A mixture of ethylene, oxygen, and argon was metered through the inner tube using mass flow controllers (model 647C flow control unit and model 1179A and M100B flow control valves, MKS Instruments, Andover, MA). A small flow rate of oxygen flowed through the outer annulus to stabilize the flame. The flame was shielded from room air by a curtain flow of nitrogen metered using a Fisher and Porter variable area flow meter (Andrews Glass, Vineland, NJ) and delivered around the circumference of the burner chamber. Filtered, dried air was added to the flow downstream of the flame, and all burner effluent passed through a heated 3-way catalyst to remove NOx and CO. UFPM were diluted with clean HEPA and CBR (chemical/biological/radiological) FA before entering the inhalation exposure chamber.
Chamber CO levels were monitored using a Teledyne-API Model 300E CO analyzer (San Diego, CA) and was calibrated with an NIST traceable span gas of 202.4 ppm CO diluted in ultrapure air to 10 ppm CO for calibration (Scott-Marrin Inc., Riverside, CA). Chamber NOx levels were monitored (Dasibi 2108 Chemiluminescence NOx Analyzer, Glendale, CA). UFPM was collected directly from the exposure chamber for analysis though ports in the chamber wall. Particle number concentration was determined using a condensation particle counter (CPC, TSI model 3775, Shoreview, MN). Particle size distribution was determined using a scanning mobility particle sizer (SMPS) (model 3080 electrostatic classifier with model 3081 differential mobility analyzer) and a model 3020 CPC (TSI).
UFPM mass concentration was determined by collecting particles from the chamber on glass fiber filters (Pallflex Emfab 47-mm filters, Ann Arbor, MI) placed in a filter housing (BGI, Waltham, MA). The sampling flow rate was set at 20 l/min air flow rate driven by a vacuum source downstream of the flow. Collection was performed for the duration of the exposure. Total particulate mass was determined gravimetrically (Sartorius AG MC5 microbalance, Goettingen, Germany). Particle samples were collected on 47-mm glass fiber filters (Pallflex Tissuequartz, Ann Arbor, MI) for elemental carbon to organic carbon ratio (EC/OC) analysis as described above. The EC/OC ratio was determined using a method described previously (Herner et al., 2005).
Particle chemical characterization
Particle and vapor phase PAH speciation was performed by the Organic Analytical Laboratory at the Desert Research Institute (DRI, Reno, NV). Briefly, UFPM + O3 samples were collected on Pallflex Tissuequartz 47 mm filters, and vapor phase organic compounds were collected on XAD resin supplied by DRI. Samples were analyzed for 115 PAH and nitro, oxo-PAH compounds. Filters and XAD-4 resin were spiked with several deuterated PAH internal standards and extracted with dichloromethane followed by acetone using an accelerated solvent extractor (ASE, DIONEX, ASE-300, Salt Lake City, UT). After extraction, samples were pre-concentrated with a rotary evaporator, filtered, exchanged with toluene, and concentrated to 0.1 ml volumes under ultra-high purity nitrogen stream. The extracts were then analyzed using a Varian CP-3800 GC equipped with a CP-8400 auto-sampler and interfaced to a Varian 4000 Ion Trap Mass Spectrometer (Varian, Inc. Walnut Creek, CA). The limit of quantification (LOQ) values range between 0.025 and 0.082 ng/μl.
Particle dosimetry
The Multiple Path Particle Deposition (MPPD v3.04; Applied Research Associates, Albuquerque NM) was used to predict UFPM or traffic-related PM0.1 and ambient PM2.5 particle deposition in UFPM and UFPM + O3-exposed rats or a human, respectively (Anjilvel and Asgharian, 1995). Dosimetry was calculated for each rat exposed to either experimental particle-containing atmosphere (UFPM and UFPM + O3, particle number and mass concentration = 1.6 × 10⁶ and 253.1 μg/m3) and for simulated human exposures to either a high ambient concentration of traffic-related PM0.1 (mean = 64.6 μg/m3) measured previously in Los Angeles, CA (Zhu et al., 2002) or to the current National Ambient Air Quality Standard (NAAQS) for the 24 h average of PM2.5 (35.0 μg/m3) (EPA, 2012). Breathing pattern data collected from FA-exposed Wistar rats or SH rats and human subjects were used to calculate rat-specific breathing parameter values applied to MPPD model including forced respiratory capacity and tidal volume (Table 6) (Schelegle et al., 2001; Schelegle et al., 2009). Rats were assumed to be at rest for calculations; the typical state during experimental exposures. Human predictions were calculated for two activity states: resting and light activity. Considerations for model input parameters are listed in Table 6.
MPPD Model Parameter Settings and Predictions
| Particle Properties | ||||||
|---|---|---|---|---|---|---|
| Parameter | UFPM/UFPM + O3 | Traffic-Related PM0.1 | Ambient PM2.5 | |||
| Density (g/cm3) | 0.7 | 1.0 | 1.0 | |||
| Distribution | Monodisperse | Polydisperse | Polydisperse | |||
| Diameter (nm) | 74.1 | 6.0 ≤ × ≤ 220.0 | 10.0 ≤ × ≤ 2500.0 | |||
| Diameter value | NA | MMD | MMD | |||
| Mass (μg/m3) | 253.1 | 64.6 | 35.0 | |||
| Particle number (particles/cm3) | 1.6 × 10⁶ | NA | NA | |||
| Airway Morphometry Settings | ||||||
| Parameter | NW | SH | Human (rest) | Human (light activity) | ||
| Model | Symmetric Sprague Dawley | Human stochastic lung—60th percentile | ||||
| Weight (g) | 588.0 ± 15.3 | 333.7 ± 8.9 | NA | NA | ||
| FRC (mL) | 7.1 ± 0.8 | 4.4 ± 0.3 | 3300.0 | 3300.0 | ||
| Breathing frequency | 99.3 | 99.3 | 15.0 | 32.6 | ||
| Tidal volume (mL) | 1.3 ± 0.1 | 0.8 ± 0.0 | 800.0 | 1224.0 | ||
| Predictions per Unit Area of the Terminal Bronchiolar Region | ||||||
Traffic-Related PM0.1 | Ambient PM2.5 | |||||
| Result | NW | SH | Human (Rest) | Human (Light Activity) | Human (Rest) | Human (Light Activity) |
| Deposited mass rate (μg/min/cm2) | 1.1 × 10⁻⁵ ± 0.9 × 10⁻⁶ | 1.2 × 10⁻⁶ ± 1.2 × 10⁻⁷ | 1.1 × 10⁻⁵ | 3.2 × 10⁻⁵ | 3.0 × 10⁻⁶ | 1.7 × 10⁻⁵ |
| Total deposited mass (μg/cm2) | 3.8 × 10⁻³ ± 0.9 × 10⁻⁴ | 4.3 × 10⁻⁴ ± 1.2 × 10⁻⁵ | 4.0 × 10⁻³ | 1.2 × 10⁻² | 4.3 × 10⁻³ | 2.4 × 10⁻² |
| Deposited particles rate (particles/min/cm2) | 6.5 × 10⁴ ± 0.9 × 10³ | 7.4 × 10³ ± 1.2 × 10² | NA | NA | NA | NA |
| Total deposited particles (particles/cm2) | 2.3 × 10⁷ ± 0.9 × 10⁶ | 2.7 × 10⁶ ± 1.2 × 10⁵ | NA | NA | NA | NA |
Note: Model default settings were accepted for parameters not listed. MPPD model predictions were calculated individually for each NW and SH rats exposed to either UFPM and UFPM + O3 as well as simulated human exposures to both a high concentration of traffic-related PM0.1 and the current NAAQS for ambient PM2.5 for 24 h. Predictions for UFPM and UFPM + O3-exposed NW and SH rats were calculated with rat-specific breathing parameters estimated by weight; settings are shown as the means ± SEM. Two states of physical activity, at rest and with light activity, were used to predict deposition in the human. Total deposited mass estimates were calculated for either a 6 h (UFPM/UFPM + O3 and traffic-related PM0.1) or 24 h (ambient PM2.5) exposure period. Abbreviations: MPPD, multiple-path particle dosimetry; NW, normal Wistar rat; SH, spontaneously hypertensive rat; UFPM, ultrafine particulate matter; UFPM + O3, ultrafine particulate matter combined with ozone; PM0.1, ultrafine particulate matter size fraction; PM2.5, fine particulate matter size fraction; NAAQS, national ambient air quality standard; MMD, multimodal distribution; NA, not applicable; FRC, functional respiratory capacity. Results from UFPM and UFPM + O3-exposed rats were combined within strain, values are shown as means ± SEM.
Pulmonary histopathology
Rats were placed under deep isoflourane anesthesia immediately following the recovery period of the exposure protocol. Telemeters were removed from the abdomen and a blood sample was obtained from the right ventricle using a small gauge needle. Rats were then euthanized via exsanguination and the hearts and lungs removed and fixed with neutral buffered 10% formalin. Lungs were fixed by intratracheal instillation at a controlled pressure of 20 cm H2O for 1 h. Lungs were then tied off and allowed to fix overnight (∼12 h) at 4°C. Three lung sections from each rat were paraffin embedded, sectioned, and stained with hematoxylin and eosin. Proximal and distal sections of the left lobe were selected in a plane perpendicular to the first axial airway. The third section was a transverse section of the accessory lobe that also included its main axial airway. Sections were evaluated by a board certified veterinary pathologist without knowledge of exposure group assignment. Lesions in large airways, terminal bronchiolar/alveolar duct regions, alveolar parenchyma, and vasculature were assigned a severity score from 0 to 5 based on the extent and density of cellular debris and inflammatory cell responses in each section examined (Shackelford et al., 2002). Numeric scores correlated with normal (0), minimal (1), mild (2), moderate (3), severe (4), and maximal (5) responses. Lesion scores were separately assigned for macrophage infiltrate, edema, polymorphonuclear (PMN) leukocyte infiltrate, terminal bronchial (TB) epithelial necrosis, exudate, large airway (LA) ciliary cell loss/necrosis, intravenous fibrin/neutrophil aggregates (IVFNA), and intravenous thrombus.
Data and statistical analysis
The total number (N) of rats was 8–12 per group. All data are expressed as mean ± SEM. Data were assessed for significance using a nonparametric Kruskal-Wallis test with Dunn-Bonferroni post hoc comparisons to identify significant differences between exposure groups distinguished by strain. Additionally, the nonparametric Mann-Whitney test was used to detect significant differences between strains at baseline and in response to each exposure. Data were analyzed using SPSS Statistics v. 24 (IBM, Armonk, NY). p-Values of ≤ 0.05 were considered statistically significant. All electrocardiography, cardiac histopathology, and hematologic endpoints are to be analyzed and reported elsewhere (submitted).
RESULTS
Characterization of UFPM Containing Atmospheres
Exposure atmosphere data were collected every 30 m during exposure period of experimental protocol. Particle size and concentration data from UFPM and UFPM + O3 exposures in NW and SH rats are summarized in Table 2. Overall, particles had a mean geometric mobility diameter of 74.14 nm ± 1.41, and particle concentration, measured by particle number and mass, were 1.57 × 10⁶ particles/cm3 ± 4.7 and 253.1 μg/m3 ± 2.8, respectively. Exposure chamber CO and CO2 levels were within 0.3 ppm of FA chamber levels, with quantification below 0.2 ppm limited by instrument accuracy. Particles were high in organic carbon and had an EC/OC ratio of 0.58.
Particle Characteristics of UFPM and UFPM + O3 Experimental Exposures
| NW | SH | |||
|---|---|---|---|---|
| Parameter | UFPM | UFPM + O3 | UFPM | UFPM + O3 |
| Size (nm) | 74.1 ± 0.2 | 74.0 ± 0.1 | 74.2 ± 0.3 | 74.1 ± 0.0 |
| Mass (μg/m3) | 254.6 ± 1.0 | 253.6 ± 0.5 | 250.9 ± 0.7 | 254.3 ± 0.9 |
| Particle number (particles/m3) | 1.59 × 10⁶ ± 0.8 | 1.55 × 10⁶ ± 1.0 | 1.51 × 10⁶ ± 0.9 | 1.58 × 10⁶ ± 1.1 |
Note: A pre-mixed-flame particle generating system was used to create experimental ultrafine particulate matter (UFPM) employed in UFPM and UFPM + O3 exposure atmospheres. Abbreviations: NW, normal Wistar rat; SH, spontaneously hypertensive rat; UFPM, ultrafine particulate matter; UFPM + O3, ultrafine particulate matter combined with ozone. A 2-way analysis of variance with Bonferroni post hoc comparisons did not detect any significant differences (p ≥.719) in particle size or concentration (particle number or mass) for UFPM and UFPM + O3 atmospheres between strains or exposure group. Values are shown as the means ± SEM.
UFPM and UFPM + O3 atmospheres contained both particles and gases. Vapor and particulate phase PAH content for the UFPM atmosphere was previously characterized by the same laboratory and methods used in the current study, reported by Chan et al. (2011). For this study, abundant vapor and particulate phase PAHs were identified for the UFPM + O3 atmosphere (Tables 3 and 4). In general, methyl biphenyls and a tricyclic aromatic ketone dominated the vapor and particulate phases, respectively. Total UFPM + O3 PAH concentrations were 205.78 ng/m3 (vapor) and 89.72 ng/m3 (particulate). Pyrene, a U.S. EPA “Priority Pollutant,” was abundant in the vapor phase (∼ 14.75%) (EPA, 1974).
Most Abundant PAHs in Vapor Phase of UFPM and UFPM + O3
| UFPM | UFPM + O3 | ||
|---|---|---|---|
| Compound | Abundance (ng/m3) | Compound | Abundance (ng/m3) |
| 2-methylbiphenyl | 114.68 | 3-methylbiphenyl | 73.12 |
| 3-methylbiphenyl | 64.30 | 2-methylbiphenyl | 35.87 |
| 2-methylnaphthalene | 35.86 | Pyrene | 30.35 |
| 1, 3 + 1, 6 + 1, 7dimethylnaphthalene | 23.78 | 4-methylbiphenyl | 20.70 |
| Naphthalene | 18.73 | 1 + 2ethylnaphthalene | 19.31 |
| 1-methylnaphthalene | 17.51 | ||
| 2, 6 + 2, 7dimethylnaphthalene | 14.22 | ||
| 1 + 2ethylnaphthalene | 12.61 | ||
| Fluorene | 11.54 | ||
Note: Compounds identified in sample below detection limits are not listed.
Most Abundant PAHs in Particulate Phase of UFPM and UFPM + O3
| UFPM | UFPM + O3 | ||
|---|---|---|---|
| Compound | Abundance (ng/m3) | Compound | Abundance (ng/m3) |
| Naphthalene | 15.37 | Anthrone | 19.32 |
| 2-methylnaphthalene | 13.84 | Coronene | 17.94 |
| Benzo[b]chrysene | 16.56 | ||
| 7, 12-dimethylbenz[a]anthracene | 13.80 | ||
| UFPM | UFPM + O3 | ||
|---|---|---|---|
| Compound | Abundance (ng/m3) | Compound | Abundance (ng/m3) |
| Naphthalene | 15.37 | Anthrone | 19.32 |
| 2-methylnaphthalene | 13.84 | Coronene | 17.94 |
| Benzo[b]chrysene | 16.56 | ||
| 7, 12-dimethylbenz[a]anthracene | 13.80 | ||
Note: Compounds identified in sample below detection limits are not listed.
Strain-Related Differences on Day of Experimental Exposure
Baseline characteristics are summarized in Table 1. At time of experimental exposure, there were no significant differences in age (p = 0.109) or time (days) post-telemeter implantation (p = 0.401) between strains; however, SH rats weighed significantly less (p = 0.000) than NW rats at the time of exposure. There were no significant differences in age (p for NW = 0.869; SH = 0.950), weight (p for NW = 0.801, SH = 0.870), or in time (days) post-telemeter implantation (p for NW = 0.129, SH = 0.181) between exposure groups.
Age-Related Lung Lesions
Terminal bronchiolar regions of FA-exposed NW and SH rats were similar (Figs. 1A and 1B;Table 5) and commonly displayed cuboidal bronchiolar epithelium and alveolar ducts lined by thin alveolar walls overlain by squamous type I pneumocytes, consistent with examples from studies using juvenile rats (Elsayed et al., 1982). Some age-related lesions were evident in both NW and SH rats; the most frequent of which were focal, often subpleural, accumulations of large foamy macrophages. Small foreign body granulomas also were occasionally observed. Large airway epithelia of FA-exposed rats were intact; epithelial thickness, depth of ciliary layer, and concentration of cells were consistent between strains (Figs. 2A and 2B).
Histopathologic Measures of the Lung in Normal and Spontaneously Hypertensive Rats
| NW | SH | |||||||
|---|---|---|---|---|---|---|---|---|
| Parameter | FA | UFPM | O3 | UFPM + O3 | FA | UFPM | O3 | UFPM + O3 |
| Macrophage infiltrate | 0.5 ± 0.2 | 0.8 ± 0.2 | 1.3 ± 0.3 | 2.8 ± 0.2a,b,c | 0.2 ± 0.1 | 0.6 ± 0.3 | 0.8 ± 0.2 | 2.6 ± 0.2a,b,c |
| Edema | 0.4 ± 0.2 | 0.3 ± 0.1 | 0.9 ± 0.3 | 3.7 ± 0.1a,b,c | 0.2 ± 0.1 | 0.0 | 2.3 ± 0.4a,b,d | 3.5 ± 0.3a,b |
| PMN infiltrate | 0.6 ± 0.2 | 0.1 ± 0.1 | 1.0 ± 0.4 | 3.8 ± 0.1a,b,c | 0.3 ± 0.2 | 0.4 ± 0.3 | 2.4 ± 0.3a,d | 4.0 ± 0.2a,b |
| TB epithelial necrosis | 0.0 | 0.0 | 0.4 ± 0.3 | 3.8 ± 0.1a,b,c | 0.1 ± 0.1 | 0.0 | 2.2 ± 0.3a,b,d | 3.7 ± 0.2a,b |
| Exudate | 0.0 | 0.0 | 0.3 ± 0.2 | 3.7 ± 0.2a,b,c | 0.0 | 0.1 ± 0.1 | 1.2 ± 0.3d | 3.5 ± 0.3a,b |
| LA cilia cell loss/necrosis | 0.8 ± 0.2 | 0.0 | 0.2 ± 0.1 | 3.8 ± 0.2a,b.c | 0.1 ± 0.1 | 0.0 | 1.3 ± 0.3d | 3.1 ± 0.3a,b |
| IVFNA | 0.0 | 0.8 ± 0.4 | 0.9 ± 0.5 | 0.8 ± 0.2 | 0.6 ± 0.2 | 1.9 ± 0.4a | 1.9 ± 0.5 | 1.3 ± 0.2 |
| Intravenous thrombus | 0.0 | 1.8 ± 0.4 | 0.8 ± 0.4 | 1.3 ± 0.4 | 0.4 ± 0.2 | 1.0 ± 0.4 | 0.4 ± 0.3 | 0.9 ± 0.3 |
Note: Standard, paraffin-embedded, and histopathologic sections of lung tissue were evaluated by a board-certified veterinary pathologist for lesions in the large airways, terminal bronchiolar/alveolar duct regions, alveolar parenchyma and vasculature and assigned a severity score (0–5). Abbreviations: NW, normal Wistar rat; SH, spontaneously hypertensive rat; FA, filtered air; UFPM, ultrafine particulate matter; O3, ozone; UFPM + O3, ultrafine particulate matter combined with ozone; PMN, polymorphonuclear leukocyte; TB, terminal bronchiole; LA, large airway; IVFNA, intravenous fibrin-neutrophil aggregates. The Kruskal-Wallis test was used to calculate the difference between exposure groups by strain and significant p-values (p < 0.05) from Dunn-Bonferroni post hoc test are shown in the table. Values are shown as the means ± SEM within strain-related exposure groups.
Significant compared to FA within same strain exposure groups.
Significant compared to UFPM within same strain exposure groups.
Significant compared to O3 within same strain exposure groups.
Significant difference between strains within exposure group.
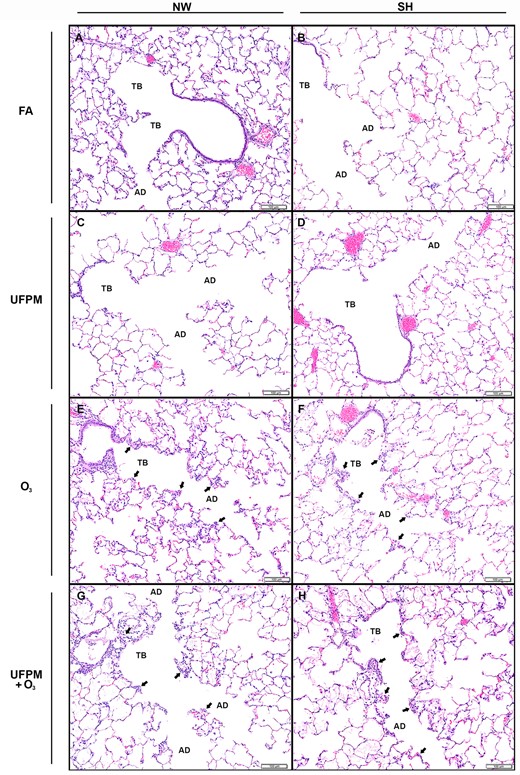
Terminal bronchioles and alveolar ducts from NW and SH rats by experimental exposure. Representative histological sections of (A) FA-exposed NW rat and (B) SH rat and (C) UFPM-exposed NW rat (D) and SH rat. (E) O3-exposed NW rat and (F) SH rat. (G) UFPM + O3-exposed NW rat and (H) SH rat. Sections were stained with hematoxylin and eosin, bar = 100 μm. Note: Arrowheads denote areas of injury and inflammation. Abbreviations: NW, normal Wistar rat; SH, spontaneously hypertensive rat; FA, filtered air; UFPM, ultrafine particulate matter; O3, ozone; UFPM + O3, ultrafine particulate matter combined with ozone; TB, terminal bronchiole; AV, alveolar duct.
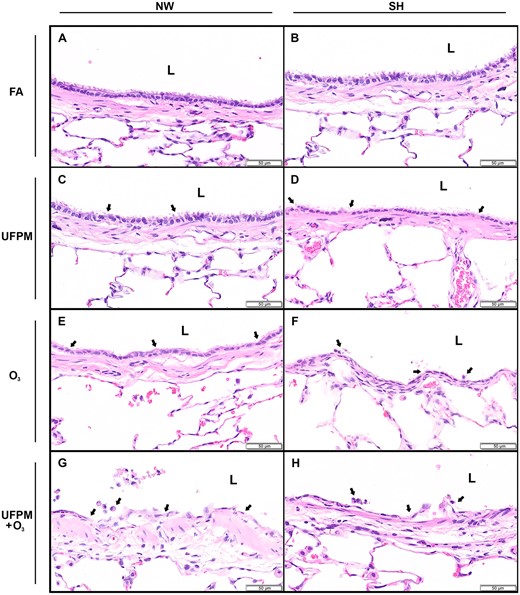
Bronchial epithelium of large intrapulmonary airways from NW and SH rats by experimental exposure. Representative histological sections of (A) FA-exposed NW rat and (B) SH rat and (C) UFPM-exposed NW rat and (D) SH rat. (E) O3-exposed NW rat and (F) SH rat. (G) UFPM + O3-exposed NW rat and (H) SH rat. Sections were stained with hematoxylin and eosin, bar = 50 μm. Arrowheads denote areas of injury and inflammation. Abbreviations: NW, normal Wistar rat; SH, spontaneously hypertensive rat; FA, filtered air; UFPM, ultrafine particulate matter; O3, ozone; UFPM + O3, ultrafine particulate matter combined with ozone; L, lumen.
UFPM-Induced Airway Lesions
Rats exposed to UFPM had only minimal lesions throughout the terminal bronchiolar (Figs. 1C and 1D;Table 5), similar with age-related lesions observed in FA-exposed NW and SH rats. There were no differences observed in the large airways of UFPM-exposed rats from FA-exposed rats (Figs. 2C and 2D).
O3-Induced Airway Lesions
Rats exposed to O3 had lesions predominately in the terminal bronchioles and alveolar ducts, however, injury extended into the large airways of SH rats (Figure 3B;Table 5). Terminal bronchioles of O3-exposed NW rats were hyperplastic and walls were thickened by edema and cellular infiltrates (Figure 1E). Alveolar duct walls were more prominent due to interstitial edema and modest cellularity. Some lesions presented alveoli containing proteinaceous exudate. The large airways of O3-exposed NW rats did not differ from FA or UFPM-exposed NW rats (Figure 2E).
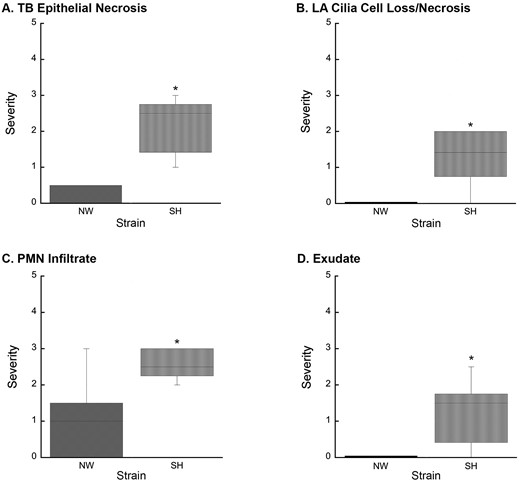
Increased lung injury in SH rats resulting from O3 exposure. A, O3 exposure resulted in increased TB epithelial necrosis (p = .002) in SH rats compared to NW rats. B, O3 exposure-induced significant (p = .014) LA cilia cell loss/necrosis in SH rats, which was absent in NW rats. C, PMN leukocyte infiltration of the terminal bronchiole epithelium was significantly increased (p = .015) in O3-exposed SH rats compared to O3-exposed NW rats. D, O3 exposure resulted in increased exudate (p = .008) in SH rats compared to NW rats. Abbreviations: NW, normal Wistar rat; SH, spontaneously hypertensive rat; O3, ozone; TB, terminal bronchiole; LA, large airway; PMN, polymorphonuclear leukocyte; the Mann-Whitney test was used to calculate the difference between strains in response to each exposure. Values are shown as the means ± SEM by strain. *p < .05.
In SH rats, the terminal bronchioles had intraluminal proteinaceous and cellular exudate, attenuated epithelium, mural edema, and inflammatory cell infiltrate (Figure 1F). Alveolar ducts were thickened by interstitial edema and lumens contained proteinaceous exudate. The large airways of O3-exposed SH rats displayed attenuated epithelium, sloughed epithelial cells, and intramural PMN’s (Figure 2F).
Combined-Pollutant Exposure-Induced Airway Injury
Overall, the most severe and generalized lesions were present in rats exposed to UFPM + O3 (Figs. 1G, 1H and 2G, 2H;Table 5). Terminal bronchiolar epithelium was degenerate or necrotic with luminal debris admixed with neutrophils. Terminal bronchiolar walls were expanded by edema in the adventitial sheath and contained extravascular and transmigrating neutrophils. Pulmonary arterioles at the terminal bronchiolar junction also had edematous adventitia and prominent endothelium often overlain by marginated neutrophils. Alveoli along the alveolar duct contained moderate number of neutrophils and occasional macrophages. In more severe lesions the alveolar duct and adjacent parenchymal alveoli contained wispy proteinaceous exudate admixed with occasional sloughed squamous epithelial cells. Some capillaries in alveolar ducts were distended by microthombi. Luminal exudates of PMNs and necrotic epithelial cell debris were more prominent in SH as compared with NW rats.
The bronchi of UFPM + O3-exposed rats of both strains had ciliary cell loss and necrosis of airway epithelium with accumulations of cellular debris lining the airway surface (Figs. 2G and 2H). Some airways were lined by attenuated squamous epithelial cells and others had evident transmigrating neutrophils.
Impacts of Age and Surgical Procedures
To determine the impact of time (days) between telemeter implantation and exposure as well as age (weeks) at exposure on pathological changes in the lung, a 2-way analysis of variance with Bonferroni post hoc comparisons was used to identify significant differences between strains and exposure groups with time between telemeter implantation and exposure as well as age at exposure as covariate factors. There were no significant effects on pathological changes in the lung for either age at exposure (46.5 ± 0.6), time between telemeter implantation and exposure (2.7 ± 0.1) or between strain-related exposure groups.
Particle Dosimetry Predictions for Experimental and Traffic-Related PM0.1/Ambient PM2.5 Exposures
MPPD model estimates for UFPM and UFPM + O3-exposed NW and SH rats, and the simulated human exposures to traffic-related PM0.1 or the NAAQS for PM2.5 are summarized in Table 6. Total mass deposited was estimated for a 6 h exposure to experimental UFPM and traffic-related PM0.1 or a 24 h exposure to ambient PM2.5. Dose levels were compared using a dose metric based on rate and incremental deposition per unit area of the terminal bronchiolar region. Estimates for UFPM and UFPM + O3-exposed NW and SH rats were calculated using rat-specific breathing parameters for particle number and mass concentration. Predictions for deposition rate and total particle number/mass in SH rats were ∼11.7% of the totals predicted for NW rats, significantly different (p = 0.000) between strains.
Dosimetric predictions for the simulated human exposures were calculated per unit area of the terminal bronchiolar region. Deposited mass rate estimate for a resting human exposed to traffic-related PM0.1 was ∼34.3% of a human with light activity, and further, total deposited mass was ∼65.7% greater with light activity than at rest. Deposited mass rates varied dramatically between traffic-related PM0.1 and ambient PM2.5, however, total mass deposited during a 6 h exposure to a high concentration of traffic-related PM0.1 was similar with the 24 h exposure to ambient PM2.5 in a human at rest. With light activity, however, total mass of traffic-related PM0.1 deposited was ∼50% less than ambient PM2.5. Notably, total mass deposition was comparable between the simulated human exposure to traffic-related PM0.1 and UFPM/UFPM + O3 NW rats (∼ 95% of human at rest; ∼ 31.1% of the human with light activity). However, predictions for the SH rats were ∼10.7% or ∼3.5% of the total mass predicted for a human at rest or with light activity, respectively.
DISCUSSION
Traffic-related air pollution is associated with increased cardiopulmonary morbidities and mortalities in mature adults with CVD. The results of the present study definitively establish that O3 increases the biologic potency of UFPM; acute exposure to which resulted in severe airway injury and inflammation. Injuries precipitated from UFPM or O3 alone were negligible by comparison. Reactions between O3 and UFPM, specifically surface-associated PAHs, may be responsible for the increased biologic potency of UFPM + O3. We also demonstrated that CVD increased physiologic vulnerability to air pollution exposure, and thus, played a critical role in susceptibility.
We employed a high concentration of particles in our UFPM atmospheres, much higher than typical ambient levels of PM0.1. For toxicologic assessments, however, it is more critical to evaluate dose-equivalent responses rather than replicate atmospheric pollutant concentrations (Oberdörster et al., 2005). Because particle deposition is dependent on anatomic and physiologic characteristics, dose levels in a rodent are substantially lower than a human when exposed to similar pollutant concentrations (Brown et al., 2005). Thus, significantly higher concentrations are necessary to achieve human-equivalent dose levels in a rodent model of exposure. To demonstrate the relevance of the UFPM concentration used in the current study, we performed a dosimetric comparison between UFPM, a high ambient concentration of traffic-related PM0.1, and the current NAAQS for PM2.5. Particle dosimetry predictions indicated that the experimental concentration of UFPM was relevant to that of a high ambient concentration of traffic-related PM0.1 and an acute 24 h exposure to PM2.5 at the NAAQS for a human at rest and with light activity.
Dosimetric modeling indicate that our experimental pollutant concentrations were environmentally relevant to human exposures. Importantly, PM0.1 adverse effects are more strongly correlated with particle number concentrations opposed to mass (Delfino et al., 2005; Peters et al., 1997). Although the PM0.1 concentration used for the simulated human exposure dosimetry predictions is not typical, it is comparable with concentrations measured previously. Kumar et al. reported an overall PM0.1 average of 0.44 ± 0.51 × 10⁵ particles/cm3 from 42 different cities worldwide; the highest levels were measured in Beijing, China (1.2 × 10⁵ particles/cm3) and Delhi, India (3.08 × 10⁵ particles/cm3) (Kumar et al., 2014). These concentrations are similar to the high ambient concentration of traffic-related PM0.1 measured in Los Angeles, CA used for the dosimetric comparison (Zhu et al., 2002). Because of the well-defined physical characteristics and homogeneous nature of the UFPM, we estimated dose level in UFPM and UFPM + O3-exposed NW and SH rats for particle number as well as mass deposition. However, due to the physical variability and lack of correlation between particle number and mass concentration for traffic-related PM0.1 and ambient PM2.5, we could not compare dose level using particle number (Sardar et al., 2004). Despite the similarity in the doses predicted for NW rats and human, estimates for UFPM and UFPM + O3-exposed SH rats were ∼11.7% of the dose predicted for NW rats. This is particularly interesting considering the degree of airway injury and inflammation displayed by UFPM + O3-exposed SH rats compared to UFPM + O3-exposed NW rats. The discrepancy in the predicted dose levels for NW and SH rats indicate that SH rats may be increasingly vulnerable to combined-pollutant exposure.
We identified airway generational differences in the extent of lung injury in rats exposed to UFPM + O3 compared to single-pollutant and FA exposures. Both the bronchi and central acinar region demonstrated injury, typical with repeated long-term inhalation exposures but not acute exposure (Harkema et al., 2013). Furthermore, injuries precipitated from the combined-pollutant atmosphere were more severe than the single-pollutant atmospheres. Our data indicates that the combination of UFPM and O3 increased the extent of lung injury beyond an “additive” effect of the single-pollutant exposures combined, suggesting that biologic potency was enhanced. Although similar acute lung responses to combined pollutants were reported previously (Bouthillier et al., 1998; Elder et al., 2000; Madden et al., 2000), the responses reported here are the most robust to date.
The presence of O3 dramatically altered the PAH composition of UFPM in the UFPM + O3 experimental atmosphere. Previously, Chan et al. reported that biphenyls and naphthalene derivatives dominated both the vapor and particulate phases of the UFPM atmosphere (Chan et al., 2011). Although biphenyls were abundant in vapor-phase UFPM + O3, only two chemically stable poly-substituted naphthalene derivatives were identified. Furthermore, the particulate-phase UFPM + O3 chemical composition was completely distinct from UFPM alone, and devoid of any PAHs with demonstrated carcinogenic capacity. For example, quinoline, a biologically relevant PAH-derivative commonly formed in vehicular combustion engines (Jakober et al., 2007), was identified in vapor- and particulate-phases of UFPM, but was not present in either phase of UFPM + O3. Due to the reproducible nature of the particle generation system, it is likely that the addition of O3 altered UFPM chemical composition. Previous studies indicated that atmospheric reactions of O3 with surface-adsorbed PAHs occur in a somewhat indiscriminate manner and promotes PAH degradation (Pitts et al., 1980; Van Cauwenberghe and Van Vaeck, 1983; Van Vaeck and Van Cauwenberghe, 1984). Furthermore, PAH-surface interactions may influence half-life as well as reactivity to O3 oxidation and resulting products (Chu et al., 2010). Therefore, it is not surprising that the PAH composition of the UFPM + O3 atmosphere was distinct from the UFPM atmosphere.
The experimental UFPM was produced by a premixed flame particle generating system, and contained vapor- and particulate-phase PAHs. The premixed flame particle generating system is ideal for toxicity testing of combustion-generated PM0.1 because it is reproducible, allows for compositional modification, and eliminates the composition and size-fraction variability associated with field samples. Thus, the biological effects resulting from UFPM + O3 exposure directly resulted from O3 and PAH interactions. Due to its oxidative capacity, O3 reacts quickly with PAHs. This reaction is accelerated when the compounds are deposited on a solid surface (Pitts et al., 1986). In diesel exhaust PM, the half-lives for PAH degradation range from ∼15 to 120 m (Van Vaeck and Van Cauwenberghe, 1984). The rate of PAH conversion by O3 is dependent on the electrophilic reactivity of the compound. For example, quinones are highly reactive to electrophilic reactions, and thus, particularly susceptible to ozonolysis (Bernatek, 1958). Importantly, PAH ozonolysis yields a complex mixture of oxidized products including hydroxyl radicals, aldehydes, carboxylic acids, and hydrogen peroxides (Bernatek, 1958). The production of these compounds would directly increase the particle’s oxidant capacity, and conceivably, its biologic potency. Although we were unable to test the oxidant capacity of UFPM + O3 specifically, the compositional data indicates that PAH degradation occurred. Taken together, this data suggests that the increased toxicity of UFPM + O3 may have resulted from PAH degradation by O3 at the particle surface.
We chose the SH animal model of CVD because of their well-documented application as a model of CVD and use in previous PM studies (Kodavanti et al., 2000). Mature adult (55-week-old) male SH rats demonstrate unprovoked atrial tachyarrhythmias and decreased heart rate variability, which are common manifestations of CVD not displayed by young (14-week-old) male SH rats (Scridon et al., 2012). This finding demonstrates that age is an essential component for disease development and progression in the SH rat, analogous with CVD progression in human populations. Thus, mature adult SH rats were used in this study to explore the effects of CVD on lung responses to combined-pollutant exposure.
Notably, O3-exposed SH rats had significant large airway epithelial injuries compared with O3-exposed NW rats, whose injuries were limited to terminal bronchioles. Furthermore, O3-induced injury in the terminal bronchioles were significantly more severe in SH rats compared with O3-exposed NW rats (Figs. 3A, 3C, and 3D). Similar patterns of O3-induced injury were reported previously, but not in SH rats (Schelegle et al., 2003). Importantly, NW rats did not display significant airway injury from exposure to either UFPM or O3 but were significantly affected by UFPM + O3. These results indicate that SH rats are increasingly sensitive to oxidant exposure. Comparable oxidant sensitivity was demonstrated in male SH rats chronically exposed to tobacco smoke (Shen et al., 2016). Furthermore, treatment of male SH rats with a catalytic antioxidant prior to tobacco smoke inhibited exposure-induced lung injury and inflammation (Smith et al., 2002). This suggests that susceptibility to oxidant injury may be due to antioxidant deficiencies in SH rats. Ascorbic acid, and other low-molecular weight antioxidants (e.g., uric acid and glutathione) reduce the impact of oxidants, and are, therefore, critical determinants of oxidant susceptibility (Kermani et al., 2006). Yoshioka et al. (1985) found that SH rats had lower levels of ascorbic acid in lung, liver, and adrenal tissue, and decreased ascorbic acid synthesis in response to xenobiotic stimuli (Yoshioka et al., 1985). In another study, ascorbate levels in SH rats were unaffected by O3 exposure compared to FA controls (Hatch et al., 2015). Together, these results suggest that ascorbic acid metabolism is abnormal in SH rats. It is unclear whether this metabolic abnormality is related to CVD progression or a strain-related genetic deficiency, thus, further investigation of this apparent oxidant sensitivity in SH rats is warranted.
This study clearly demonstrates that combination of the combustion-derived UFPM and O3 increases the biologic potency of exposure, increasing the severity of lung injury in mature adult rats with and without CVD. Our data strongly suggests that O3 alters the chemical composition of UFPM by reacting with PAH constituents in a manner that increases particle toxicity. This work highlights the advantage and necessity of having a defined exposure atmosphere that can be replicated for additional studies on combined-pollutant exposure. In this study, we demonstrated that CVD may enhance sensitivity to oxidants, which are a critical component of the mechanistic actions underlying the adverse health effects attributed to air pollution. Collectively, understanding how CVD impacts airway responses exacerbated by combined-pollutant exposure will inform atmospherically relevant public health policy.
FUNDING
This work was supported by the California Air Resources Board (CARB) [Contract No. 13-311] “Combined exposure to PM and O3: Pulmonary C fiber and platelet activation in decreased HRV” and the National Institutes of Health [P51 RR00169]. Its contents are solely the responsibility of the authors and do not necessarily represent the official view of CARB or NIH.
ACKNOWLEDGMENTS
We are grateful to the following people for their skilled technical assistance during exposures, sample collection, and processing: Anthony Wexler, Christopher Wallace, and Nghi Nguyen. We acknowledge Dr. Laura Van Winkle for providing UFPM PAH compositional data and the Organic Analytical Laboratory at the DRI for vapor and particulate phase PAH speciation.
COMPETING FINANCIAL INTEREST DECLARATION
The authors declare no competing financial interests.
REFERENCES

Comments