


Abstract
Primary testicular cell coculture model has been used to evaluate testicular abnormalities during development, and was able to identify the testicular toxicity of phthalates. However, the primary testicular cell coculture model has disadvantages in employing animals for the isolation of testicular cells, and the complicated isolation procedure leads to inconsistent results. We developed an invitro testicular coculture model from rodent testicular cell lines, including spermatogonial cells, Sertoli cells, and Leydig cells with specified cell density and extracellular matrix (ECM) composition. Using comparative high-content analysis of F-actin cytoskeletal structure between the coculture and single cell culture models, we demonstrated a 3D structure of the coculture, which created an invivo-like niche, and maintained and supported germ cells within a 3D environment. We validated this model by discriminating between reproductive toxicants and nontoxicants among 32 compounds in comparison to the single cell culture models. Furthermore, we conducted a comparison between the invitro (IC50) and invivo reproductive toxicity testing (lowest observed adverse effect level on reproductive system). We found the invitro coculture model could classify the tested compounds into 4 clusters, and identify the most toxic reproductive substances, with high concordance, sensitivity, and specificity of 84%, 86.21%, and 100%, respectively. We observed a strong correlation of IC50 between the invitro coculture model and the invivo testing results. Our results suggest that this novel invitro coculture model may be useful for screening testicular toxicants and prioritize chemicals for further assessment in the future.
Reproductive and developmental disorders caused by exposure to environmental chemicals are a prominent health issue worldwide (Jenardhanan etal., 2016; Leung etal., 2016). Animal testing for evaluating potential reproductive toxicity is one of the most complicated, time-consuming, and expensive processes when examining complex endpoints. Testing under the current guidelines requires a large number of animals, ranging from 560 to 6000 animals per chemical or drug (OECD, 2016). The implementation of the new European Registration, Evaluation, Authorization and Restriction of Chemical (REACH) program requires toxicological information to be submitted for about 30 000 existing chemicals. Although REACH promotes limiting vertebrate animal testing as far as possible, the lack of suitable alternatives will probably increase the use of animals (Hareng etal., 2005; Hartung and Rovida, 2009; Hofstetter etal., 2013; Luijten etal., 2007; Parks Saldutti etal., 2013; Sauer, 2004; Scialli and Guikema, 2012). Moreover, every year, approximately 700 new chemicals are introduced into the market, which imposes a great burden on reproductive and developmental toxicity testing. The Interagency Coordinating Committee on the Validation of Alternative Methods (ICCVAM) developed recommendations for minimum procedural standards and testing methods for the validation of invitro estrogen receptor (ER) and androgen receptor (AR) binding and transcriptional activation assays (Casey, 2016; ICCVAM, 2012). So far, there are no validated alternative tests that would cover different aspects of the reproductive cycle. Thus, it has become increasingly important to develop an invitro test that can serve as an equally effective alternative to animal testing for reproductive toxicity. In 2007, the U.S. Environmental Protection Agency (EPA) launched a large-scale program, ToxCast, to investigate high-throughput, invitro assays to prioritize substances for further in-depth toxicological evaluation, identify mechanisms of action, and develop predictive models for invivo biological response (Houck etal., 2009). The focus of the ToxCast program was to generate an invitro bioactivity profile for each chemical, and correlate this profile with the toxicity data from invivo animal studies (Auerbach etal., 2016; Karmaus etal., 2016; Kavlock etal., 2012; Paul Friedman etal., 2016). There are more than 500 assays across 9 assay technology platforms, including cell-free high throughput screening assays and cell-based assays in multiple human and rodent primary and derived cell lines. Although a small number of assays were found to be associated with the identified reproductive toxicants, and showed a certain level of predictive power for reproductive toxicity (Leung etal., 2016; Martin etal., 2011; Reif etal., 2010), there is no invitro model in the ToxCast program designed specifically for detecting reproductive toxicity.
Currently, invitro reproductive screening models for testicular development and spermatogenesis are actively being developed (Hareng etal., 2005; Hofmann etal., 2005a; Luijten etal., 2007; Parks Saldutti etal., 2013; Yu etal., 2005, 2008, 2009). In vitro culture systems have been used to evaluate testicular changes during normal development (Bilinska, 1989; Chapin etal., 1988; Gray, 1986; Griswold, 1998; Hadley etal., 1985; Lejeune etal., 1998). Sertoli/gonocytes cocultures are used to examine cell-cell interactions, as well as effects of hormones and growth factors on spermatogonia survival and proliferation invitro (Mather etal., 1990; Orth and Jester, 1995). Human fetal testis xenografted into the renal subcapsular space was developed to study the effects of toxicants on human tissues (Spade etal., 2014a,b). Production of postmeiotic spermatids in explanted pieces of testis were observed in both mouse and rat models (Brannen etal., 2016; Sato etal., 2011). These advances provide evidence that Sertoli and Leydig cells, as well as peritubular myoid or endothelial cells, are all essential in supporting and maintaining spermatogenesis in the testis. Self-renewal and progeny production of spermatogonia are controlled by the neighboring differentiated cells and extracellular matrix (ECM), known as substrate invivo niches, while Sertoli cells are required for successful differentiation of germ cells invitro culture systems (Griswold, 1998). The ECM Matrigel-based primary testicular cell model was reported to form a testicular-like multilayered architecture that mimics invivo characteristics of seminiferous tubules (Harris etal., 2015; Wegner etal., 2013, 2014; Yu etal., 2005, 2008, 2009). As previously demonstrated, this model differentially responds to various phthalate exposures with changes in several cellular pathways, showing sensitive response to testicular toxicity (Harris etal., 2015; Yu etal., 2009). However, this invitro primary testicular cell coculture model has the disadvantage of employing animals for the isolation of testicular cells, and the complicated isolation procedure leads to inconsistent results (Wegner etal., 2013). Therefore, in this study, we developed an invitro testicular cell coculture model from rodent testicular cell lines using spermatogonial cells (C18-4), Sertoli cells (TM4), and Leydig cells (TM3). We tested this animal-free invitro testicular coculture model with 32 compounds and compared their cytotoxicities with any single cell culture of spermatogonia, Sertoli cell or Leydig cells, and further conducted a comparison between the invitro (IC50 of cell viability) and invivo reproductive toxicity testing (lowest observed adverse effect level [LOAEL] on the reproductive system). We observed that the invitro coculture model could classify the tested compounds into 4 clusters, and identified the most toxic reproductive substances, which had high concordance, sensitivity, and specificity values of 84%, 86.21%, and 100%, respectively. We observed a strong correlation of IC50 between this invitro testicular coculture model and the invivo testing results. We have demonstrated that this novel invitro coculture model may be useful in screening testicular toxicants in a wide concentration range, and will help prioritize chemicals for future assessment.
MATERIALS AND METHODS
Chemicals and reagents
Dulbecco’s modified Eagle’s medium (DMEM), antibiotics (penicillin and streptomycin), fetal bovine serum (FBS), 0.25% trypsin/EDTA, and ethanol were purchased from GE Healthcare Life Sciences (Logan, Utah). Nu-Serum culture supplement (Nu-serum) and ECM Matrigel were from BD BioScience (Redford, Massachusetts). Glacial acetic acid was obtained from Merck (Darmstadt, Germany).
Both recognized reproductive toxicants and nonreproductive toxic compounds were selected for testing, as listed in Table 1. We selected 32 compounds, and obtained their invivo toxicities by manually searching the literature and public sources, such as the LOAEL values provided in the ToxCast database (Chapin and Stedman, 2009; CIRM, 2008; Moorman etal., 2000). Most of compounds were purchased from Sigma-Aldrich (St Louis, Missouri), Fisher Scientific (Gaithersburg, MD), Chem Service (West Chester, Pennsylvania) and GFS Chemicals (Powell, Ohio), as indicated. Some compounds were graciously provided by the National Toxicology Program (NTP).
List of Compounds Tested
| Chemical Name | Abbreviation | CAS no. | Molecular Weight | Purity (%) | Application | Provider | In vivoa Reproductive Toxicity |
|---|---|---|---|---|---|---|---|
| Sodium arsenite | As | 7784-46-5 | 129.91 | 90 | Pesticides | GFS chemicals | + |
| Boric acid | BA | 10043-35-3 | 61.83 | 99.5 | Insecticide | Sigma | + |
| Benzyl butyl phthalate | BBP | 85-68-7 | 312.36 | 98 | Plasticizer | Sigma | + |
| Benzophenone-3,3′,4,4′-tetracarboxylic dianhydride | BEN | 2421-28-5 | 322.23 | 96 | Solvent | Sigma | + |
| 2,2-Bis(4-hydroxy-3-methylphenyl)propane | BPA | 80-05-7 | 256.34 | 99 | Plasticizer | Sigma | + |
| 4,4′-(Hexafluoroisopropylidene)diphenol | BPAF | 1478-61-1 | 336.23 | 97 | Fire-retd plasticizer | Sigma | NA |
| 4,4′-Sulfonyldiphenol | BPS | 80-09-1 | 250.27 | 98 | Flame retardant | Sigma | NA |
| Cadmium chloride | Cd | 10108-64-2 | 183.32 | 99.99 | Dye | Sigma | + |
| chlorpyrifos | CHL | 2921-88-2 | 350.59 | 97 | Pesticides | Chemservice | + |
| Cyclophosphamide | CYC | NA | 279.1 | 95 | Cancer | TCI | + |
| Dibutyl phthalate | DBP | 84-74-2 | 278.34 | 99 | Solvent | Sigma | + |
| Dioctyl phthalate | DEHP | 117-81-7 | 390.56 | 99.5 | Plasticizer | Sigma | + |
| Diethylphthalate | DEP | 84-66-2 | 222.24 | 99 | Plasticizer | Sigma | – |
| Diethylstilbestrol | DES | 56-53-1 | 268.35 | 99 | Nonsteroidal estrogen | Fisher | + |
| Diazinon | DIA | 333-41-5 | 304.35 | 99 | Pesticides | Chemservice | + |
| Dimethyl phthalate | DMP | 131-11-3 | 194.18 | 99 | Plasticizer | Sigma | – |
| Dioctyl terephthalate | DOTP | 6422-86-2 | 390.56 | 96 | Plasticizer | Sigma | – |
| Dipentyl phthalate | DPP | 131-18-0 | 306.4 | 99 | Plasticizer | Sigma | + |
| β-Estradiol | ES | 50-28-2 | 272.38 | 95 | Estrogen therapy | Sigma | + |
| Hexachlorophene | HEP | 70-30-4 | 406.9 | 99 | Skin cleanser | Fisher | + |
| Heptachlor | HEX | 76-44-8 | 373.32 | 95 | Pesticides | Fisher | + |
| Hydroxyurea | HU | 127-07-1 | 76.05 | 98 | Sickle cells | Sigma | + |
| 2-methoxyethanol | ME | 109-86-4 | 76.09 | 99.8 | Solvent | Sigma | + |
| Parathion | PARA | 56-38-2 | 291.26 | 99 | Pesticides | Chemservice | + |
| Saccharin Sodium | SAC | 128-44-9 | 205.17 | 99 | Sweetener | Sigma | – |
| 3,3′,5,5′-Tetrabromobisphenol A | TBBPA | 79-94-7 | 543.87 | 97 | Flame retardant. | Sigma | NA |
| Tri-(2-chloroethyl)phosphate | TCEP | 115-96-8 | 285.49 | 97 | Fire-retd plasticizer | Sigma | + |
| Tricresyl phosphate | TCP | 1330-78-5 | 368.36 | 90 | Plasticizer | Sigma | + |
| 2,4,4′-Trichloro-2′-methoxydiphenyl ether | TCS | 3380-34-5 | 303.57 | 95 | Bateria resistance | Sigma | + |
| Vinclozolin | VIN | 50471-44-8 | 286.11 | 99 | Pesticides | Fisher | + |
| Valproic acid sodium salt | VPA | 1069-66-5 | 166.19 | 98 | Anticonvulsant | Sigma | + |
| Zearalenone | ZEA | 17924-92-4 | 318.36 | 99 | Pesticides | Sigma | + |
In vivo toxicity of these compounds were based on ToxCast database as well as literature search. “+”, “−”, and “NA” indicates the confirmed animal reproductive toxicants, nonreproductive toxicants or no data available, respectively.
Cell culture and treatment
Mouse Leydig cells (TM3) and Sertoli cells (TM4) were purchased from ATCC. These cells were isolated from prepubertal mouse gonads (Mather, 1980; Mather and Phillips, 1984). TM3 cells specifically express AR and progesterone. TM4 cells specifically express follicle stimulating hormone, AR, and progesterone receptor (Mather, 1980; Mather and Phillips, 1984). The mouse spermatogonial cell line C18-4 was established from germ cells isolated from the testes of 6-day-old Balb/c mice. This cell line shows morphological features of type A spermatogonia, and expresses germ cell-specific genes such as GFRA1, Dazl, and Ret, and stem cell specific genes such as piwi12 and prame11. It proved to be an ideal cell model for studying the early phase of spermatogenesis, although the functional transplantations were not conducted to prove the stem cell nature (Hofmann etal., 2005a,b). The spermatogonial cells were maintained in DMEM medium composed of 5% FBS, and 100 U/ml streptomycin and penicillin in a 33 °C, 5% CO2 humidified environment in a sub-confluent condition with passaging every 3–4 days. Leydig cells and Sertoli cells were cultured in DME/F12 medium supplemented with 100 U/ml streptomycin and penicillin, 5% horse serum, and 2.5% FBS, and maintained at 37°C with 5% CO2. For both the single cell culture models and testicular coculture model, the cells were inoculated with 1.5 × 10⁴ per well in a 96-well plate, cultured overnight at 70%–80% confluence, and treated with various concentrations of the testing compounds. For the testicular cell coculture model, the cellular composition of fractions mimicked mouse testis around 5 days postnatal, and was 80%, 15%, and 5% for gonocyte, Sertoli cell, and Leydig cell, respectively. Spermatogonial cells, Sertoli cells, and Leydig cells were mixed in this defined proportion and seeded into a 96-well plate in a DMEM/high glucose medium at 33°C, supplemented with 5% Nu-serum. ECM Matrigel (Corning, New York) was added to each well for a final concentration of 100 μg/ml, and the plates were gently swirled to ensure dispersal of Matrigel after addition. Cells were cultured overnight and treated with various concentrations of testing compounds in the doses and time periods indicated.
Assessment of cell morphology
All cultures were viewed with an Olympus inverted microscope equipped with phase-contrast optics (Olympus, Tokyo, Japan) at intervals during the culture to assess their general appearance. Images were captured and digitized with a Nikon Camera. To further examine the morphology of the cultured cells, a multi-parametric high-content analysis (HCA) was applied to quantify the F-actin cytoskeleton, nuclear shape, and cell proliferation. The spermatogonial cells were identified using typical markers of mouse germ cell nuclear antigen 1 (GCNA1) (Developmental Studies Hybridoma Bank, http://dshb.biology.uiowa.edu, Iowa) (Enders and May, 1994). Leydig cells were identified using steroidogenic acute regulatory protein (StAR) (Clark etal., 1994) (kindly gifted by Dr Douglas M. Stocco, Texas Tech University). Sertoli cells were stained with SOX9 (Developmental Studies Hybridoma Bank). After culture for 48 and 72 h, cells were washed with phosphate buffered saline (PBS), fixed with 4% formaldehyde for 20 min at room temperature, and then washed with PBS 3 times. After permeabilization in Triton/PBS solution containing 0.1% Triton X-100 (TX-100) for 15 min, cells were blocked for 30 min in 3% bovine serum albumin (BSA, Sigma) in PBS with 0.1% TX-100, and then incubated with primary phospho-histone H3 antibody (1:200, Thermo Fisher Scientific, Massachusetts) or phospho-γH2AX (γH2AX, Millipore-Sigma) in PBS and 0.1% TX-100 over night at 4 °C. After washing with PBS/Tween-20 twice, cells were incubated with goat antimouse Dylight 650, goat antirabbit Dylight 550 (Thermo Fisher Scientific), and Hoechst 33342 (Molecular Probes, Oregon) in PBS/BSA solution for 90 min at room temperature. Prior to image acquisition, cells were stained for 30 min at room temperature with Alexa Fluor 488 Phalloidin (Cell Signaling, Massachusetts) for F-actin staining. The multichannel images were automatically captured using an Arrayscan VTI HCS reader with a Studio 2.0 Target Activation BioApplication module (Thermo Fisher Scientific). Thirty-six fields per well were acquired at 40× magnification using a Hamamatsu ROCA-ER digital camera in combination with 0.63× coupler and Carl Zeiss microscope optics for automatic image acquisition. Channel 1 (Ch1) applied the BGRFR 386_23 for Hoechst 33342, which was used for an auto-focus channel, and the objects (nuclei) were identified. For F-actin and γH2AX or Phospho-Histone H3 staining, Ch2 applied the BGRFR 485_20 for F-actin and Ch3 applied the BGRFR 650_13 for γH2AX or Phospho-Histone H3.
A 4-channel assay was conducted to assess the cell-type specific marker staining for GCNA1 and StAR. Ch1 was applied the BGRFR 386_23 for Hoechst 33342, Ch2 applied the BGRFR 485_20 for F-actin, Ch3 applied the BGRFR 650_13 for GCNA1, and Ch4 for StAR. For negative control, the primary antibody was omitted, and was stained with the secondary antibody only, indicating that the primary antibodies used were due to primary antibody specificity and not to unspecific binding of the secondary antibody to the cells.
Single-cell based HCA provided multi-parameter phenotypic profiling characterization, including number, nuclear area, shape, and intensity, as previously reported (Liang etal., 2017). Nuclear shape measurement included P2A and LWR parameters. P2A, which evaluates nucleus smoothness, is a shape measurement based on the ratio of the nuclear perimeter squared to 4π*nucleus area (perimeter2/4 π * nucleus area). LWR (length-width ratio), which evaluates nucleus roundness, measures the ratio of the length to the width of the nucleus. Total intensity was defined as the total pixel’s intensities within a cell in the respective channel; the average intensity was defined as the total pixels’ intensities divided by the area of a cell in the respective channel. With 36 fields of each well, at least 4000 cells were analyzed per well, and single-cell based data for each channel were exported for further statistical analysis. The experiments were performed with at least 4 biological replicates and repeated at least twice.
For quantitative analysis of 3D F-actin cytoskeleton, we applied the Cytoskeletal Rearrangement Assay in the Morphology Explorer Bioapplication (Thermo Fisher Scientific, Massachusetts) to determine the number, dimensions, and alignment—as well as the texture – of actin fibers based on the manufacturer’s guideline (Thermo Fisher Scientific, 2010). Briefly, for identification of fibers, pixels with high intensities were selected, and the threshold level controlled by the Assay Parameter Detection was set at a value of 1 (Figure 2). There are 2 levels of texture measurements of F-actin. The first-order texture measures are based on the pixel intensity distribution, including mean (AvgIntentCh3) or total intensity of an object (TotalIntenCh3), variability of the intensity distribution (VarIntenCh3), skewness (SkewIntenCh3), kurtosis (KurtIntenCh3), entropy (EntropyIntenCh3), and the variation of surface area density (DiffIntenDensityCh3). FiberAlign1 reflects the arrangement and alignment of the fibers inside the cell. FiberAlign2 reflects the angle of each individual fiber’s orientation with the axis of the image. The second-order texture measures are intensity-independent spatial arrangements of the different pixels. The cooccurrence matrix is calculated based on the number of occurrences of a pixel with a certain intensity being adjacent to a pixel of another specific intensity. Four parameters were reported, including maximum probability (MaxCoocIntenCh3), contrast (ContrastCoocIntenCh3), entropy (EntropyCoocIntenCh3), and angular second moment ASMCoocIntenCh3.
Neutral red dye uptake assay
Cell viability was determined by measuring the capacity of cells to take up NR (Repetto etal., 2008; Yu etal., 2005, 2009). NR is retained inside the lysosomes of viable cells, while the dye cannot be retained if the cells die. Dye retention is proportional to the number of viable cells, and can be measured based on NR absorbance value. Cells were seeded to 96-well plates, and treated with different compounds at 4 doses with 5 replicates. Cells treated with the vehicle (0.05% DMSO) were used as the background group with cell viability set as 100%. After 24 or 48 h, the medium was replaced with a medium containing NR dye (50 μg/ml, 200 μl per well). Following 3 h incubation, the supernatants were removed, the cells were washed with PBS twice, and NR was eluted with 100 μl of a 0.5% acetic acid/50% ethanol solution. The plate was gently rocked on a plate shaker, and absorbance values were measured at 540 nm with a Synergy HT microplate reader (BioTek, Vermont). Cell viability was expressed as a percentage of the mean of vehicle controls after subtracting the background control. The initial testing concentrations of these compounds were determined based on the published cytotoxicity data. After examination of the initial dose-response curve from the coculture model, the dose ranges were adjusted. For those compounds with less cytotoxicity, the highest concentrations tested were 50 and 5 mM in the water-soluble or DMSO vehicle, respectively.
In vivo reproductive toxicity data and comparison
The U.S. EPA’s ToxCast program reviewed the invivo animal studies and established the Toxicity Reference Database (ToxRefDB) (https://actor.epa.gov/actor/home.xhtml). Reproductive rLOAELs (rLOAEL) from invivo studies were generated, and reflected reproductive toxicities (Martin etal., 2011). The endpoints for determining rLOAEL of invivo studies include, but are not limited to, primary fertility, early offspring survival, offspring weight, longer-term offspring survival, and other systemic toxicities of offspring. As previously reported, in vivo reproductive toxicants were defined as having achieved an rLOAEL < 500 mg/kg/d (Martin etal., 2011). Compounds such as BPS, BPAF, and TBBPA with insufficient invivo reproductive toxicity data were marked as “NA” for ‘no available information’. A concordance analysis was performed to assess the degree of agreement of chemical positive or negative response between the NR assay and invivo evaluation, or the percentage of cell viability from the NR assay that matched the calls from those in the literature. In addition, sensitivity (%) was calculated based on the formula: 100 × (the proportion of chemicals with a positive result in an NR assay that were positive based on the literature calls). Similarly, specificity (%) was derived from the formula: 100 × (the proportion of chemicals with a negative result in the NR assay that were negative based on the literature).
Statistical analysis
All data obtained from the HCS Studio 2.0 BioApplication were exported, and further analysis was conducted using the JMP statistical analysis package (SAS Institute, North Carolina). The parameters from the single-cell based imaging were quantified, and the geometric mean for each well was determined. Data were presented as geometric mean ± SD. Statistical significance was determined using 1-way ANOVA followed by a Tukey-Kramer all pairs comparison. The cell viabilities were calculated as the arithmetic mean percentages of treated versus the respective control. The data represented the average ± SD of 5 replicates. IC20, IC50, and IC85 values were calculated using the logistic 4P models in the Sigmoid Curves fit in the JMP. Nonsupervised Hierarchical Clustering analyses of dose-response curves (IC20, IC50, and IC85) of tested compounds were used to determine the binary category based on the average linkage and elucidation distance correlation coefficients using MeV software (Chittenden etal., 2012). Correlation of IC50 values against the published invivo reproductive LOAEL data was calculated. The degree of correlation was examined based on the r value and the regression coefficient (R2). The Pearson correlation coefficient between IC50 values and rLOAEL were also calculated. Statistical analysis was conducted using JMP software (SAS Inc. Cary, North Carolina).
RESULTS
Construction of Coculture Model Using Testicular Cell Lines and Overview of Morphology
Morphological comparisons of the invitro culture models
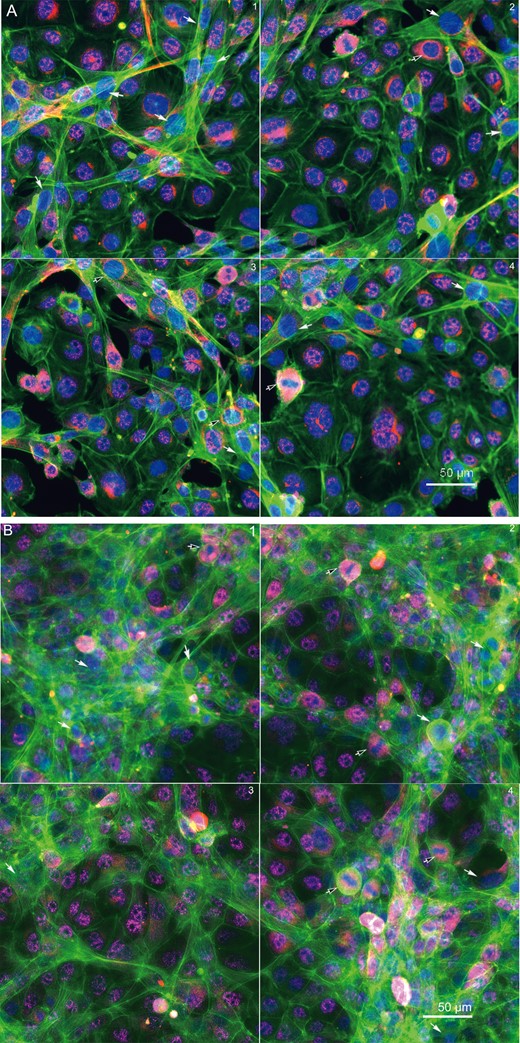
We established a testicular coculture model using spermatogonial, Sertoli, and Leydig cells, based on the cellular composition of 5-day postnatal mouse testis. The testicular cells in a defined proportion were seeded in a 96-well plate in DMEM supplemented with 5% Nu-serum with an overlay of ECM. In order to examine whether the cocultured cells grew into biomimetic and 3D structures, we examined F-actin cytoskeleton along with cell proliferation markers (Figure 1). As illustrated in Figure 1A (48 h) and B (72 h), representative 4-field images per well were shown to reflect the overall structure of nuclear (Hoechst 33322, blue), F-actin cytoskeleton (phalloidin, green), and mitotic status of cells (phosphorylated Histone H3, red). Overall, distinct F-actin cytoskeletal structures, including intensity and distribution of actin fibers, were observed in the coculture model (Figs. 1A and B), as compared with the single cell culture models, including spermatogonial cells (Figure 1C), Sertoli cells (Figure 1D) and Leydig cells (Figure 1E). We found unique cord-like multiple-layer structures with actively dividing cells in the coculture (Figs. 1A and B), and observed mesh-like assembly and thicker bundles of F-actin filaments (green) across multiple cells in the coculture model at 72 h postinoculation. These cellular structures observed in the coculture model were noticeably different from any type of single cell cultures (Figs. 1C–E). As shown in Figure 1C, the spermatogonial cells expressed strikingly dense cortex F-actin, which was localized at the cell boundary, but not notably in the cytoplasm. No obvious differences in the mitotic counts by phosphorylated Histone H3 staining were found between the coculture and single spermatogonial cell culture models (white arrows). Like the spermatogonial cells, Leydig cells formed diffuse F-actin fibers without a distinct boundary between cells (Figure 1D). Cells undergoing cell division with reorganization of cytoskeletal structure showed a distinct F-actin “contract ring” (Figure 1D, white arrows). In contrast to the spermatogonia and Leydig cells, the fine F-actin fibers in the Sertoli cells stretched through the cytosol and interconnected across multiple cells. We also observed these “contract rings” in the dividing Sertoli cells (Figure 1E, white arrows).
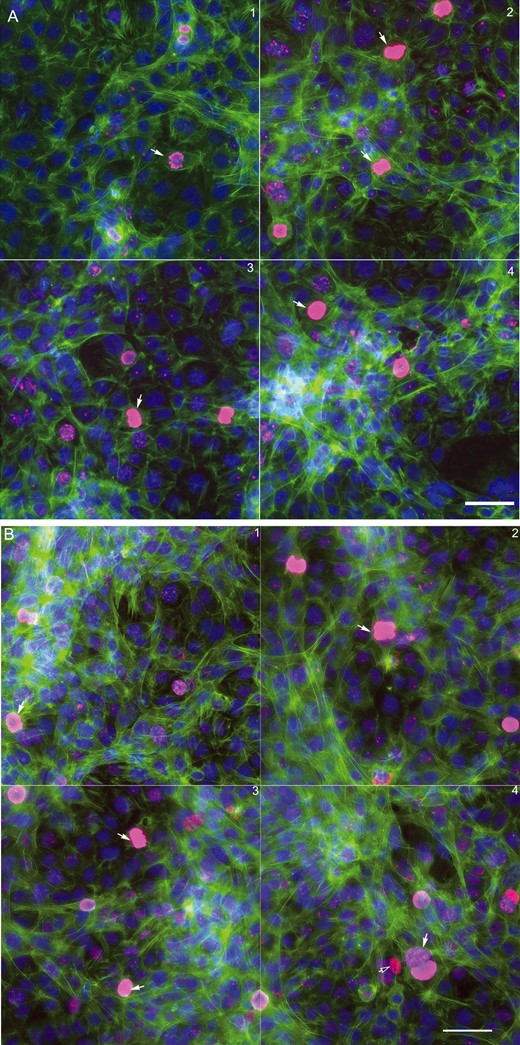
Morphological comparison between the testicular coculture model (A,B) and single cell culture models, including spermatogonia (C), Leydig cells (D) and Sertoli cells (E). The testicular cell coculture model consisted of 3 cell types: Spermatogonial cells (C18-4), Leydig cells (TM3), and Sertoli cells (TM4); the morphological images of coculture are shown in (A; 48 h) and (B; 72 h). Single cell cultures of spermatogonial (C18-4, C), Leydig (TM3, D) and Sertoli cell culture (TM4 E) are shown at 48 and 72 h. Cells were fixed with 4% paraformaldehyde, stained with antibodies, and automated multi-channel images were acquired using ArrayScan VTI with 40× magnification (Thermo Fisher Scientific, MA). Multi-channel images show the morphology, including nuclear (Hoechst 33 342, blue), cytoskeleton F-actin (phalloidin, green) and mitotic marker phosphor-histone H3 (pink). All experiments included 3 replicates, and were repeated 3 times. White arrows in (A) indicate mitotic cells, and white arrows in (D,E) indicate dividing cells with an F-actin “contract ring”. Scale bars: 50 μm.
Quantitative analysis and comparisons of cytoskeleton
We further quantitatively characterized F-actin cytoskeleton using a Cytoskeletal Rearrangement algorithm to demonstrate the 3D structure in the coculture. Figure 2 illustrates the quantification of F-actin based on the images obtained from the coculture model. Automatic segments of the nuclear (B, blue outline) and cell outlines (C, yellow outline) were conducted, and the location and orientation of F-actin fibers were determined. Actin fibers greater than a threshold length (1.6) were identified (D, green) and the fiber intensity over 50 pixels were highlighted with red. The overlay of red and green indicates that the actin filaments are organized into higher order structures, forming actin bundles across the cells in the coculture model. Figure 3A shows the scatterplot of nuclear area and total intensity of the nuclear staining, reflecting the distribution of cell populations in the coculture as compared with the single cell culture condition. In contrast to the spermatogonial cell culture, we observed an increase in the population with a smaller nuclear size in the coculture, reflecting the existence of Sertoli and Leydig cells. Quantification of nuclear morphology (Figure 3B) showed a larger number of cells in the coculture at 48 h, with a slight increase at 72 h. In the single cell culture, the number of cells was lower as compared with the coculture at 48 h, and increased significantly at 72 h. The average nuclear area was similar at 48 h between the 2 types of cultures, and decreased significantly at 72 h, especially for the single culture (Figure 3B). There was no difference in nuclear shapes at 48 h, but significantly higher ratios of P2A (nucleus smoothness) and LWR were observed at 72 h in the single cell culture as compared with the coculture (Figure 3B). As shown in Figure 3C, the distribution and arrangement of F-actin fibers were quantified (first-order texture measures), showing the spatio-temporal changes of F-actin in the coculture model and single spermatogonia culture at 48 and 72 h. The geometric mean of F-actin fiber count (SpotFiberCountCh3), both the average and total intensity of fibers (AvgIntenCh3/TotalIntenCh3), were higher in the coculture as compared with a single cell culture at 48 h, and maintained a similar level at 72 h (Figure 3D). Significant increases in fiber counts (SpotFiberCountCh3), along with average and total intensity of fibers (AvgIntenCh3/TotalIntenCh3), were observed at 72 h after seeding, and reached at a similar level in the coculture model. We observed higher variability of the intensity distribution (VarIntenCh3), arrangement, and alignment of the fibers inside the cell (FiberAlign1Ch3) in the coculture than those in the single cell culture at 48 h; however, these parameters increased significantly in the single cell culture at 72 h, while maintaining similar levels in the coculture (Figure 3C). There were no significant differences in the measure of FiberAlign2Ch3 between the 2 types of cultures at both time-points. Regardless of the time-points, higher geometric means of kurtosis (KurtIntenCh3) were observed in the coculture as compared with the single cell culture. The geometric mean of Skewness (SkewIntenCh3) was similar between the 2 types of culture at 48 h, and significantly decreased in the single cell culture at 72 h. The geometric mean of entropy (EntropyIntenCh3) was lower in the coculture at both 48 and 72 h time-points. The second-order texture measures of F-actin reflecting the spatial arrangements of the different pixels are shown in Figure 3D. Slightly lower maximum probability (MaxCoocIntenCh3) and angular second moment (ASMCoocIntenCh3) were observed in the single cell culture at 48 h, but MaxCoocIntenCh3 slightly increased at 72 h. When compared with the single cell culture, the coculture model had lower levels of entropy (EntropyCoocIntenCh3) and contrast (ContrastCoocIntenCh3) at both time-points. Higher levels of entropy (EntropyCoocIntenCh3) and contrast (ContrastCoocIntenCh3) were observed at 48 h in the single cell culture, and then decreased at 72 h. All together, these parametric measurements of F-actin fibers showed distinct 3D features of cytoskeleton in the coculture. These higher order F-actin structures may enhance the cell-cell interactions of Sertoli, Leydig, and germ cells in the coculture model, and improve the overall invitro biological functionality.
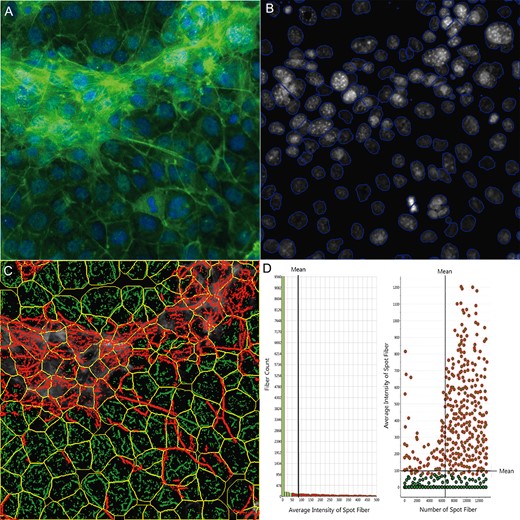
Single-cell-based quantification of F-actin cytoskeletal structure. The multi-channel images were automatically captured using an Arrayscan VTI HCS reader with HCS Studio 2.0 Morphology Explorer BioApplication module (Thermo Fisher Scientific, Massachusetts). Cytoskeletal rearrangement analysis was conducted in the images obtained from the coculture model (A), and automatic segmentation of the nuclei images cells (blue line, B) and cellular outline (yellow line, C) were conducted. The localization and orientation of F-actin fibers were determined (C, green). A statistical summary of F-actin fibers was identified from bar charts and scatter plots (D). Actin fibers greater than a threshold length were identified and labeled with green, and the fiber intensity over 100 pixels were highlighted with red overlay (D), indicating F-actin bundle formation across cells in the coculture model.
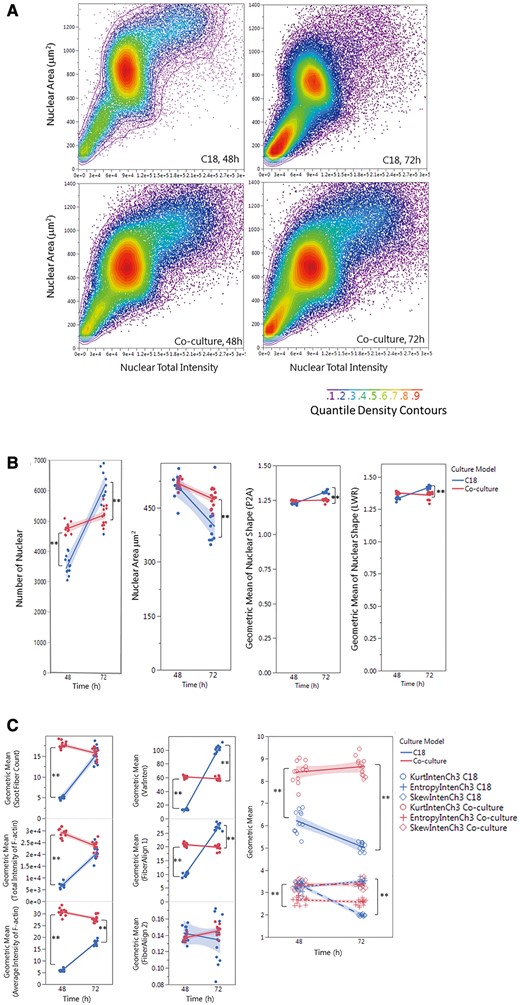
Single-cell-based HCA of cell population (A), nuclear morphology (B) and F-actin cytoskeleton (C,D) in the testicular cell coculture model and single spermatogonia culture model. The single-cell-based analysis of the cell populations in the coculture as compared with the spermatogonial culture model is shown in panel A. The scatter plots of nuclear area versus nuclear total intensity at 48 or 72 h postinoculation denote the cell sub-populations, as shown in the color-code chart. Quantifications of nuclear morphology changes, including nuclear number, area, and shapes (P2A and LWR) are shown in panel (B). Quantifications of F-actin fiber distribution and variation of fiber intensity (the first-order texture) are shown in panel (C), including the geometric mean of F-actin Fiber count (Spot Fiber Count), average and total intensity of fibers, variability of the intensity distribution (VarInten), arrangement and alignment of the fibers inside the cell (FiberAlign1 and FiberAlign2), geometric means of kurtosis (KurtIntenCh3), Skewness (SkewIntenCh3), and entropy (EntropyIntenCh3). Quantifications of F-actin spatial arrangements (the second-order texture) are shown in panel (D). The second-order texture measures of F-actin reflected the spatial arrangements of the different pixels, including the maximum probability (MaxCoocIntenCh3), angular second moment (ASMCoocIntenCh3), entropy (EntropyCoocIntenCh3) and contrast (ContrastCoocIntenCh3). Data were presented as geometric mean of each well, and the linear line fit across the 2-time-point was conducted. Statistical analysis was conducted by one-way ANOVA followed by Tukey-Kramer multiple comparison (*p ≤ .05 and **p ≤ .001). The shaded area reflects the 95% CIs.
To assess the validity of toxicity testing using this coculture model, we applied it to examine the effect of cadmium, a known reproductive toxicant, using a multi-parametric high-content assay. Figure 4 illustrates the morphological changes of the coculture with cadmium treatment at 0.05, 0.25, 0.50, and 1.0 μM for 48 h. We examined changes in nuclear morphology, cytoskeleton, and early DNA damage markers using γH2AX staining. Cadmium treatment induced significant morphological disruptions, including destruction of cytoskeletal structure and decrease of cell proliferation (cell number). Following exposure to cadmium, actin fibers were found to be truncated and depolymerized (annotated by white arrows). F-actin fibers were retrieved into the cell cytosol instead of stretching out across the cytosol as shown in the control cells. Further, cadmium significantly induced phosphorylation of γH2AX foci formation (black arrows) in a dose-dependent response (Figure 4D).
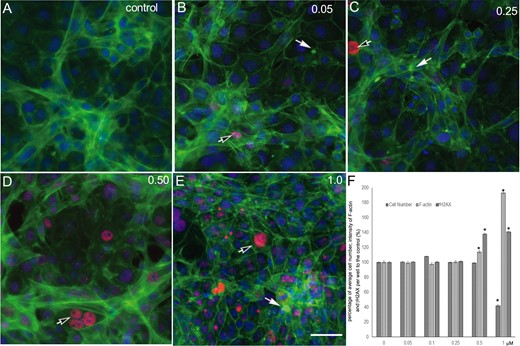
Cadmium treatment-induced destruction of F-actin and γH2AX expression in the testicular coculture model. The representative images show the altration of F-actin distribution and γH2AX expression levels in control (A), 0.05 (B), 0.25 (C), 0.50 (D), and 1.0 (E) μM. The invitro coculture was estabolised from the testicular cell lines—including Spermatogonial stem cells, Sertoli cells, and Leydig cells—with ECM overlay for 24 h, and then treated with cadmium for 48 h. Multi-parametic analysis shows nuclear (Hoechst 33342, blue), cytoskeleton F-actin (phalloidin, green), and primary phospho-γH2AX followd with secondary Dylight 650 conjugated antibody (red). The images show a representative field from 49 fields captured for each well. HCA of F-actin and γH2AX expression was conducted, and the percentage of the cell number, fluorescence intensity of f-actin, and γH2AX over the control were calculated (F). Data were presented as mean ± SD, n = 6. Three replicates in 2 separate experiments were included. Statistical analysis was conducted by 1-way ANOVA followed by Tukey-Kramer multiple comparison (*p < .05, **p < .01). Scale bars: 50 μm.
Characterization of multiple cell types in the coculture
To further identify the composition of the microniches of the coculture model, we applied cell-type specific protein markers to characterize the testicular cells in the coculture. GCNA1 is a continually expressed protein specific to spermatogonial cells. Leydig cells were identified as having an antibody against steroidogenic acute regulatory protein (StAR). SOX9 is proposed to be a specific marker for Sertoli cells, but we found it also expressed in C18-4 and TM3 cells. As shown in Figure 5, the cells with GCNA1nuclear staining (pink) were spermatogonial cell. The cells with blue nucleus and reddish StAR staining in the cytoplasm are Leydig cells (black arrows). The cells expressing neither GCNA1 nor StAR staining are indicated as Sertoli cells (white arrows). In general, these cells had thicker bundles of F-actin stretching out to other cells, and formed cord-like structures at 48 h (Figure 5A). At 72 h (Figure 5B) postinoculation, fine F-actin fibers formed a 3D cytoskeletal network throughout the cells. The spermatogonial cells with nuclear GCNA1 pink staining were located within these cord-like structures.
Immunofluorescence of the testicular cell coculture model with cell-type-specific protein markers at 48 h (A) and 72 h (B) postinoculation. Representative images show the 3 cell types of testicular cells in the coculture model. Spermatogonial cells (C18-4) are labeled with a specific mouse GCNA1 (pink staining in nucleus); Leydig cells are labeled with steroidogenic acute regulatory protein (StAR, red staining in cytoplasm, black arrow); and Sertoli cells are labeled with neither GCNA1 nor StAR (white arrow).
Comparison of Cell Viability of the Testicular CoCulture Model by 32 Chemicals
As the first step to validate whether this invitro coculture model can be used to screen testicular toxicants, we compared the cytotoxicity with known reproductive toxicants (Table 1). We applied the NR uptake assay to examine dose-dependent responses with those selected compounds in the coculture model, as well as a single cell culture model for 24 and 48 h, including spermatogonial cells (C18), Sertoli cells, and Leydig cells. Figure 6 shows dose-dependent cytotoxicity in response to 32 testing compounds in the coculture model after 48 h treatment. These compounds were organized into 4 charts based on their highest concentrations of testing chemicals (Figs. 6A–D). Figure 6A includes compounds whose concentrations tested highest at 100 µM, including ZEA, Cd, As, HEP, DES, BPAF, TBBPA, HEX, and ZEA. As, BA, BBP, BEN, BPA, BPAF, BPS, Cd, CHL, CYC, DBP, DBPAF, DEHP, DEP, DES, DIA, DMP, DOTP, DPP, ES, HEP, HEX, HU, ME, PARA, SAC, TBBPA, TCEP, TCP, TCS, VIN, VPA, ZEA Arsenic (As) and cadmium (Cd) were most toxic, followed by HEP, DES, BPAF, TBBPA, and HEX. Figure 6B shows the dose-dependent cytotoxicity of phthalate esters. Male developmentally toxic phthalate esters, including DBP, DEHP, BBP, and DPP, induced a dose-dependent decrease of cell viability after treatment for 48 h, while nontoxic phthalate esters, including DEP, DMP, and DOTP, induced no or slight decrease of cell viability. Figure 6C shows a group of compounds, including TCS, CHL, DIA, BPA, PARA, BEN, and ES, with the highest concentration tested ranging from 100 to 500 µM. TCS, CHL, DIA, BPS, BPA, ES, and BEN induced a significant dose-dependent decrease of cell viability (Figure 6C). The compounds listed in Figure 6D are the least cytotoxic, with the highest concentrations ranging from 5 to 50 mM. The treatments with compounds HU, VIN, TCEP, BA, and VPA had statistically significant decreases in cell viability, while CYC, TCP, ME, and SAC did not cause a significant decrease in cell viability across all concentrations.
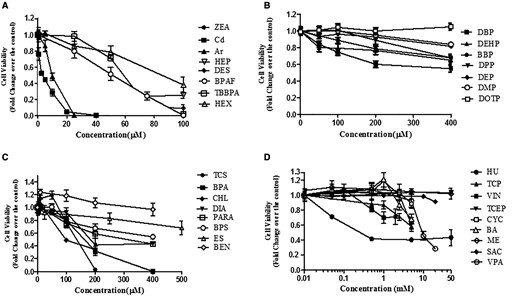
Comparison of cell viability of the tested compounds for 48 h exposure in the coculture model. The invitro coculture model was estabolised from the testicular cell lines—including Spermatogonial stem cells, Sertoli cells, and Leydig cells—with ECM overlay for 24 h, and then treated with 32 compounds for 48 h. Cell viability was assessed using a NR dye uptake assay. Data are presented as mean ± SD of 5 replicates. The compounds were sorted into 4 groups based on the highest concentrations tested. Statistical analysis was conducted by 1-way ANOVA followed by Tukey-Kramer multiple comparison. The compounds in A group caused a statistically significant decrease in viability with all concentrations at 24 and 48 h (p < .05). The compounds (DBP, DEHP, and BBP) in B group caused a statistically significant decrease in viability at 200 μM (p < .05). The compounds in C group caused a statistically significant decrease in viability at 200 μM (p < .05). No statistically significant changes were observed with the compounds in D group at the concentrations below 1 mM, except HU. The data represent the mean of 3 independent experiments (4 technical replicates for each experiment). Bars represent the SD of the means.
IC50 Values of 32 Compounds Tested Using the Coculture or Single Culture Models
IC50 values of the compounds treated in the coculture or single cell culture models at 24 and 48 h are summarized in Table 2. As indicated there, IC50 values for 24 h treatment were generally higher than those for 48 h treatment. The IC50 values for Cd, ZEA, As, HEP, DES, TBBPA, TCS, HEX, and CHL were mostly ≤ 100 µM. The IC50 values of chemicals in the second and third groups (Figs. 6B and C) were mostly ≤ 500 µM. For chemicals in the fourth group (Figure 6D), the toxicities were too low to derive IC50 values from the simulation; therefore, the highest concentrations tested were used.
IC50 Values of Tested Compounds Among Various Cell Culture Models
| Chemical | IC50 (µM) | |||||||
|---|---|---|---|---|---|---|---|---|
| Coculture | Spermatogonial Cell | Leydig Cell | Sertoli Cell | |||||
| 24 h | 48 h | 24 h | 48 h | 24 h | 48 h | 24 h | 48 h | |
| ZEA | 7.2 | 4.1 | 3.8 | 2 | 3.4 | 2.5 | 3.1 | 2.5 |
| Cd | 11.3 | 4.2 | 2.1 | 2.1 | 16 | 8.5 | 14.6 | 9.5 |
| As | 15 | 10 | 6.9 | 6.8 | 20.3 | 16.1 | 12 | 6.9 |
| HEP | 19.7 | 11.4 | 109 | 20 | 2.8 | 0.6 | 3 | 2.7 |
| DES | 51.1 | 29 | 25.5 | 18 | 22.37 | 5.57 | 25.9 | 24.1 |
| TBBPA | 70 | 58 | 74.9 | 55 | 70 | 60 | 60 | 38 |
| TCS | 121 | 76.5 | 62.7 | 57.3 | 135 | 80 | 81 | 72.7 |
| BPAF | 78 | 50 | 70 | 58.5 | 30 | 20 | 55.4 | 22.3 |
| HEX | 83.1 | 82 | 22 | 5 | 69 | 59 | 55 | 44 |
| CHL | 91.5 | 89 | 118 | 96 | 142 | 120 | 212 | 120 |
| HU | 1000 | 200 | 1000 | 300 | 600 | 200 | 396 | 150 |
| BPA | 210 | 186 | 190 | 184.5 | 88 | 80.5 | 89 | 79 |
| DIA | 270 | 222 | 303 | 200 | 286 | 250 | 256 | 227 |
| BPS | 574 | 341 | 505 | 357 | 435 | 400 | 211 | 74.3 |
| DPP | 550 | 352.5 | 400 | 372 | 400 | 244 | 400 | 400 |
| DBP | 437 | 387.5 | 400 | 371 | 400 | 400 | 400 | 400 |
| PARA | 469 | 400 | 342.65 | 307.2 | 400 | 400 | 294 | 117.5 |
| TCP | 5000 | 499 | 2929 | 1867 | 5000 | 600 | 298 | 163 |
| BBP | 885 | 538.9 | 400 | 400 | 400 | 400 | 400 | 400 |
| DEHP | 681 | 400 | 527 | 400 | 400 | 400 | 400 | 400 |
| BEN | 400 | 400 | 400 | 400 | 400 | 400 | 400 | 400 |
| ES | 1000 | 240 | 1000 | 260 | 1000 | 927 | 1000 | 220 |
| VIN | 4000 | 3600 | 1788 | 560 | 2000 | 2000 | 2000 | 2000 |
| BA | 5000 | 5000 | 5000 | 3582 | 5000 | 5000 | 5000 | 5000 |
| TCEP | 5000 | 5000 | 5111 | 3678 | 5000 | 5000 | 5000 | 5000 |
| CYC | 5000 | 5000 | 5000 | 5000 | 5000 | 5000 | 5000 | 5000 |
| VPA | 20 000 | 8850 | 20 000 | 6000 | 20 000 | 9481 | 20000 | 7606 |
| SAC | 20 000 | 20 000 | 20 000 | 20 000 | 20 000 | 20 000 | 20 000 | 20 000 |
| ME | 50 000 | 50 000 | 50 000 | 50 000 | 50 000 | 50 000 | 50 000 | 50 000 |
| DEP | 400 | 400 | 400 | 400 | 400 | 400 | 400 | 400 |
| DMP | 400 | 400 | 400 | 400 | 400 | 400 | 400 | 400 |
| DOTP | 400 | 400 | 400 | 400 | 400 | 400 | 400 | 400 |
IC50 indicates the half maximal inhibitory concentration. Cell viabilities from NR dye uptake assay were calculated as the mean value of optical density of treatment group by the control. IC50 were derived from dose-response curves with StatPlus using survival analysis and the probit method. For chemicals that the cell viability did not achieve 50% decrease at the highest concentration, the highest concentration tested was assigned as IC50.
Cell type-specific difference of cytotoxicity was observed by comparing IC50 values from different cell types treated with the same compound using a radar plot, a multivariate graphical method, as shown in Figure 7. The plot was generated based on log2 transformation IC50 values of individual compounds tested in a certain cell culture model that subtracted the average of log2 IC50 from all tested culture models. Points inside the circle indicate increased levels of toxicity (relative low IC50 values); points outside indicate less toxicity. A radar graph consists of axis lines that start in the center of a circle and extend to its periphery, and IC50 values are proportional to the radius of the graph, allowing for a direct comparison of the toxicity across cell culture conditions tested. Our results show that Sertoli cells were most sensitive to BPS and TCP (Figure 7). Leydig cells were most sensitive to HEP and spermatogonial cells were most sensitive to HEX and VIN. Depending on the test compound, cytotoxicity obtained from the coculture model was different from the single cell culture models, and in general, the IC50 values of the coculture were close to the mean values of IC50 of the single cell models used (Table 2).
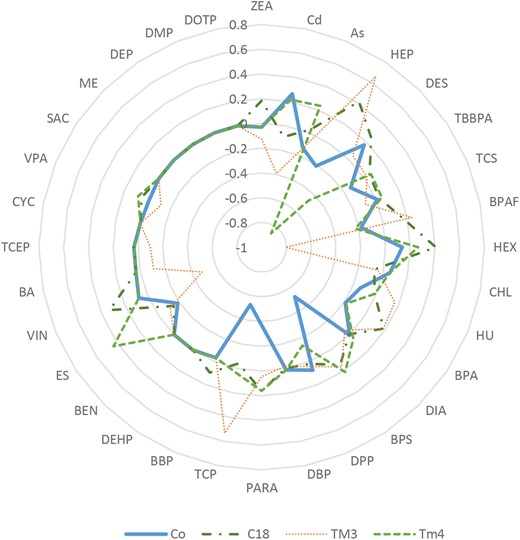
Comparison of the relative toxicity of 32 tested compounds using a radar plot. The axis values were calculated as Log2 IC50 of individual compound using a culture model subtracted by the average of Log2 IC50 from all tested culture models. C18-4, TM3, and TM4 indicate spermatogonial, Leydig, and Sertoli cell cultures, respectively.
Nonsupervised Cluster Analysis of IC50 Values for Coculture Model
To compare the testicular toxicity among all tested chemicals using our model, a nonsupervised 2D hierarchical cluster analysis of IC20, IC50, and IC85 values was employed using the coculture model for 48 h treatment (Figure 8). Based on IC20, IC50, and IC85 value obtained from cell viability, the cluster analysis organizes the IC values into discrete groups based on patterns of similarity or dis-similarity. Figure 8 illustrates the relative degree of cell cytotoxicity in the tested compounds, which shows the cell viability in a dose-dependent manner. The chemicals at the top (cluster A) were the most toxic, and those at the bottom (cluster D) were the least toxic. Cluster A includes Cd, ZEA, As, HEP, DES; cluster B includes TBBPA, CHL, TCS, HEX, BPAF, DBP, DPP, BPA, DIA, and HU; cluster C includes BBP, BEN, VIN, PARA, DEHP, VPA, and ES; cluster D includes nontoxic phthalate esters DOTP, DEP, DMP, ME, and negative control SAC, as well as TCP, CYC, and BA, which showed testicular toxicity invivo.
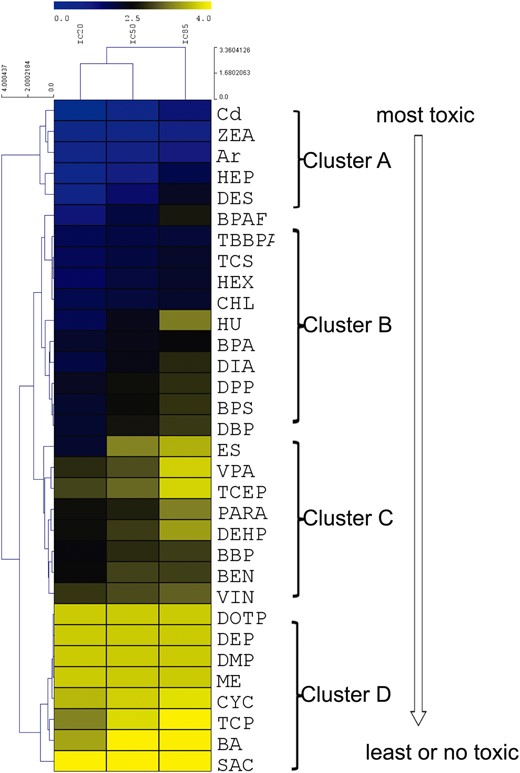
Hierarchical cluster analysis of ICs values of 32 tested compounds in the testicular coculture model based on cell viability assay. Nonsupervised 2D hierarchical clustering analysis of IC20, IC50, and IC85 was conducted using the average linkage and elucidation dissimilarity method. IC20, IC50, and IC85 were Log10-transformed prior to analysis. Gradient color indicates the relative level of the log-transformed IC values. Since the IC values for the low toxicity chemicals could not be derived through calculation, the maximum dose of 5000 µM was selected. The toxicity rankings of different categories of chemicals were assessed.
Correlation between IC50 Values From In Vitro Toxicity and In Vivo Reproductive LOAEL Values
The rLOAEL values were extracted from the published literature, and indicate the lowest effective doses for reproductive toxicity invivo. Among 32 tested compounds, 17 of them had reported invivo rLOAEL values, and the correlation between IC50 values from invitro and reproductive LOAEL values was examined, and determined to what extent an invitro IC50 could predict an invivo rLOAEL. As shown in Figure 9, R2 values for the coculture model, spermatogonial cells, Leydig cells and Sertoli cells for 48 h treatment were 0.53, 0.1, 0.19, and 0.31, respectively. The coculture model had the highest R2 value when compared with any single cell culture model. Table 3 shows that Pearson’s correlation coefficient and the r-values of the coculture model, spermatogonial cell, Leydig cell, and Sertoli cell culture models, at 24 h treatment were 0.66, 0.16, 0.21, and 0.48, respectively; at 48 h exposure, r-values were 0.73, 0.31, 0.44, and 0.56. The coculture model displayed the highest r-value of any single cell types at both 24 and 48 h treatments.
Comparison of Correlation Coefficient Among the Culture Models
| Time | Correlation Coefficient r | |||
|---|---|---|---|---|
| Coculture | Spermatogonia Cell | Leydig Cell | Sertoli Cell | |
| 24 h | 0.6557 (p = .0109) | 0.1632 (p = 0.5611) | 0.2082 (p = .4070) | 0.4832 (p = .0422) |
| 48 h | 0.7296 (p = .0009) | 0.3114 (p = 0.2237) | 0.4443 (p = .0497) | 0.5609 (p = .0192) |

Linear regression between invivo reproductive toxicity (rLOAEL values) and IC50 values from the invitro coculture or single cell culture models at 48 h. Equations and R2 are listed for each panel of regression plot. The coculture at 48 h had the highest R2 value (0.532).
Assessment of Concordance, Sensitivity, and Specificity of the Coculture Model
The concordance, sensitivity, and specificity were calculated for the coculture model. Among 32 tested compounds, BPS, BPAF, and TBBPA—the analogues of BPA, tested positive invitro and were extrapolated to be reproductive toxicants invivo. Since there were no available invivo data regarding their reproductive toxicity, they were not included in the calculation. Based on the results of cluster analysis, compounds in the cluster A, B, and C were defined as positive reproductive toxicants, and Cluster D was defined as negative. TCP, BA, CYC, and ME in Cluster D were negative invitro but positive invivo models. At 48 h, the coculture model displayed high concordance, sensitivity, and specificity, with values of 84%, 86.21%, and 100%, respectively (Table 4).
Concordance, Sensitivity, and Specificity of the In Vitro Coculture Model
| In vivo animal study | Total | |||
|---|---|---|---|---|
| Positive | Negative | |||
| In vitro coculture model | Positive | 21 | 0 | 21 |
| Negative | 4 | 4 | 8 | |
| Total | 25 | 4 | 29 | |
| In vivo animal study | Total | |||
|---|---|---|---|---|
| Positive | Negative | |||
| In vitro coculture model | Positive | 21 | 0 | 21 |
| Negative | 4 | 4 | 8 | |
| Total | 25 | 4 | 29 | |
Sensitivity: 21/25 = 84%; Concordance: (21 + 4)/(25 + 4) = 86.21%; Specificity: 4/4 = 100%.
DISCUSSION
Sertoli cells, Leydig cells, and peritubular myoid or endothelial cells all play critical roles in supporting and maintaining spermatogenesis in the testis. Damage of any type to these cells will result in testicular dysfunction. Single cell culture models of germ cells, Sertoli cells, and Leydig cells have been previously used to examine testicular toxicity (Bilinska, 1989; Chapin etal., 1988; Gray, 1986; Griswold, 1998; Hadley etal., 1985; Lejeune etal., 1998; Mather etal., 1990; Orth and Jester, 1995; Yang etal., 2003). Spermatogonial C18-4 germline cells exhibited the morphological features of spermatogonial cells and expressed germ cell-specific proteins (Hoffmann etal., 2005a,b). This cell line was used as an invitro cell model to evaluate testicular toxicity (Hofmann etal., 2005a,b; Kokkinaki etal., 2009; Liang etal., 2017; Oatley and Brinster, 2008), determine testicular signaling pathways (Golestaneh etal., 2009; He etal., 2008; Zhang etal., 2013), and characterize the molecular mechanisms of reproductive toxicity of nanoparticles (Braydich-Stolle etal., 2005, 2010; Lucas etal., 2012). In our previous study, we developed automated multi-parametric HCA using this cell line as an invitro model to examine the effects of Bisphenol A and its analogs on changes of cell cycle, DNA damage, and cytoskeleton. The testis has a diverse cell population, which researchers are increasingly finding useful in generating the invitro models needed to capture the complexity of invivo conditions. Therefore, the reconstituted coculture models with different somatic and germ cells have become increasingly important. Primary testicular cell coculture models have been used to evaluate testicular abnormalities during development, and have been able to identify the testicular toxicity of phthalates. However, the disadvantage of the primary testicular cell coculture model is in employing animals for the isolation of testicular cells, and the complicated isolation procedure leads to inconsistent results. Therefore, in this study, we developed an invitro testicular coculture model from rodent testicular cell lines, including spermatogonial cells, Sertoli cells, and Leydig cells with specified cell density and ECM composition.
Cytoskeletal proteins are known to have numerous roles, such as determination of cell shape, cell motility, maintenance of cell junctions, and intracellular trafficking to maintain normal function and morphology (Fletcher and Mullins, 2010). Spermatogenesis is a complicated process, resulting in the production of mature sperm from primordial germ cells. During spermatogenesis, significant structural and biochemical changes take place in the seminiferous epithelium of the testis, and testis-specific actin cytoskeleton plays an important role in the acquisition of mature sperm functionality during spermatogenesis and motility during fertilization (Lie etal., 2010, 2012). It has been shown that Sertoli cells promote the development of germ cells (Griswold, 1998; Miryounesi etal., 2013), and coculture of germ cells with Sertoli cells invitro could induce germ cell differentiation. Through qualitative and quantitative comparison of F-actin cytoskeletal structure between the coculture model and single cell culture models, we found that addition of Sertoli and Leydig cells to C18-4 spermatogonia cells significantly altered their invitro cellular structures (Figure 1). We found that each testicular cell has its unique cytoskeletal structures (Figs. 1C–E). Two types of actin fibers were observed in C18-4 cells, including evenly distributed fine fibers inside the cytoplasm, and dense cortex F-actin on the inner boundary of the plasma membrane. Leydig cells formed diffuse F-actin fibers without a distinct boundary between cells (Figure 1D). As demonstrated in both F-actin morphology and quantitative analysis, the actin filaments in the coculture were organized into higher-order structures, forming actin bundles or 3D networks. Through immunostaining with cell-type specific markers, we found F-actin fibers stretching across the Sertoli cell cytosol and interconnected other cells (Figure 5). These stretching F-actin bundles, which were organized into thicker bundles, helped to form the observed cord-like structures and created an invivo-like niche to support spermatogonial cells within a 3D environment (Figure 5). These observations suggest that the coculture model formed a 3D cellular structure that may better resemble the invivo physiological interactions, and achieve a better complex biological network essential for the testicular function. As revealed in our previous study, alteration of the F-actin cytoskeleton was a sensitive indicator for the cellular effects of Bisphenol A (Liang etal., 2017). Our current results suggest that HCA-based quantitative cytoskeleton analysis with cell-type specific markers could be used as a sensitive assay to examine the effects of compounds on the testis.
As the first step to validate this invitro coculture model, we selected 32 compounds and applied a simple neutral red (NR) uptake assay to examine whether this invitro coculture model could identify the reproductive toxicants. The NR uptake assay is one of the most sensitive and reliable cytotoxicity tests (Ceridono etal., 2012; Repetto etal., 2008). In addition, we compared the cytotoxicity from the individual cell lines, including spermatogonia C18-4, TM3, and TM4, to examine whether the invitro coculture model was more closely correlated with the invivo results. We utilized the invivo animal studies conducted by NIEHS/NTP, in which a group of experts reviewed the R/D toxicity of chemicals and identified 45 compounds as reproductive and developmental toxicants (Moorman etal., 2000). We also drew upon the EPA’s ToxCast program, which compiled the ToxRefDB including thousands of studies using a standardized approach (Auerbach etal., 2016; Karmaus etal., 2016; Kavlock etal., 2012; Paul Friedman etal., 2016). Among the 32 compounds selected for testing in the present study, 24 were confirmed invivo reproductive toxicants and 4 of them were confirmed negative controls. Additionally, 3 compounds that are structure analogs of BPA, BPAF, BPS, and TBBPA, were also included without invivo information regarding their reproductive toxicity.
Using nonsupervised cluster analysis of cytotoxicity, we found that the invitro coculture model was able to discriminate compounds into distinguishing clusters and allow the ranking of chemical toxicity. When compared with published invivo studies, our invitro results were consistent overall, with invivo toxicity data with a concordance of 86.2% and specificity of 83.3%. The reproductive LOAEL values of Cd, ZEA, As, DES, and HEP in rats were 0.088, 1, 8, 10, and 3 mg/kg/day, respectively (Martin etal., 2011; Seiler and Spielmann, 2011). DEP, DOTP, and DMP—the least toxic group—are well known as developmental nontoxic phthalates (Gray etal., 2000; Yu etal., 2009). SAC is a sweetener and was used as a negative reference compound. By comparing the current model with our previous primary cells coculture model (Yu etal., 2009), we found that both our cell line model and the primary coculture model can distinguish the toxic phthalates (DEHP, DBP, BBP, and DPP) from the nontoxic phthalates (DEP, DMP, and DOTP). We observed a higher cell death in the current cell line model than that of the previous primary cell model at the same concentrations for cadmium treatment (Yu etal., 2005). Cluster analysis can help to predict the toxicity level of new chemicals based on the cluster in which the chemical resides. TBBPA, BPS, and BPAF are analogues of BPA, and emerged as alternatives for BPA. So far, there is still insufficient invivo toxicological data regarding their reproductive toxicity. Based on the results of their positions in the cluster analysis, as well as their structure similarity to BPA, these compounds are predicted to be reproductive toxicants. This prediction was reinforced by the current ongoing invivo study from the NTP, which showed that BPAF exposure uniquely impaired pregnancies and sexual development in rats (Sutherland etal., 2017).
Through comparing the cytotoxicity data from the coculture model and the single cell culture models, we found the coculture model had the highest correlation with the invivo data. Our results suggest that the coculture model thus offered a better predictive power than the single cell culture models. Different cell types displayed different sensitivities to the same chemical, as indicated by IC50 values (Table 2 and Figure 7). Sertoli cells, Leydig cells, and spermatogonial cells in the testis play differential roles in regulation of spermatogenesis. The use of single cell culture models may not reflect the invivo responses, but could help elucidate the cell type-specific effect as well as the underlying mechanisms of toxicants. For example, the Leydig cell model is often used to investigate the effect of chemicals on steroidogenesis (Forgacs etal., 2012). In this study, we found both Leydig cells and Sertoli cells were more sensitive to HEP as compared with spermatogonia and coculture models, suggesting that Leydig cells and Sertoli could be a sensitive target for HEP. In fact, HEP is reported to induced testicular toxicity targeting the Sertoli cells (James etal., 1980) and significant decrease of inhibin B, an biomarker for Sertoli cell, was reported (Erdos etal., 2013) The lower IC50 values of TCP and BPS in the Sertoli cell model indicated that Sertoli cells appeared to be the target for these compounds. These findings are linked with previous studies, which reported that TCP damaged the blood-testis barrier (Sertoli cells), elicited subsequent damage to germ cells, and caused germ cell loss (Chapin etal., 1991). There are increasing concerns about the potential toxic effects of bisphenol analogs such as BPS and BPAF (Liang etal., 2016). There is lack of toxicological data of BPS, and it is unclear whether BPS targets the Sertoli cells invivo animal. Thus, comparing toxicity data from various single cell culture models might allow us to evaluate cell-type specific responses in the testis, but might not correlate well with the invivo condition. The coculture model, which enables cell-cell communication among various cell types, should be a better system than any single cell type to screen testicular toxic chemicals.
Although our current invitro coculture provided valuable information on the potential toxicity of chemicals, it also demonstrated the limitations commonly shared by invitro cell based assays. For example, chemicals that require metabolic activation, such as TCP, BA, CYC, and ME, will not be predicted as reproductive toxicants using this model. ME has been reported to induce testicular atrophy and disrupt spermatogenesis via the metabolism of Ethylene glycol monomethyl ether (EGME) (Foster etal., 1983, 1984; Starek-Swiechowicz etal., 2015; van der Laan etal., 2012). It was found that ME undergoes metabolic activation to appropriate methoxyacetic acid (MAA) via EGME (Takei etal., 2010). MAA primarily affects tissues with rapidly dividing cells and high rates of energy metabolism in the testes, leading to apoptosis of primary spermatocytes. Spermatogenesis is a multi-step complex process. Our current invitro coculture model only captured an early stage of spermatogenesis and will probably not capture all the toxicologically vulnerable processes in the testis. Chemicals such as boric acid would likely cause male reproductive toxicity through nonmolecular interactions, and lead to damage of developing spermatids (Chapin and Ku, 1994; Jewell etal., 1998). Similarly, VIN treatment from gestation day 15 to postnatal week 4 at the concentration of 7.2 and 72 mg/kg/d has induced abnormal spermatozoa with nuclear and acrosomal defects (Veeramachaneni etal., 2006). Therefore, further efforts are needed in order to differentiate spermatogonia in the coculture model to produce postmeiotic spermatids as observed in explanted pieces of testis (Brannen etal., 2016; Sato etal., 2011). Thus, it is unlikely that any individual invitro model is sufficient as a final decision point for male reproductive toxicity; rather, a tiered approach using a series of models containing multiple endpoint analysis and concentration response curves is essential to building a robust screening platform to improve the prediction accuracy of invitro assays.
Animal studies could provide credible evidence to predict the likely effect of chemical exposure on human outcomes. However, the toxicity testing from the animal studies predicted toxicity in humans with only about 50%–70% accuracy (Chapin etal., 2013; Olson etal., 2000). Our current results represent an improvement over previous attempts to predict reproductive toxicity responses, but substantial improvement in prediction accuracy is still needed. The doses selected for these compounds were initially determined based on the literature and adjusted to ensure derivation of the IC values from the dose-response curves (Figure 6). The invitro assay must be optimized to have better relevance with invivo. For example, the concentration obtained from the invitro should reflect the plasma concentration attained at the lowest dose that produces toxicity in humans. In order to fully use these invitro data, we need to develop a physiological-based toxicokinetic model (PBTK) to extrapolate the invivo exposure as well as differences in the metabolism.
In summary, by utilizing testicular cell lines, we constructed a testicular cell coculture model, demonstrated the formation of a 3D cytoskeleton structure, and were able to distinguish testicular toxic compounds from nontoxic chemicals. Moreover, the toxicity in the coculture model at 48 h was found to have the highest correlation with rLOAEL invivo. The calculation of concordance, sensitivity, and specificity further supported the reliability of this model. Our results suggest that our invitro coculture model may be useful in screening testicular toxicants in a wide concentration range and prioritizing chemicals for further assessment. Furthermore, the exploitation of high-content imaging and quantitative techniques provides deep insight into the molecular and cellular mechanisms. In future research, we will include more compounds to further validate this invitro coculture model, and establish and examine more endpoints that correlate with different adverse outcomes of invivo reproductive toxicity.
ACKNOWLEDGMENTS
We thank Dr Marie-Claude Hofmann from UT MD Anderson Cancer Center for providing the C18-4 cells and the National Toxicology Program for providing testing compounds and Jake Maas for proofreading the final version.
FUNDING
This work was supported by the Centers for Disease Control and Prevention, the National Institute for Occupational Safety and Health (NIOSH) under award number R21 OH 010473; the National Institute of Environmental Health Sciences of the National Institutes of Health under award number R43ES027374; the Alternatives Research & Development Foundation (ARDF) and University of Georgia Startup Research funding.
REFERENCES
ThermoFisher. (

Comments