


Abstract
Metallothioneins (MTs) are proteins that protect cells from toxic agents such as heavy metal ions or reactive oxygen species. MT2A A-5G is a single nucleotide polymorphism in the promoter region of the MT2A gene, and the minor G allele results in lower transcription efficiency. We aimed to elucidate associations between MT2A A-5G and risks of 2 diseases potentially related to lowered MT expression, chronic kidney disease (CKD), and diabetes mellitus (DM), in a community-dwelling population. Study subjects were Nagoya city residents participating in the Japan Multi-Institutional Collaborative Cohort Study (J-MICC) Daiko Study, comprised 749 men and 2,025 women, aged 39–75 years. CKD (>stage 3) and DM were defined by standard guidelines. Associations were evaluated using logistic regression models with adjustments for age, sex and potential confounders in a cross-sectional study, and verified in a 5-year longitudinal study. Odds ratios (OR [95% confidence interval]) were calculated relative to the AA genotype. Serum MT (I + II), Cd and zinc levels were also determined by genotype. The OR of the GG genotype for CKD risk was 3.98 (1.50, 10.58) in the cross-sectional study and 5.17 (1.39, 19.28) in the longitudinal study. The OR of the GA genotype for DM was 1.86 (1.26, 2.75) in the cross-sectional study and 2.03 (1.19, 3.46) in the longitudinal study. MT2A A-5G may be associated with CKD and DM risks. This polymorphism is a promising target for evaluations of CKD and DM risks with possible involvement of low-dose chronic exposure to environmental pollutants.
INTRODUCTION
Metallothioneins (MTs) are intracellular cysteine-rich, metal-binding proteins. MTs exhibit high affinity with metal ions through cysteine residues, which enables them to regulate cellular zinc (Zn) level and to sequester heavy metals such as cadmium (Cd), thus suppressing toxicity. The abundant cysteine residues also enable MTs to act as an antioxidant (Ruttkay-Nedecky et al., 2013). The MT family consists of 4 isoforms, MT-I, -II, -III, and -IV. Of these, MT-I and -II are expressed ubiquitously throughout the body, and they have a protective function against cellular stress caused by heavy metal ions or reactive oxygen species (ROS) (Thirumoorthy et al., 2007). The transcription of MT (I + II) genes is induced by heavy metal exposure, cytokines or oxidative stress (Andrews, 2000). The dominantly expressed MT gene is the MT2A gene (Leierer et al., 2016; RIKEN, 2016).
MT2A A-5G (rs28366003) is a single nucleotide polymorphism (SNP) in the core promoter region of the MT2A gene (GeneID: 4502; Accession No. NM_005953). This SNP is located 5 base pairs (bp) upstream of the transcription initiation site, whereas the TATA sequence appears 20 bp upstream of the SNP. Its G allele leads to lower transcriptional factor affinity, resulting in reduced synthesis of MT in vitro (Kita et al., 2006). High accumulation of Cd in autopsied human renal cortex tissue has been reported, as well as high serum Cd, lead and Zn levels, for the GA and GG genotypes (Kayaalti et al., 2010, 2011).
Chronic kidney disease (CKD) is characterized by reduced glomerular filtration rate (GFR), accompanied with loss of low-molecular weight proteins through urinary excretion. End-stage CKD may require dialysis, which raises public health concerns over cost of medication and loss of quality of life. Recent studies also suggested the increased cardiovascular mortality in CKD patients. Major causes of CKD in the Japanese population are diabetes mellitus (DM) and hypertension (HT). However, glomerulonephritis and unknown causes share a large proportion (Jha et al., 2013). Prevalence of CKD raised age-dependently (1% at 20s to 34% at 80s) in an extensive survey in Japan (Imai et al., 2007). Accordingly, risk assessment and prevention strategy of CKD are urgent topics in public health.
Cd is a toxic heavy metal with a biological half-time of 17–30 years. Cd accumulates in the kidneys, causing renal tubular dysfunction with long-term exposure, causing CKD (IPCS, 1992). The major sources of Cd intake in nonpolluted areas are diet and smoking. In the Japanese general population, the estimated mean Cd intake through diet is 3.47 µg/kg body weight (BW)/week, with an additional 1–2 µg/pack of cigarettes (Food Safety Commission of Japan, 2009). Joint FAO/WHO Expert Committee on Food Additives (JECFA, 2010) proposed a monthly intake of 25 µg/kg BW. Although weekly intake of Cd can reach or exceed the above-stated provisional tolerable weekly intake, occasional high intake from daily diet is considered safe for the general population. However, individual differences in genetic vulnerability to Cd were not taken into account in this evaluation. Satarug et al., (2010) argued for further consideration of safety factors for subpopulations with increased susceptibility (Saturg et al., 2010). Considering the characteristics of MT2A A-5G, higher vulnerability to Cd toxicity in G allele carriers is presumable.
Other attributes of MTs are ROS quenching and Zn-regulation capability. Oxidative stress caused by ROS is claimed to play various roles in the onset of noncommunicable diseases, such as HT and DM (Bonomini et al., 2015). G allele carriers are presumably vulnerable to oxidative stress, due to their low MT induction efficiency. Indeed, a study reported high prevalence of HT and higher serum malondialdehyde (indicator of oxidative stress level) level in G allele carriers (Rattanatham et al., 2014). In addition to oxidative stress, altered Zn homeostasis is also related to the pathology of DM (Cruz et al., 2015; Rutter et al., 2015). Some studies have reported the involvement of polymorphisms in MT family genes in DM and its complications (Raudenska et al., 2014). Although the involvement of MT2A A-5G in the pathology of DM is presumable in this context, there is no report on its relation to DM.
In this study, we assessed associations between MT2A A-5G and the risks of CKD and DM in community dwellers living in a non-polluted area. This is the first study to report on associations between this polymorphism and CKD and DM in a general population. In addition, we report on a stratification of serum MT and Zn levels by genotype.
MATERIALS AND METHODS
Study population
The study design is depicted in Figure 1. Subjects of this study were participants in the second survey of the Japan Multi-Institutional Collaborative Cohort Study (J-MICC study) Daiko Study (Morita et al., 2011). Nagoya city residents aged 35–69 years had been recruited to the baseline survey (2008–10) via random posting approximately 5 years before the second survey (2014). Out of 5172 subjects enrolled in the baseline survey, 2809 participants (54.3%) participated in the second site survey. We included 2774 subjects who agreed to the use of their genotype data in this study. We assessed the risks of CKD and DM in a cross-sectional study in the initial analyses. We also conducted a further investigation in a 5-year longitudinal study with cohorts constituted of participants who did not meet the criteria for CKD or DM at the baseline survey, to confirm the findings of the cross-sectional study. Since we did not measure blood glucose (BG) or hemoglobin A1c (HbA1c) data at the baseline survey, we applied self-reported morbidity and/or the use of antidiabetic medicine as information for constituting cohorts. The aim of longitudinal studies is to exclude the bias derived from disease itself, such as changes in behaviors that might result from study subjects having information about their state of health. At the baseline and second surveys, participants donated blood samples for biochemical testing and DNA extraction after over-night fasting, and underwent blood pressure (BP) measurement. They also provided lifestyle and medical history data through self-administered questionnaires, which were checked by trained staff. All the participants gave written informed consent upon enrolment in the study and at the second survey. The study protocol was approved by the Ethics Committee of Nagoya University Graduate School of Medicine (Approval No. 618-18).
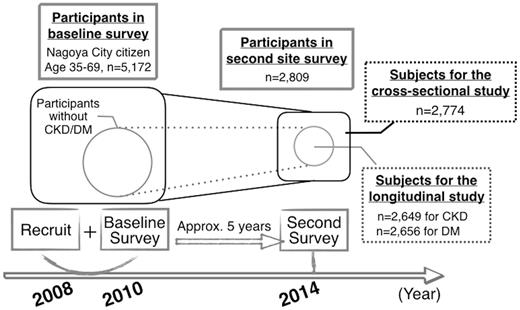
Study design of J-MICC Daiko Study and subjects for the present cross-sectional and longitudinal studies. CKD, chronic kidney disease; DM, diabetes mellitus; J-MICC, Japan Multi-Institutional Collaborative Cohort.
Blood samples and lifestyle data
Peripheral blood was collected after overnight fasting. Serum and plasma were promptly sent to a clinical laboratory (SRL, Hachioji, Japan), for the measurement of serum lipid profiles, serum creatinine (SCr), BG, and HbA1c. BP was measured twice in a seated position using an automated sphygmomanometer (HEM-1000, Omron, Kyoto, Japan). Participants were given a 5-min rest before the first measurement and another 2-min rest before the second. The mean of the 2 BP measurements was used for analysis. Lifestyle data were collected through a self-administered questionnaire. The questionnaire included items on smoking and alcohol drinking habits, diet, daily physical activity, leisure time activity, and medical history, as well as intake of rice, a major source of dietary Cd in Japan (Tsukahara et al., 2003). Total energy intake was estimated in kilocalories (kcal) per day using a food frequency questionnaire (Tokudome et al., 2005). Physical activity was estimated in metabolic equivalents (METs) per day from the frequency and duration of daily and leisure time activities.
Genotyping of MT2A A-5G
DNA was extracted from buffy coat using a BioRobot M48 (QIAGEN, Tokyo, Japan). MT2A A-5G was genotyped by the polymerase chain reaction with confronting 2-pair primers (PCR-CTPP) method (Hamajima et al., 2001). The reaction volume was 25 µl. The sequence of primers (Hokkaido System Science, Sapporo, Japan) were F1: 5′ -CGC-CTG-GAG-CCG-CAA-GTG-AC, R1: 5′ -TGG-AGG-AGG-CGT-GGT-GGA-GC, F2: 5′ -ACT-GCT-TGC-CGC-GCT-GCA, and R2: 5′ -ATC-CAT-GGC-GAG-CTG-AAG-A (underlined bases correspond to the alleles of MT2A A-5G polymorphism). The thermal profile for MT2A A-5G was: initial denaturation at 95 °C for 10 min, 30 reaction cycles (denaturation at 95°C, annealing at 67°C, and extension at 72°C, each for 1 min), and a final extension at 72°C for 5 min. The amplified product lengths were 100 bp for the A allele, 135 bp for the G allele, and 198 bp for the common band. Products were electrophoresed on 2.5% agarose gel containing ethidium bromide, and were visualized with UV light. A representative gel for the genotyping is shown in Figure 2.
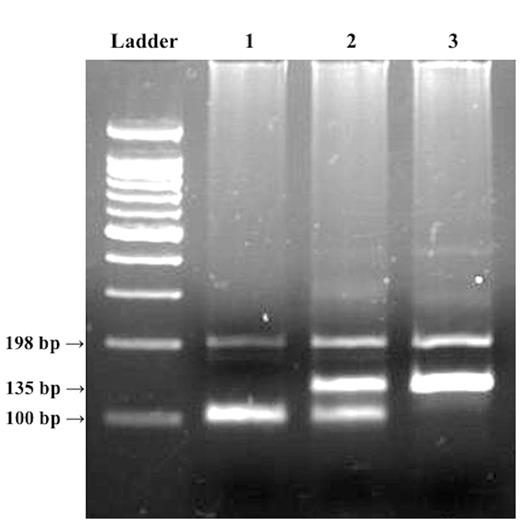
Representative gel for MT2A A-5G polymorphism. Ladder, 100-bp ladder; lane 1, AA genotype with 100-bp band; lane 2, GA genotype with 100- and 135-bp bands; lane 3, GG genotype with 135 bp band. The polymerase chain reaction was conducted with a PCR-CTPP method that discriminates genotypes by the product lengths of PCR using 2 sets of primer pairs. The product of primers F1 and R1 has a length of 135 bp, where the antisense sequence of the G allele is included in the 3′ end of the R1 primer. The product of primers F2 and R2 has a length of 100 bp, where the A allele is included in the 3′ end of the F2 primer. The band at 198 bp is a common band, which is the PCR product of F1 and R2 primers.
We validated the PCR-CTPP genotyping results with further genotyping using the Taqman SNP Genotyping Assay (Assay ID: C__60284591_10, Thermo Fisher Scientific, Waltham, Massachusetts). Of the samples analyzed with the PCR-CTPP method, all 21 samples yielding the GG genotype, and 37 and 36 randomly selected samples, respectively yielding the AA and GA genotypes, were submitted for the validation.
Enzyme-linked immunosorbent assay of serum MT (I + II) level
From those yielding AA, GA, and GG genotypes, 95, 69, and 15 serum samples were randomly selected, respectively. Serum MT (I + II) level was assayed by a competitive enzyme-linked immunosorbent assay (ELISA) using a Broad Check MT Kit (Frontier Institute, Ishikari, Japan), following the manufacturer’s instructions. We verified freeze-thaw and intra- and interassay stability. Freeze-thaw stability of serum samples was assessed from the change in concentration after 3 cycles of 30-min freezing at −40°C and thawing at room temperature (n = 4). For intra- and interassay stability, assessment was based on coefficients of variation (CV, %) for serum samples and 20 ng/ml standard solutions, respectively (n = 4 each).
Serum Zn assay
For serum Zn assay, 63, 63, and 15 serum samples were also randomly selected from those yielding AA, GA, and GG genotypes, respectively. Serum Zn levels were assayed with a 2-(5-bromo-2-pyridylazo)-5-(N-n-propyl-N-(3-sulfopropyl) amino) phenol (5-Br-PAPS) method using a Metallo assay Zn LS Kit (Metallogenics, Chiba, Japan). The Zn assay was also validated for the same parameters as the ELISA assay above using serum samples.
Serum Cd assay
Samples from 1915 subjects were sequentially selected for the serum Cd assay. Samples were incubated at 80°C in the presence of nitric acid for 48 h and cooled to room temperature and then incubated at 80°C in the presence of hydrogen peroxide for 3 h and cooled to room temperature. After appropriate dilution, Cd levels were measured with an inductively coupled plasma-mass spectrometer (ICP-MS: 7500cx, Agilent Technologies, Santa Clara, California) with a reaction cell without ArCl ion interference. The detailed assay method is described by Kato et al. (2013).
Assessment of outcomes and covariates
This criterion is based on the Japanese Society of Nephrology Evidence-based Practice Guideline for the Treatment of CKD (Sasaki, 2009), which is adapted from the Modification of Diet in Renal Disease GFR equation. DM was defined as either BG ≥ 126 mg/dl, HbA1c ≥ 6.5% or self-reported administration of antidiabetic medicine. These criteria are based on the Evidence-based Practice Guideline for the Treatment for Diabetes in Japan, 2013 (Tajima et al., 2015), which accords with the diagnostic criteria of the American Diabetes Association. As a covariate, HT was defined as systolic BP ≥140 mmHg, diastolic BP ≥90 mmHg or administration of antihypertensive medicines, based on the World Health Organization/International Society of Hypertension (WHO/ISH) hypertension guidelines (Whitworth and Chalmers, 2003). As another covariate, dyslipidemia was defined as either low-density lipoprotein cholesterol ≥ 140 mg/dl, high-density lipoprotein cholesterol <40 mg/dl, triglycerides ≥ 150 mg/dl or administration of antidyslipidemia medicines. These criteria are based on the Japan Atherosclerosis Society Guidelines for Prevention of Atherosclerotic Cardiovascular Diseases, 2012 (Teramoto et al., 2013).
Statistical analysis
For comparisons of basic characteristics between genotypes, we used the Fisher’s exact test for categorized variables, the Kruskal-Wallis test for age and one-way analysis of variance (ANOVA) for other continuous variables. We also used ANOVA for the comparison of serum MT and Zn levels between genotypes, and the Kruskal-Wallis test for Cd levels. The χ2 test was applied to check the accordance of MT2A A-5G genotype distribution with the Hardy-Weinberg equilibrium.
Odds ratios (ORs) and their 95% confidential intervals (CIs) were calculated using unconditional logistic regression models after adjustment for potential confounders for the assessment of associations between genotype and the risk of CKD or DM. The ORs of the GA and GG genotypes were calculated under the co-dominant model with the AA genotype as a reference. We also calculated ORs by the recessive model for CKD and by the dominant model for DM to further discuss the results obtained by the co-dominant model. The basic confounders included for the analysis were age, sex, body mass index (BMI) and smoking status (current, or former and never). Additionally, we included annual rice consumption (continuous), and presence of HT or DM (yes or no) for the cross-sectional analysis of CKD risk; eGFR at baseline (continuous) for the longitudinal analysis of CKD risk; and daily energy intake (continuous), drinking status (current, or former and never) and physical activity (continuous) for the cross-sectional and longitudinal analyses of DM.
Because the sample size was small for the GG genotype, we implemented a power analysis to examine whether our findings had arisen from chance due to the low frequency of the GG genotype. The distribution of MT2A A-5G in the Japanese JPT population reported in the (1000 genomes project 2015) was used for this analysis. The proportions of CKD and DM in each genotype group derived from our current study population. Powers for proportional differences with α = 0.05 were calculated for GG versus AA genotype for CKD, and GA versus AA genotype for DM.
The statistical analyses were conducted using RStudio version 0.98.1103 running on R version 3.1.2 (RStudio, Boston, Massachusetts). All P values were 2-sided and P < .05 was considered statistically significant.
RESULTS
Table 1 presents background profiles of the whole study population by MT2A A-5G genotype. Among 2774 subjects, the genotype frequencies were 81.8% (n = 2269), 17.4% (n = 484), and 0.8% (n = 21) for the AA, GA, and GG genotypes, respectively. The distribution was in accordance with the Hardy-Weinberg equilibrium (P = .44). The genotyping results obtained with the PCR-CTPP method were fully replicated with the Taqman assay. The gender distribution was similar for each genotype. Statistically significant differences between the genotypes were detected in the proportion of current smokers and the morbidities of DM and CKD.
Background Profiles of Subjects in the Cross-Sectional Study of CKD and Diabetes by MT2A A-5G Genotype
| MT2A A-5G genotype | ||||
|---|---|---|---|---|
| Total n = 2774 | AA | GA | GG | P |
| n = 2269 (81.8%) | n = 484 (17.4%) | n = 21 (0.8%) | ||
| Age (years) | 59.1 ± 9.8 | 59.0 ± 10.1 | 59.5 ± 8.0 | .999 |
| Men | 610 (26.8%) | 135 (27.9%) | 4 (19.0%) | .680 |
| BMI (kg/m2) | 21.7 ± 3.2 | 21.5 ± 2.9 | 21.4 ± 2.5 | .272 |
| Current smokers | 165 (7.3%) | 30 (6.2%) | 6 (28.6%) | .004 |
| Current alcohol drinkers | 1,199 (52.8%) | 254 (52.4%) | 10 (47.6%) | .883 |
| HT | 554 (24.4%) | 120 (24.8%) | 6 (28.6%) | .838 |
| Diabetes | 122 (5.4%) | 43 (8.9%) | 0 (0.0%) | .011 |
| dl)/dl) | 92.5 ± 13.1 | 93.8 ± 16.9 | 89.7 ± 7.3 | .093 |
| HbA1c (%) | 5.6 ± 0.5 | 5.6 ± 0.5 | 5.5 ± 0.2 | .516 |
| Medication | 83 (3.7%) | 31 (6.4%) | 0 (0.0%) | .025 |
| CKD | 346 (15.2%) | 64 (13.2%) | 7 (33.3%) | .039 |
| eGFR min/min/1.73 m2) | 72.1 ± 12.6 | 72.7 ± 13.0 | 68.1 ± 11.3 | .205 |
| Dyslipidemia | 1,102 (48.6%) | 223 (46.1%) | 11 (52.3%) | .554 |
| Rice intake year)/year) | 46.6 ± 22.2 | 46.4 ± 22.2 | 43.8 ± 13.4 | .855 |
| Energy intake (kcal/day) | 1,565 ± 340 | 1,544 ± 303 | 1,486 ± 246 | .274 |
| Physical activity (METs/d) | 37.4 ± 9.1 | 37.5 ± 9.0 | 41.4 ± 10.7 | .136 |
DM, diabetes mellitus; CKD, chronic kidney disease; eGFR, estimated glomerular filtration rate; METs, metabolic equivalents.
± values indicate mean ± SD. P values < .05 are bolded.
Serum MT (I + II) levels are shown in Figure 3. The intra- and interassay CVs for serum MT measurement were 7.0 and 14.0%, respectively, and the change in concentration after 3 freeze-thaw cycles was −2.9%. There was no significant difference in crude serum MT concentration between the genotypes. Since MT is a low molecular-weight protein that can pass through the glomerulus, we further examined the correlations of serum MT level with age, SCr, and eGFR. Expressing MT level in units of ‘mg MT/g Cr’ or simply as the ng/ml value divided by eGFR might better reflect the difference in MT (I + II) production or any deviation after adjustment for renal function. However, no difference was observed between the genotypes using either unit of expression (data not shown).
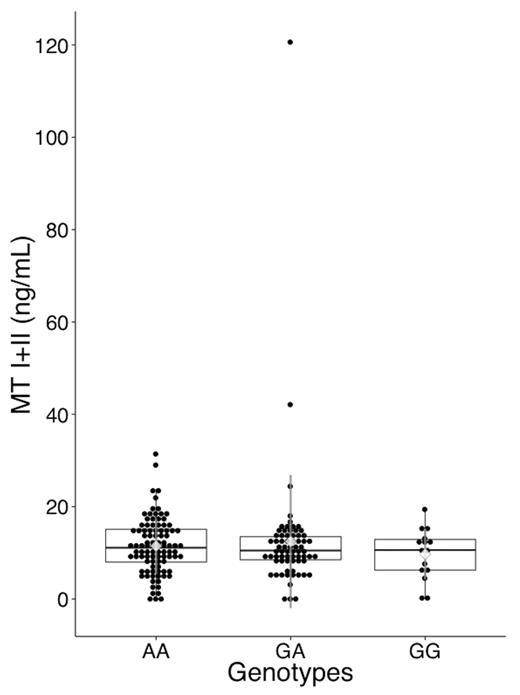
Serum MT I + II level by MT2A A-5G genotype. Serum MT (I+II) level was measured with a competitive ELISA. MT levels are plotted around the median as box plots, where the dots represent individual data. Diamonds and the whiskers represents the mean and SD of MT levels. Whiskers of the box plots extend to 1.5× interquartile range, where the values exceeding or falling below this level are marked as outliers. The overall median was 10.9 ng/ml, and mean ± SD was 11.7 ± 10.1 ng/ml. The numbers of samples was 95, 69, and 15 for AA, GA, and GG genotypes, respectively. There was no significant difference in serum MT levels among the genotypes (analysis of variance: P = .61).
Serum Zn levels are given in Figure 4. The intra- and interassay stability values for the Zn assay were both 3.5%, and the change in concentration after 3 freeze-thaw cycles was <0.001%. There was no difference in serum Zn level between the genotypes.

Serum Zn level by MT2A A-5G genotype. Serum Zn level was measured by 2-(5-bromo-2-pyridylazo)-5-(N-n-propyl-N-(3-sulfopropyl) amino) phenol (5-Br-PAPS) method. Zn levels are plotted around the median as box plots, where the dots represent individual data. The diamond symbol represents the mean, and the whiskers represent SD. The whiskers of the box plots extend to 1.5× interquartile range, where the values exceeding or falling below this level are marked as outliers. The overall median was 87.2 µg/dl, and mean ± SD was 88.3 ± 10.8 µg/dl. The numbers of samples were 63, 63, and 15 for the AA, GA, and GG genotypes, respectively. There was no difference in serum Zn level between the genotypes (analysis of variance, P = .95).
Log-transformed serum Cd levels are given in Figure 5. Samples yielding zero (0) values were excluded from the log transformation. Cd levels were low in the community dweller population; overall mean was 0.04, and 0 ppb or otherwise below the detection limit for 1493 samples (78.0%). Serum Cd levels did not significantly differ between the genotypes (P = .304 and .973 in analysis of overall samples and non-zero samples, respectively).
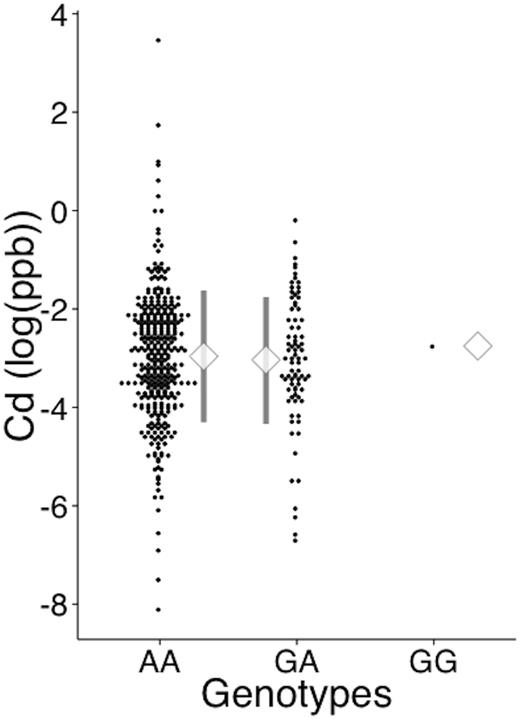
Serum cadmium level by MT2A A-5G genotype. Serum Cd level was measured by inductively coupled plasma mass spectrometry. The dots represent individual data of log-transformed Cd levels. The diamond symbol represents the mean, and the whiskers represent SD. The numbers of samples with a value >0 were 340, 81, and 1 for the AA, GA, and GG genotypes, respectively. The number of samples yielding 0 values were 1561, 640, and 14 for the AA, GA, and GG genotypes, respectively. The proportion of samples with values >0 did not differ between genotypes (Fisher’s exact test, P = .309).
Table 2 presents background profiles of subjects for the cohort study. The associations of MT2A with CKD risk are summarized in Tables 3 and 4. For the cross-sectional study (Table 3), the GG genotype showed a significant association with CKD with and without the adjustments for general and possible confounders. The OR (95% CI) of the GG genotype derived from the full model was 3.98 (1.50, 10.58). Analysis for the longitudinal study provided similar associations as those for the cross-sectional study (Table 4). In addition to the explanatory variables used in the full model of the cross-sectional study, we further adjusted for eGFR at the baseline survey to elucidate independent effect of MT2A A-5G on the incidence of CKD. The OR of the GG genotype rose to 5.17 (1.39, 19.28) after adjustment for eGFR at the baseline. The GA genotype showed no association with CKD during the study. The higher proportion of smokers in the GG genotype group may have served as a confounder since smoking-related Cd intake and oxidative stress may have affected the prevalence of CKD. Thus, we have analyzed the full model in the cross-sectional study with and without the smoking status, and the OR of CKD for the GG genotype was not largely altered (3.98 [95% CI, 1.50, 10.58] with smoking habits and 3.28 [1.24, 8.63] without smoking habits). This indicates that the GG genotype still exerts its effect independent of smoking status. We also conducted analyses with recessive models and obtained similar findings (data not shown).
Background Profiles in Subjects for Longitudinal Studies of CKD and Diabetes by MT2A A-5G Genotype
| Cohort | MT2A A-5G Genotype | P | |||
|---|---|---|---|---|---|
| AA | GA | GG | |||
| For CKD study (n = 2649) | Number of subjects | 2168 (81.8%) | 462 (17.4%) | 19 (0.7%) | — |
| CKD at baseline survey (samples excluded) | 101 | 21 | 2 | .412 | |
| Age (years) | 58.7 ± 9.8 | 58.6 ± 10.0 | 59.2 ± 7.5 | .995 | |
| Men | 571 (26.3%) | 126 (27.3%) | 3 (12.8%) | .586 | |
| BMI (kg/m2) | 21.7 ± 3.2 | 21.4 ± 2.9 | 21.3 ± 2.6 | .316 | |
| Current smokers | 162 (7.5%) | 28 (6.1%) | 6 (31.6%) | .002 | |
| Current alcohol drinkers | 1145 (52.8%) | 241 (52.2%) | 8 (42.1%) | .632 | |
| HT | 516 (23.8%) | 113 (24.5%) | 5 (26.3%) | .875 | |
| CKD | 251 (11.5%) | 44 (9.5%) | 5 (26.3%) | .054 | |
| ΔeGFR (ml/min/1.73 m2) | −10.5 ± 8.8 | −10.1 ± 8.6 | −14.5 ± 8.4 | .088 | |
| For DM study (n = 2656) | Number of subjects | 2178 (82.0%) | 457 (17.2%) | 21 (0.8%) | |
| DM at baseline survey (samples excluded) | 88 (91a) | 26 (27a) | 0 (0) | .227 | |
| Age (years) | 58.8 ± 9.8 | 58.6 ± 10.1 | 59.5 ± 8.0 | .964 | |
| Men | 554 (25.4%) | 121 (26.5%) | 4 (19.0%) | .748 | |
| BMI (kg/m2) | 21.6 ± 3.1 | 21.4 ± 2.9 | 21.4 ± 2.5 | .342 | |
| Current smokers | 152 (7.0%) | 29 (6.3%) | 6 (28.6%) | .005 | |
| Current alcohol drinkers | 1146 (52.6%) | 243 (53.2%) | 10 (47.6%) | .868 | |
| Energy intake (kcal/d) | 2,362 ± 927 | 2,305 ± 941 | 2,089 ± 715 | .211 | |
| Physical activity (METs/d) | 37.4 ± 9.0 | 37.5 ± 8.9 | 41.4 ± 10.7 | .130 | |
| Diabetes | 55 (2.5%) | 21 (4.6%) | 0 | .058 | |
DM, diabetes mellitus; CKD, chronic kidney disease; eGFR, estimated glomerular filtration rate; METs, metabolic equivalents.
± values indicate mean ± SD. P values < .05 are bolded.
aNumbers including participants without available data on DM at baseline survey.
Cross-Sectional Study of CKD: ORs of MT2A A-5G Genotypes for the Risk of CKD Derived from Logistic Regression Analysis
| MT2A A-5G Genotype | Confounders | |||||||||
|---|---|---|---|---|---|---|---|---|---|---|
| AA (n = 2269) | GA (n = 484) | GG (n = 21) | Age (/year) | Sex (women) | BMI (/kg·m−2) | Smoking Status (Current) | HT | Diabetes | Rice Consumption (/kg·year−1) | |
| Crude modela | 1 (Reference) | 0.85 (0.64, 1.12) | 2.78(1.11, 6.93) | |||||||
| Basic adjustment modelb | 1 (Reference) | 0.83 (0.61, 1.11) | 3.34(1.27, 8.77) | 1.09(1.08, 1.11) | 0.77(0.61, 0.98) | 1.06(1.03, 1.10) | ||||
| Full modelc | 1 (Reference) | 0.82 (0.61, 1.11) | 3.98(1.50, 10.58) | 1.09 (1.07, 1.10) | 0.68(0.52, 0.89) | 1.05(1.01, 1.09) | 0.49(0.29, 0.83) | 1.33(1.05, 1.71) | 0.97 (0.65, 1.46) | 0.995 (0.990, 1.001) |
BMI, body mass index.
Table items show ORs and their 95% CIs (95% CI, lower, upper) for each genotype of MT2A A-5G and confounders. ORs are calculated from coefficients of logistic regression models. P values < .05 are shown in bold text and P < .01 are underlined.
aCrude effect of the polymorphism without any confounders.
bAdjusted for basic confounders: age, sex and BMI.
cAdjusted for all possible confounders in addition to the basic adjustment model: Smoking status, prevalence of HT, prevalence of diabetes and rice consumption as a dietary Cd source.
Longitudinal Study of CKD: ORs of MT2A A-5G Genotypes for the Risk of CKD Derived from Logistic Regression Analysis
| MT2A A-5G Genotype | Confounders | |||||||||||
|---|---|---|---|---|---|---|---|---|---|---|---|---|
| AA (n = 2168) | GA (n = 462) | GG (n = 19) | Age (/year) | Sex (women) | BMI (/kg· m−2) | eGFR at baseline survey(/ml· min−1· 1.73 m−2) | Smoking status (current) | HT | Diabetes | Rice consumption (/kg· year−1) | ||
| Crude modela | 1 (Reference) | 0.80 (0.57, 1.13) | 2.73 (0.97, 7.64) | |||||||||
| Basic adjustment modelb | 1 (Reference) | 0.79 (0.56, 1.11) | 3.19 (1.10, 9.25) | 1.08 (1.07, 1.10) | 0.77 (0.59, 1.02) | 1.06 (1.02, 1.10) | ||||||
| Full modelc | 1 (Reference) | 0.78 (0.52, 1.17) | 5.17 (1.39, 19.28) | 1.03 (1.01, 1.05) | 0.85 (0.58, 1.23) | 1.05 (1.00, 1.11) | 0.82 (0.80, 0.84) | 0.62 (0.31, 1.24) | 1.43 (1.03, 1.98) | 1.35 (0.76, 2.41) | 0.995 (0.989, 1.003) | |
BMI, body mass index; eGFR, estimated glomerular filtration rate.
Table items show ORsand their 95% CIs (lower, upper) for each genotype of MT2A A-5G and confounders. ORs are calculated from coefficients of logistic regression models. P values < .05 are shown in bold text and P < .01 are underlined.
aCrude effect of the polymorphism without any confounders.
bAdjusted for basic confounders: age, sex, and BMI.
cAdjusted for all possible confounders in addition to the basic adjustment model: smoking status, prevalence of HT, prevalence of diabetes and rice consumption as dietary Cd source. In addition to the data from the cross-sectional study, the eGFR at the baseline survey is added to the full model to adjust for the differences in renal function prior to the study.
The associations of MT2A with DM risk are presented in Tables 5 and 6. Significantly higher ORs were observed for the GA genotype with and without the adjustments for confounding factors in both the cross-sectional study (Table 5) and the longitudinal study (Table 6). The OR (95% CI) of the GA genotype derived from the full model was 1.86 (1.26, 2.75) for the cross-sectional study and 2.06 (1.21, 3.50) for the longitudinal study. No DM case was identified in the GG group. We also conducted analyses with dominant models and confirmed that the findings agreed with those from the by-genotype model (data not shown).
Cross-Sectional Study of Diabetes: ORs of MT2A A-5G Genotypes for the Risk of Diabetes Derived from Logistic Regression Analysis
| MT2A A-5G Genotype | Confounders | |||||||||
|---|---|---|---|---|---|---|---|---|---|---|
| AA (n = 2269) | GA (n = 484) | GG (n = 21) | Age (/year) | Sex (women) | BMI (/kg·m−2) | Smoking status (current) | Alcohol intake (current) | Energy intake (/kcal· day−1) | Physical activity (/METs·day−1) | |
| Crude modela | 1 (Reference) | 1.72(1.19, 2.47) | – | |||||||
| Basic adjustment modelb | 1 (Reference) | 1.91(1.30, 2.80) | – | 1.09(1.06, 1.11) | 0.51(0.37, 0.72) | 1.25(1.20, 1.31) | ||||
| Full modelc | 1 (Reference) | 1.86(1.26, 2.75) | – | 1.09(1.07, 1.12) | 0.48(0.32, 0.73) | 1.26(1.20, 1.32) | 2.29(1.34, 3.91) | 0.60(0.41, 0.88) | 1.000 (0.999, 1.000) | 0.999 (0.982, 1.018) |
BMI, body mass index; eGFR, estimated glomerular filtration rate; METs, metabolic equivalents.
Table items show ORs and their 95% CIs (lower, upper) for each genotype of MT2A A-5G and confounders. ORs are calculated from coefficients of logistic regression models. P values < .05 are shown in bold text and P < .01 are underlined. Because there was no DM case in the GG genotype group, the OR for GG could not be calculated and left blank.
aCrude effect of the polymorphism without any confounders.
bAdjusted for basic confounders: age, sex, and BMI.
cAdjusted for all possible confounders in addition to the basic adjustment model: smoking status, alcohol drinking habit, daily energy intake, and physical activity.
Longitudinal Study of Diabetes: ORs of MT2A A-5G Genotypes for the Risk of Diabetes Derived from Logistic Regression Analysis
| MT2A A-5G Genotype | Confounders | |||||||||
|---|---|---|---|---|---|---|---|---|---|---|
| AA (n = 2178) | GA (n = 457) | GG (n = 21) | Age (/year) | Sex (women) | BMI (/kg· m−2) | Smoking status (current) | Alcohol intake (current) | Energy intake (/kcal· day−1) | Physical activity (/METs·day−1) | |
| Crude modela | 1 (Reference) | 1.86(1.11, 3.11) | — | |||||||
| Basic adjustment modelb | 1 (Reference) | 2.08(1.22, 3.53) | — | 1.06(1.03, 1.09) | 0.77 (0.48, 1.25) | 1.28(1.20, 3.53) | ||||
| Full modelc | 1 (Reference) | 2.06(1.21, 3.50) | — | 1.06(1.03, 1.09) | 0.71 (0.40, 1.29) | 1.27(1.20, 1.36) | 1.96 (0.89, 4.28) | 0.55(0.32, 0.95) | 1.000 0.999, 1.000) | 0.985 (0.959, 1.012) |
BMI, body mass index; eGFR, estimated glomerular filtration rate; METs, metabolic equivalents.
Table items show ORs and their 95% CIs (lower, upper) for each genotype of MT2A A-5G and confounders. ORs are calculated from coefficients of logistic regression models. P values < .05 are shown in bold text and P < .01 are underlined. Since there was no DM case in GG genotype group, OR for GG could not be calculated and left blank.
aCrude effect of the polymorphism without any confounders.
bAdjusted for basic confounders: age, sex, and BMI.
cAdjusted for all possible confounders in addition to the basic adjustment model: smoking status, alcohol drinking habit, daily energy intake, and physical activity.
DISCUSSION
In our study of the effect of MT2A A-5G polymorphism in a general Japanese population, we observed significant associations with CKD and DM. Risks correlating with the polymorphism for both diseases were found in the cross-sectional study, and these results were confirmed in the longitudinal study; the GG genotype was identified as a risk factor for CKD and the GA genotype was identified as a risk factor for DM. The ORs for MT2A A-5G genotypes were statistically significant independently of age, sex and other potential confounders. This suggests that the vulnerability to these diseases due to MT2A A-5G polymorphism is independent of their major risk factors.
We hypothesized associations of MT2A A-5G with serum MT or Zn level, as MTs are major intracellular Zn carriers, but found no correlation. However, there is no other report on serum MT level by MT2A A-5G genotype with a sizable number of samples from carriers of the GG genotype in a general population, making this data worth reporting. In contrast to Kayaalti et al. (2011), we failed to detect changes in serum Zn level for the GA or GG genotype in our population. The serum Cd levels in our study in a non-polluted area showed no association with MT2A A-5G genotypes. Although the small sample size of the GG genotype for measurements in this study does not allow a firm conclusion, we consider that MT2A A-5G polymorphism likely affects intracellular homeostasis rather than contributing to excretion of related molecules outside the cells.
The major causes of CKD are HT, DM, and chronic glomerulonephrosis (CGN) (Jha et al., 2013). In our study, the effects of DM and HT were adjusted for as confounding factors and could be partially excluded considering the causal risk of CKD. Furthermore, our data showed no associations between MT2A A-5G and HT, in contrast to the findings reported by Rattanatham et al. (2014). After adjustments for HT and DM, we assumed that the ORs of MT2A A-5G could mainly be accounted for by non-secondary renal dysfunction otherwise diagnosed as CGN. The causes of CGN are complex and the mechanisms are still not fully known.
Vulnerability to low-dosage Cd can be hypothesized as a mechanical possibility for higher CKD risks in G allele carriers (Satarug et al., 2010). Cd causes renal tubular impairment through dose-dependent p53 accumulation, resulting in apoptosis of renal proximal tubule cells (Tokumoto et al., 2011). Kita et al. (2006) reported an in vitro effect of MT2A A-5G on the transcription efficiency of the promoter region of the MT2A gene in transfected cultured cells. The transcription efficiency of the promoter region of MT2A genes with the G allele was significantly reduced when cells were exposed to Zn and Cd, indicating that G allele carriers have a lowered response to accumulated intracellular Zn and Cd. Kayaalti et al. (2010) reported increased accumulation of Cd in renal tissue of G allele carriers. In this context, it is reasonable to infer higher Cd level and lower Cd sequestration efficiency of MTs in the renal tissue of G allele carriers, especially of those with the GG genotype. Also, some studies have reported the association of low-level Cd exposure with decreased eGFR, supporting the hypothesis that trace exposure to Cd may contribute to the development of CKD (Åkesson et al., 2014; Ferraro et al., 2010). There are also studies suggesting that oxidative stress is also involved in the onset of CKD (Tamay-Cach et al., 2015).
The possible causes of DM associated with MT2A A-5G include imbalances in Zn homeostasis and oxidative stress. Zn plays important roles in both insulin secretion (Rutter et al., 2015) and insulin resistance (Cruz et al., 2015). As MTs play a major role in maintaining intracellular Zn homeostasis, MT2A A-5G may possibly be linked to that homeostatic imbalance, which results in a higher risk of DM. Oxidative stress is also a factor that is related to insulin resistance (Bonomini et al., 2015).
Although the mechanism of the involvement of MTs in the onset of DM is still not revealed completely, there are several studies reporting associations of polymorphisms in MT genes with DM. Such polymorphisms can act as a genetic factor that increases the susceptibility to environmental factor involved in the onset of DM. Table 7 summarizes the currently available data regarding polymorphisms in MT genes and DM. Even though they obtained results with the opposite direction of the risk, Giacconi et al. and Kozarova et al. demonstrated associations of MT2A A–209G polymorphism (rs1610216) with DM. MT2A A–209G is also a SNP in the 5′ untranslated region of MT2A gene. MT2A A-5G and MT2A A–209G are in weak linkage disequilibrium (LD) in the Japanese-in-Tokyo population of the 1000 Genomes Project (r2 = 0.10, D′ = 1) (1000 Genomes Project, 2015). MT2A A-5G is in strong LD with 5 SNPs (r2 ≥ 0.9). However, rs8058803 is an intron of an uncharacterized gene whereas the others are in intergenic regions. In this context, MT2A A-5G may behave independently. MT2A A-5G itself can be possibly responsible for our current results.
Summary of Published Studies Reporting Associations of MT Gene Polymorphisms with Diabetes
| Study Population (Number of Subjects; Mean Age ± SD)a | Ethnicity | Outcome | Target SNPb | Attributed Gene | Risk (OR and 95% CI) | Notes | |
|---|---|---|---|---|---|---|---|
| Giacconi et al. (2005) |
| Italian from Region Marche | Type 2 DM | rs1610216 (−209 A/G MT2A) | MT2A | 2.62 (1.40, 4.89)c |
|
| Giacconi et al. (2008) |
| Italian | Type 2 DM | rs11640851 (+647 A/C MT1A) | MT1A | 1.37 (1.03, 1.82)d1.54 (1.17, 2.04)e |
|
| rs8052394 (+1245 A/G MT1A) | NS | ||||||
| Yang et al. (2008) |
| Chinese Han descents | Type 2 DM (and DM complications) | rs8052394 | MT1A | 1.30 (1.01, 1.67)f | Higher risk for: Obesity in rs8052394 risk allele holder, polyuria in rs708274 risk allele holders, hyperlipidemia in rs5802334 risk allele holder and rs10636 risk genotype, increased serum triglyceride for rs964372, diabetic neuropathy for rs11076161 risk genotype and rs10636. |
| rs11076161 | MT1B | NS | |||||
| rs8052334 | NS | ||||||
| rs964372 | NS | ||||||
| rs7191779 | NS | ||||||
| rs708274 | MT1E | NS | |||||
| rs10636 | MT2A | NS | |||||
| Kozarova et al. (2011) |
| Bulgarian | Type 1 and 2 DM | rs8052394 | MT1A | NS |
|
| rs1610216 | MT2A | 7.56 (0.92, 62.20)g | |||||
| Ganasyam et al. (2012) |
| Indian from Hyderabad | Type 2 DM | rs8052394 | MT1A | NS | Estrogen receptor-α polymorphism and lipid profile were also analyzed (NS). |
| rs11076161 | MT1B | NS | |||||
| Our study |
| Japanese | Type 1 and 2 DM | rs28366003 (MT2A A-5G) | MT2A | 1.86 (1.26, 2.75)h | Higher risk of CKD in GG genotype. Serum MT, Cd and Zn levels were also analyzed (NS). |
OR, odds ratio; CI, confidence interval; NS, not significant; DM, diabetes mellitus; CVD, cardiovascular disease; CAD, coronary artery disease; CKD, chronic kidney disease; MT, metallothionein.
aAges are in form of years ± SD.
bSNP specification mentioned in a referenced report is in a parenthesis at the place first stated.
cAA genotype versus GA genotype.
dRisk for non-CVD patients, C allele versus A allele by Fisher’s exact test.
eRisk for CVD patients, C allele versus A allele by Fisher’s exact test.
fAA genotype versus combined GA and GG genotypes.
gCombined GA and GG genotypes versus AA genotype.
hGA genotype versus AA genotype.
Our study has several strengths and limitations. The first strength is the large population. Despite the G allele of MT2A A-5G having a unique characteristic, its frequency is relatively low, and is reported to vary between ethnicities as follows: 1.1% in African Americans, 6.4% in Caucasians (McElroy et al., 2010), 6.8% in Turkish people (Kayaalti et al., 2010), 9.2% in Japanese people (Kita et al., 2006), and others available in a database (1000 Genomes Project, 2015). The corresponding frequency in this study was 9.5%. However, carriers of the minor allele account for a considerable proportion of the population, raising concerns in terms of public health. A sufficiently large study population is required to detect effects of MT2A A-5G, especially those characteristics of the GG genotype. Our research provides accurate data on genotype frequency from over 2000 subjects, whereas the previous research involved 100–200 subjects. As a result of this first strength, we could also compare serum MT and Zn levels with each genotype using a sufficiently large sample size. The second strength of this study is that it is the first study to report the associations of MT2A A-5G with CKD and DM. Despite a number of studies reporting effects of MT polymorphisms on DM, no study has been conducted for MT2A A-5G. Considering that MT2A A-5G has a unique character in affecting transcription efficacy in vitro (Kita et al., 2006), this polymorphism is a worthwhile target for large-scale epidemiological studies. The third strength is that the present study population consisted of community dwellers in Nagoya city, where excess exposure to Cd and other pollutants is of little concern. The first limitation is the small sample size for the GG genotype, due to the low frequency of G allele. Although our study population is large enough to include over 20 participants with the GG genotype, the sample size for this genotype remained small. To assess the sample size, we implemented a power analysis. Statistical powers (1-β) for CKD and DM were 0.870 and 0.558, respectively. The power was reasonable for CKD and moderate for DM. We consider that the moderate statistical power of DM is possibly due to the low prevalence of DM. Despite the moderate statistical power in DM, our study has the largest sample size compared with previous studies, and we consider that our report poses insight to the scientific knowledge of MTs. The second limitation concerns the interpretation of the results for the risk of DM for the GA genotype. We identified no DM cases with the GG genotype, and so we could detect this risk only for the GA genotype. The overall prevalence of DM was 5.9%, which means that only one case could have been expected in the GG genotype group. The third limitation is the nonspecificity of the ELISA kit. The kit we used for this analysis was one of the few commercially available and reliable ELISA kits for serum MT (I + II). However, differentiation between MT-I and -II is not possible in analyses with this kit, which may have resulted in a nonspecific assay. We carried out measurements assuming that MT-II is more dominantly expressed than MT-I. We suggest that the negative result can be explained by either serum MT (I + II) being balanced regardless of MT2A A-5G, or the lack of a polymorphism effect on extracellular MT excretion.
Our study demonstrated independent associations of MT2A A-5G polymorphism with the risks of CKD and DM in a large Japanese population. Although the mechanism and the involvement of Cd cannot be deduced from our current results, this study raised the possibility of high vulnerability to Cd and ROS among the carriers of the MT2A A-5G risk allele. MT2A A-5G may serve as a useful predictor of DM and CKD. Further epidemiological studies on polymorphisms of MT genes are desirable to elucidate the roles of MTs in the onset of both CKD and DM.
ACKNOWLEDGMENTS
We thank Dr Mei Chee Tai for informative comments on the ELISA method, and Ms Yoko Mitsuda, Ms Keiko Shibata and all other colleagues who provided technical and administrative support.
FUNDING
This study was supported by Grants-in-Aid for Scientific Research on Priority Areas (17015018) and Innovative Areas (221S0001) and by Grants-in-Aid for Scientific Research (A) (15H02588) from the Japanese Ministry of Education, Culture, Sports, Science and Technology, and also by the Mitsubishi Foundation (27310).
REFERENCES

Comments