


Abstract
Cycling can lead to microtrauma due to increased perineal pressure, possibly contributing to genital numbness and sexual dysfunction in female cyclists.
We aim to explore the associations between cycling characteristics, female genital numbness, and female sexual dysfunction.
We conducted a cross-sectional study on female cyclists and sexual wellness. Participants were recruited through Facebook® advertisements and online outreach at athletic clubs. Participants were asked about their cycling characteristics, genital numbness, and female sexual function using the Female Sexual Function Index (FSFI). Univariate and multivariable linear and logistic regression were used to assess risk factors for genital numbness and the association between genital numbness and the FSFI.
The outcome measures were cycling characteristics, questions regarding numbness (intensity, duration, location), and the FSFI score.
Eight-hundred and seventy-five women were included in the study. Total lifetime miles cycled, biking duration, frequency, distance, speed, and biking surface were not significantly associated with genital numbness. Higher handlebar height was associated with less numbness. The prevalence of sexual dysfunction in the cohort was 52%. Genital numbness was significantly associated with sexual dysfunction (OR: 1.43, 95% CI: 1.05 – 1.95). Sub-group analysis for location of numbness demonstrated significant increase in risk for sexual dysfunction in cyclists who described numbness aro‘und the perineum (OR: 2.72, 95% CI: 1.05 – 7.02) and the vulva (OR: 1.55, 95% CI: 1.13 – 2.13). There was also a significant increase in the risk of sexual dysfunction in cyclists who reported a longer duration of numbness (OR: 6.58, 95% CI: 2.27 – 19.07).
Genital numbness is common in women who cycle and is associated with increased risk of FSD and lower average sexual response scores on FSFI.
Introduction
Bicycles were popularized and made widely accessible in the 1890s.1 During this period, the bicycle's accessibility to women raised novel social issues. Attacks against women cyclists were politicized and falsely medicalized, arguing that the angle of the saddle taught women and girls about masturbation and threatened sexual purity.2 Today, the attitudes on cycling have drastically changed. Cycling provides an effective form of exercise and is a convenient and environmentally friendly mode of transportation for nearly 100 million individuals in the U.S.3 Though cycling has many benefits, it can also cause perineal trauma, resulting in genital numbness and perineal pain.4,5 Genital numbness is caused by nerve compression and is the earliest and most common symptom of cycling-related perineal trauma. Up to 34-58% of cyclists report genital numbness.4,6–8 Our group previously examined genital numbness in male cyclists and found no association with erectile dysfunction. It is hypothesized to be an early predictor of female sexual dysfunction (FSD), however, the current literature on genital numbness and FSD in cyclists are primarily observational studies and case series.4,9
Despite the high prevalence of cycling related genital numbness and its hypothesized association with FSD, cycling specific risk factors for genital numbness and its downstream impact in women are understudied. Sexual problems and sexual distress in itself is highly prevalent, impacting around 12% of women in the U.S. according to a large national survey.9 Identifying risk factors of genital numbness and FSD in women cyclists may elucidate risk factors for FSD. A recent study using a validated questionnaire to assess FSD found that female cyclists with genital numbness had higher odds of reporting FSD.7 Based on our previous work in males, we hypothesize that while genital numbness is common among female cyclists, it is not associated with a clinically or statistically significant difference in Female Sexual Function Inventory (FSFI) score, a commonly used scale to study FSD. We aim to explore the associations between cycling characteristics, female genital numbness, and FSD. Our findings will provide insight into the impact of cycling characteristics and medical co-morbidities on FSD and potentially inform safer cycling practices in women.
Methods
Dataset, Study Design, And Study Population
This study is a secondary analysis of an international cross-sectional study of sexual and urinary wellness in members of sport clubs over the age of 18 who participated in cycling, swimming or running. Details of the recruitment methods and cycling questionnaire were previously published in a manuscript that analyzed only the male study participants.10 Study enrollment occurred from April 2016 to December 2016. Members of sport clubs were recruited through social media advertisements such as Facebook and targeted outreach to sports clubs in the U.S., Canada, United Kingdom, Australia, and New Zealand. For this manuscript, female members of sports clubs over the age of 18 and participated cycling were included in the analyses. Male members of sport clubs were excluded. This study was approved by the Institutional Review Board at the University of California, San Francisco (IRB #15-18032). [Institution blinded for review process.]
Survey Measures
The survey was developed by the authors and included demographic variables such as age, weight, height, race/ethnicity, and marital status and some specific medical history questions, in addition to our, main outcomes that are further described below. The survey was pretested in a pilot sample of 10 volunteers for readability before recruitment.
Baseline demographic data including age, race, marital status, weight, and height was gathered. Past medical history, history of urinary tract infections, smoking, and alcohol use history were also collected. Participants were queried about the presence and frequency of genital numbness (When do you have numbness? can choose multiple answers: always, randomly, after intercourse, and after biking). Genital numbness was self-reported and details of numbness was assessed including location (Please specify where? can choose multiple answers: perineum, vulva, buttocks, and other), level of numbness on a scale of 1 to 10 (What number best describes your average level of numbness? 1-3: mild numbness, 4-7: moderate numbness, and 8-10: severe numbness), and duration (How long does the numbness last?: <60s, 1-59 minutes, 1-24 hours, and >24 hours).
Cycling characteristics including cycling duration (For how long you have been riding bicycles?: 6 months or less, 6 months – 1 year, 2 - 5 years, 5 -10 years, more than 10 years), frequency (How often do you ride bicycles?: Daily, 3-5 times a week, twice a week, once a week, monthly, yearly, every 5 years), longest distance ever cycled (What is the longest distance you have biked in a single day in the past 6 months?: Less than 1 mile 1-5 miles, 5-10 miles, 10-25 miles, 25-50 miles, more than 50 miles), average speed (What speed do you usually ride?: less than 5 miles per hour, 5 miles per hour, 6-10 miles per hour, 11-15 miles per hour, 16-20 miles per hour, more than 20 miles per hour, don't know), frequency of padded shorts usage (Do you wear padded cycling shorts when you ride?: always, mostly, sometimes, rarely, never), seat angle (What type of seat is the closest to your bicycle seat? Images provided to participants: wide, unpadded seat; long, narrow, with minimal padding seat; narrow, medium padded seat; wide, heavily padded seat; wide, well-padded cruiser seat; nose-less seat; dual pad seat), bicycle type (What type of bike do you ride the most ?: mountain bike, road bike, hybrid bike, electric bike, folding bike, recumbent bike, BMX bike, other, don't know), handlebar height (How do you usually fix the handlebar height?: lower than saddle, higher or even with saddle), and type of surface most frequently cycled on was gathered (What surface do you usually ride on?: urban streets, rural streets, off road, stationary bike). Lifetime miles cycled was calculated by multiplying the average daily cycling mileage by total lifetime cycling duration.
Primary Outcome
The primary outcome of the study was to examine the associations between medical and cycling-related risk factors for genital numbness in female cyclists.
Secondary Outcome
The secondary outcome was to evaluate the association of genital numbness with increased risk of reporting FSD. The Female Sexual Function Index (FSFI) was used to assess sexual function. The questionnaire is a validated instrument including subdomains of desire, subjective arousal, lubrication, orgasm, satisfaction, and pain. FSD was dichotomized and FSFI < 26 was classified as FSD, which is a predefined cutoff.
Statistical Analysis
Pearson Chi-squared test was used for categorical variables and t-test was used for continuous variables. Univariate and multivariable linear and logistic regression were used to evaluate factors associate with genital numbness and female sexual dysfunction. The predictor variables for multivariable analyses were chosen a priori. A p value ≤ 0.05 was defined as statistically significant. STATA version 14 (College Station, TX, U.S.) was used for statistical analyses.
Results
Study Population
Eight-hundred and seventy-five female cyclists met study inclusion criteria. Study participant population and demographic information are summarized in Table 1 . The study population was predominantly Caucasian (No Numbness: 87%, Numbness: 88%, p = 0.4), had minimal comorbidities (hypertension: 5.5% vs 2.9%, type 2 diabetes: 0.6% vs 0.8%, and ischemic heart disease: 0.2% vs 0.3%) and equally distributed across age groups (18-30: 32%, 31-50: 21%, 51-65: 24%, >65: 22%, percentages are the sum of both No Numbness and Numbness groups). Almost half of study participants self-reported genital numbness (n = 381, 44%). A majority of these participants reported mild numbness (n = 202, 53%), numbness located around the vulva (n = 316, 70%), and numbness that lasted for 1-59 minutes (n= 273, 72%). Statistically significant differences between those who experienced numbness and those who did not experience numbness were detected among the different age groups (p <0.001). Participants between ages 18-30 and 31-50 represented the highest proportion of cyclists who reported numbness (35% and 27%, respectively). Cyclists who reported genital numbness were also more likely to report having a prior UTI compared to participants who did not report numbness (63% vs 56%, p = 0.037).
Participant demographics
| No numbness, n (%) | Numbness, n (%) | P value | |
|---|---|---|---|
| n = 494 | n = 381 | ||
| Age, n (%) | |||
| 18-30 | 150 (30) | 132 (35) | 0.001 |
| 31-50 | 85 (17) | 102 (27) | |
| 51-65 | 121 (25) | 91 (24) | |
| >65 | 138 (28) | 56 (15) | |
| Race | |||
| White | 431 (87) | 336 (88) | 0.4 |
| Hispanic/Latino | 19 (3.9) | 20 (5.3) | |
| Asian | 17 (3.4) | 12 (3.2) | |
| Black/African American | 5 (1.0) | 5 (1.3) | |
| American Indian/Alaskan | 0 (0.0) | 1 (0.3) | |
| Native Hawaiian | 3 (0.6) | 0 (0.0) | |
| Other (inc, more than 1 race) | 19 (3.9) | 7 (1.8) | |
| Marital Status | |||
| Single | 150 (30) | 128 (34) | 0.07 |
| Married | 193 (39) | 131 (34) | |
| Divorced/Separated | 60 (12) | 31 (8.1) | |
| Widowed | 6 (1.2) | 5 (1.3) | |
| Partnered | 85 (17) | 86 (23) | |
| Health Characteristics | |||
| BMI, mean (SD) | 24.1 (4.1) | 24.4 (4.1) | |
| Hypertension | 27 (5.5) | 11 (2.9) | 0.06 |
| Diabetes Mellitus | 3 (0.6) | 3 (0.8) | 0.75 |
| Ischemic Heart Disease | 1 (0.2) | 1 (0.3) | 0.85 |
| Urinary Tract Infection | 278 (56) | 241 (63) | 0.04 |
| Smoking | 15 (3.0) | 13 (3.4) | 0.75 |
| Alcohol | 344 (70) | 287 (75) | 0.06 |
| Level of Numbness | |||
| Mild (1-3) | – | 202 (53) | |
| Moderate (4-7) | – | 165 (43) | |
| Severe (8-10) | – | 14 (3.7) | |
| Duration of Numbness | |||
| <60 seconds | – | 44 (12) | |
| 1-59 minutes | – | 273 (72) | |
| 1-24 hours | – | 58 (15) | |
| >24 hours | – | 6 (1.6) | |
| Location of Numbness | |||
| Perineum | – | 28 (6.2) | |
| Vulva | – | 316 (70) | |
| Buttocks | – | 56 (12) | |
| Other | – | 52 (11) |
SD = standard deviation.
Statistically significant P values are in bold.
Table 2 summarizes the cycling characteristics of the study population. The majority of study participants cycled for >10 years (n = 314, 36%) with a cycling frequency of 3-5 times per week (n= 493, 56%). There were no statistically significant differences in cycling duration and frequency between participants who did and did not report genital numbness. However, participants who reported genital numbness reported riding longer distances (>50 miles: 66% vs 60%, p = 0.015) and higher speeds (16-20 mph: 41% vs. 32%, >20 mph: 6.3% vs. 3.5%, p = 0.005) compared to participants who did not report genital numbness. Participants who reported genital numbness also reported greater frequency of wearing padded shorts while cycling (Always: 64% vs. 63%, Mostly: 16% vs. 13%, p = 0.001), primarily utilized road bikes (76% vs. 65%, p = 0.005), and used a handlebar height that was lower than the saddle (50% vs. 40%, p = 0.004) compared to those who did not report numbness.
Cycling characteristics
| No numbness, n (%) | Numbness, n (%) | P value | |
|---|---|---|---|
| n = 494 | n = 381 | ||
| Cycling duration | 8 (1.6) | 9 (2.4) | 0.54 |
| <6 months | |||
| 6 months to 1 year | 36 (7.3) | 28 (7.4) | |
| 2 to 5 years | 156 (32) | 135 (35) | |
| 5 to 10 years | 105 (21) | 83 (22) | |
| > 10 years | 188 (38) | 126 (33) | |
| Cycling frequency | |||
| Daily | 99 (20) | 88 (23) | 0.29 |
| 3-5 times/week | 276 (56) | 217 (57) | |
| 2 times/week | 81 (16) | 60 (16) | |
| 1 time/week | 33 (6.7) | 13 (3.4) | |
| Monthly | 4 (0.8) | 3 (0.8) | |
| Yearly | 1 (0.2) | 0 (0) | |
| Longest distance | |||
| <1 mile | 0 (0) | 1 (0.3) | 0.015 |
| 1-5 miles | 6 (1.2) | 0 (0) | |
| 5-10 miles | 14 (2.9) | 3 (0.8) | |
| 10-25 miles | 58 (12) | 33 (8.7) | |
| 25-50 miles | 120 (25) | 93 (24) | |
| >50 miles | 291 (60) | 251 (66) | |
| Speed | |||
| ≤5 mph | 3 (0.6) | 4 (1.1) | 0.005 |
| 6-10mph | 64 (13) | 35 (9.2) | |
| 11-15 mph | 235 (48) | 152 (40) | |
| 16-20 mph | 155 (32) | 157 (41) | |
| >20 mph | 17 (3.5) | 24 (6.3) | |
| Don't Know | 18 (3.7) | 8 (2.1) | |
| Freq. of padded shorts use | |||
| Always | 311 (63) | 243 (64) | 0.001 |
| Mostly | 65 (13) | 62 (16) | 65 (13) |
| Sometimes | 34 (6.9) | 44 (12) | 34 (6.9) |
| Rarely | 15 (3.1) | 10 (2.6) | 15 (3.1) |
| Never | 66 (13) | 20 (5.3) | 66 (13) |
| Type of seats | |||
| Wide, unpadded | 40 (8.1) | 20 (5.3) | 0.06 |
| Long, narrow | 218 (44) | 193 (51) | 218 (44) |
| Narrow, medium padded | 196 (40) | 146 (39) | 196 (40) |
| Wide, well padded | 12 (2.4) | 4 (1.1) | 12 (2.4) |
| Noseless | 2 (0.4) | 5 (1.3) | 2 (0.4) |
| Dual pad | 3 (0.6) | 3 (0.8) | 3 (0.6) |
| Seat angle | |||
| Nose down | 56 (11) | 47 (12) | 0.63 |
| Level | 407 (82) | 303 (80) | 407 (82) |
| Nose up | 14 (2.8) | 16 (4.2) | 14 (2.8) |
| Don't know | 17 (3.4) | 15 (3.9) | 17 (3.4) |
| Bicycle type | |||
| Mountain bike | 87 (18) | 41 (11) | 0.005 |
| Road bike | 322 (65) | 290 (76) | |
| Hybrid bike | 59 (12) | 28 (7.4) | |
| Other (i.e. electric, folding, recumbent) | 25 (5.1) | 22 (5.8) | |
| Don't know | 1 (0.2) | 0 (0) | |
| How do you usually fix the handlebar height? | |||
| Lower than saddle | 198 (40) | 190 (50) | 0.004 |
| Higher or even than saddle | 292 (60) | 189 (50) | |
| Surface | |||
| Urban streets | 233 (47) | 190 (50) | 0.1 |
| Rural streets | 186 (38) | 152 (40) | |
| Off-road | 65 (13) | 37 (9.7) | |
| Stationary bike | 10 (2.0) | 2 (0.5) |
Statistically significant P values are in bold.
Primary Outcome
Risk Factors For Numbness
Unadjusted and adjusted (age, BMI, diabetes mellitus, hypertension, myocardial infarction and UTI) multivariable regression models were performed to examine cycling-related and health risk factors for genital numbness (Table 3 ). We found that older age was associated with lower odds of genital numbness (OR: 0.88, 95% CI: 0.83 – 0.93), while increasing BMI and history of UTI were associated with higher odds of genital numbness (OR: 1.04, 95% CI: 1.01 – 1.08 and OR: 1.48, 95% CI: 1.17 – 1.96, respectively). There was no association between genital numbness and lifetime miles cycled (OR: 1.00, 95% CI: 0.99 – 1.00).
Univariate and multivariate linear regression analyses for factors associated with genital numbness among female cyclists
| Unadjusted OR (95% CI) | P value | Adjusted OR (95% CI) | P value | |
|---|---|---|---|---|
| Age* | 0.89 (0.85 – 0.94) | 0.001 | 0.88 (0.83 - 0.93) | 0.001 |
| Urinary tract infection* | 1.34 (1.02 – 1.76) | 0.037 | 1.48 (1.17 - 1.96) | 0.007 |
| Body mass index* | 1.02 (0.99 – 1.05) | 0.25 | 1.04 (1.01 - 1.08) | 0.02 |
| Diabetes mellitus* | 0.77 (0.15 – 3.84) | 0.75 | 0.72 (0.14 - 3.62) | 0.69 |
| Hypertension* | 1.94 (0.95 – 3.97) | 0.07 | 1.85 (0.87 - 3.91) | 0.11 |
| Total lifetime miles* | 1.00 (1.00 – 1.01) | 0.76 | 1.00 (0.99 - 1.00) | 0.76 |
| Cycling characteristics† | ||||
| Biking duration | ||||
| <6 months | (Reference) | (Reference) | ||
| 6 months - 1 year | 0.69 (0.24 – 2.02) | 0.50 | 0.74 (0.25 – 2.19) | 0.59 |
| 2 - 5 years | 0.77 (0.29 – 2.05) | 0.60 | 0.84 (0.31 – 2.27) | 0.74 |
| 5 - 10 years | 0.70 (0.26 – 1.90) | 0.49 | 0.80 (0.29 – 2.19) | 0.67 |
| >10 years | 0.59 (0.22 – 1.58) | 0.30 | 0.74 (0.28 – 2.01) | 0.56 |
| Biking frequency | ||||
| Daily | (Reference) | (Reference) | ||
| 3-5 times/week | 0.88 (0.63 – 1.24) | 0.48 | 1.02 (0.72 – 1.45) | 0.90 |
| 2 times/week | 0.83 (0.54 – 1.29) | 0.42 | 0.95 (0.60 – 1.51) | 0.84 |
| Once/ week | 0.44 (0.22 – 0.90) | 0.023 | 0.50 (0.24 – 1.02) | 0.06 |
| Monthly | 0.84 (0.18 – 3.87) | 0.83 | 0.92 (0.20 – 4.25) | 0.91 |
| Biking distance | ||||
| <1 mile | (Reference) | (Reference) | ||
| 1-5 miles | 0.99 (0.41 – 2.41) | 0.98 | 0.72 (0.29 – 1.78) | 0.47 |
| 5-10 miles | 1.27 (0.58 – 2.81) | 0.54 | 1.01 (0.45 – 2.25) | 0.99 |
| 10-25 miles | 1.43 (0.69 – 3.01) | 0.34 | 1.33 (0.63 – 2.82) | 0.46 |
| 25-50 miles | 1.54 (0.74 – 3.23) | 0.24 | 1.52 (0.72 -3.21) | 0.27 |
| Biking speed | ||||
| <5 mph | (Reference) | (Reference) | ||
| 5 mph | 9.00 (0.37 – 220.9) | 0.18 | 15.19 (0.58 – 397.74) | 0.10 |
| 6-10 mph | 1.64 (0.16 – 16.37) | 0.67 | 2.19 (0.21 – 22.87) | 0.51 |
| 11-15 mph | 1.94 (0.20 – 18.83) | 0.57 | 2.82 (0.28 – 28.70) | 0.38 |
| 16-20 mph | 3.04 (0.31 – 29.53) | 0.34 | 4.59 (0.45 – 46.74) | 0.20 |
| >20 mph | 4.24 (0.41 – 44.27) | 0.23 | 6.62 (0.60 – 72.68) | 0.12 |
| Don't know | 1.33 (0.12 – 14.87) | 0.82 | 1.87 (0.16 – 21.80) | 0.62 |
| Time standing | ||||
| 0% | (Reference) | (Reference) | ||
| 5% | 0.96 (0.69 – 1.35) | 0.82 | 0.92 (0.65 – 1.30) | 0.64 |
| 10% | 0.77 (0.50 – 1.19) | 0.24 | 0.72 (0.46 – 1.13) | 0.16 |
| 20% | 0.63 (0.32 – 1.23) | 0.18 | 0.57 (0.29 – 1.14) | 0.11 |
| >20% | 0.59 (0.23 – 1.53) | 0.28 | 0.53 (0.20 – 1.38) | 0.20 |
| Non-padded shorts | ||||
| Always | (Reference) | (Reference) | ||
| Mostly | 1.22 (0.83 – 1.80) | 0.31 | 1.08 (0.72 – 1.60) | 0.72 |
| Sometimes | 1.66 (1.03 – 2.67) | 0.039 | 1.34 (0.82 – 2.19) | 0.24 |
| Rarely | 0.85 (0.38 – 1.93) | 0.70 | 0.73 (0.32 – 1.68) | 0.46 |
| Never | 0.38 (0.23 – 0.65) | 0.001 | 0.30 (0.17 – 0.51) | 0.001 |
| Handlebar height | ||||
| Lower | (Reference) | (Reference) | ||
| Higher or even with saddle | 0.67 (0.51 – 0.88) | 0.004 | 0.67 (0.51 – 0.90) | 0.007 |
| Street surface | ||||
| Urban streets | (Reference) | (Reference) | ||
| Rural streets | 1.00 (0.75 – 1.34) | 0.99 | 1.10 (0.82 – 1.48) | 0.52 |
| Off road | 0.69 (0.44 – 1.07) | 0.01 | 0.70 (0.45 – 1.10) | 0.12 |
| Stationary bike | 0.24 (0.05 – 1.13) | 0.07 | 0.23 (0.05 – 1.08) | 0.06 |
OR = odds ratio; CI = confidence interval.
Statistically significant P values are in bold.
Adjusted for age, BMI, history of urinary tract infection, diabetes mellitus, hypertension, and total life-time miles (calculated by average daily cycling x cycling days/week x cycling years).
Adjusted for age and BMI.
Regarding cycling characteristics and association with genital numbness, biking duration, frequency, distance, speed, and biking surface were not significantly associated with the presence of genital numbness. Cyclists who never wore padded shorts had lower odds of genital numbness (OR: 0.30, 95% CI: 0.17 – 0.51). Higher handlebar height was associated with lower odds of numbness (OR: 0.67, 95% CI: 0.51 – 0.90).
Secondary Outcome
Genital Numbness And Sexual Function
The mean FSFI score for participants with numbness was 24.9 (SD = 4.6), while those without numbness had a mean FSFI of 26.0 (SD = 4.3). The prevalence of sexual dysfunction in the cohort was 51.6%. There was no significant difference in FSFI between those who did or did not report numbness after stratifying by age group (Figure 1 ). The univariate and multivariable analyses of the association between genital numbness and FSD are summarized in Table 4 . FSFI was lower by 0.92 (p = 0.006) for every one-unit increase in numbness. By subdomain of the FSFI, arousal scores were lower by 0.28 (p = 0.001), lubrication was lower by 0.26 (p = 0.002), and satisfaction was lower by 0.27 (p =0.005) for every one-unit increase in numbness. However, there was an improvement in the pain sub-domain by 0.20 (p = 0.017) for every one-unit increase in numbness. There were no statistically significant changes in β-coefficients for the orgasm and desire sub-domains in relation to changes in numbness.
Univariate and multivariate analyses for genital numbness association with female sexual dysfunction among female cyclists
| Unadjusted | Adjusted* | |||
|---|---|---|---|---|
| Coeff. Mean (95% CI) | P-value | Coef. Mean (95% CI) | P-value | |
| Total FSFI | −1.08 (−1.72 – −0.45) | 0.001 | −0.92 (−1.58 – −0.27) | 0.006 |
| Desire | −0.18 (−0.37 – 0.00) | 0.052 | −0.16 (−0.35 – 0.02) | 0.08 |
| Arousal | 0.33 (−0.49 – −0.16) | 0.001 | −0.28 (−0.45 – −0.12) | 0.001 |
| Lubrication | −0.29 (−0.45 – −0.13) | 0.001 | −0.26 (−0.42 – −0.09) | 0.002 |
| Orgasm | −0.29 (−0.49 – −0.10) | 0.004 | −0.15 (−0.35 – 0.05) | 0.15 |
| Satisfaction | −0.31 (−0.49 – −0.13) | 0.001 | −0.27 (−0.46 – −0.09) | 0.005 |
| Pain | 0.32 (0.16 – 0.49) | 0.001 | 0.20 (0.04 – 0.37) | 0.02 |
| OR (95% CI) | P-value | OR (95% CI) | P-value | |
| Sexual dysfunction (FSFI <26) | ||||
| No numbness | (Reference) | (Reference) | ||
| Numbness | 1.52 (1.13 − 2.03) | 0.005 | 1.43 (1.05 – 1.95) | 0.02 |
| Location | ||||
| Perineum | 2.12 (0.87 – 5.12) | 0.1 | 2.72 (1.05 – 7.02) | 0.039 |
| Vagina | 1.66 (1.23 – 2.23) | 0.001 | 1.55 (1.13 – 2.13) | 0.007 |
| Buttocks | 0.86 (0.47 – 1.57) | 0.62 | 0.64 (0.34 – 1.21) | 0.18 |
| Duration of numbness | ||||
| <1 Min | (Reference) | (Reference) | ||
| 1−59 Min | 3.11 (1.41 – 6.87) | 0.005 | 4.51 (1.80 – 11.30) | 0.001 |
| 1−24 hours | 4.91 (1.91 – 12.65) | 0.001 | 6.58 (2.27 – 19.07) | 0.001 |
| >24 hours | − | − | ||
| Intensity of numbness | ||||
| Mild (1‐3) | (Reference) | (Reference) | ||
| Moderate (4–7) | 1.53 (0.98 – 2.39) | 0.06 | 1.49 (0.96 – 2.34) | 0.08 |
| Severe (8–10) | 2.27 (0.73 – 7.06) | 0.16 | 2.52 (0.79 – 8.01) | 0.12 |
OR = odds ratio; CI = confidence interval.
Statistically significant P values are in bold.
Adjusted for age, BMI, race, marital status, smoking, diabetes mellitus, hypertension, ischemic heart disease, and urinary symptoms.
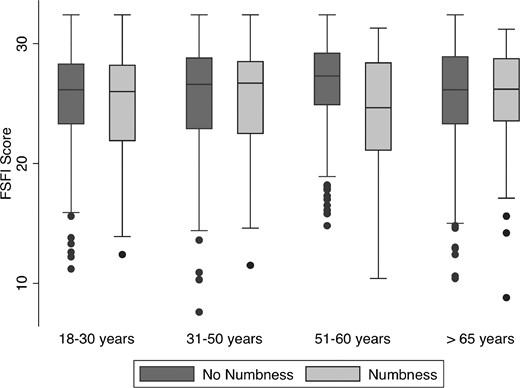
Female sexual function inventory between cyclists who did or did not report numbness, stratified by age group. There was no significant difference in FSFI between cyclists who did or did not report numbness after stratifying by age group.
Genital numbness was found to be associated with higher odds of FSD (OR: 1.43, 95% CI: 1.05 – 1.95). Sub-group analysis for location of numbness and sexual dysfunction demonstrated non-significant associations for numbness of the buttocks, but a significant increase in sexual dysfunction in cyclists who described numbness around the perineum (OR: 2.72, 95% CI: 1.05 – 7.02). and vulva (OR: 1.55, 95% CI: 1.13 – 2.13). Additional sub-group analysis for duration of numbness revealed a significant increase in the risk of sexual dysfunction in cyclists who reported a longer duration of numbness (OR: 6.58, 95% CI: 2.27 – 19.07) compared to people who reported numbness for less than 1 hour (OR: 4.51, 95% CI: 1.80 – 11.30). Intensity of numbness was not associated with increased risk of sexual dysfunction (OR: 2.52, 95% CI: 0.79 – 8.01).
Discussion
In this study, we found that almost half of female cyclists in our study population self-reported genital numbness. Those with genital numbness had slightly more risk of FSD and lower average sexual responses, particularly worse arousal and lubrication, than cyclists without numbness. Numbness was associated with younger age, lower handlebar height and higher BMI. We also found that genital numbness was not associated with cycling frequency, duration, distance, or speed. The greatest associations between numbness and FSD occurred in those who reported localization of numbness to the perineum or numbness that lasted for a longer duration. Our findings support an association between genital numbness and cycling. Collectively, these findings suggest that genital numbness among cyclists is associated with a modest increase in risk of sexual dysfunction in women, specifically, lower average sexual responses in the FSFI.
We observed an increased risk of genital numbness in women who cycle with higher BMI and those who reported a previous history of UTI. In a study by Greenberg et al., an association between BMI and genital numbness was not observed. Studies examining saddle pressures have demonstrated that body mass is directly proportional to the pressure exerted on the cyclist,11 which may contribute to greater nerve compression and genital numbness. Our study is the first on female cyclists to highlight an association between health-related factors such as BMI and genital numbness.
Our finding that a higher handlebar height was associated with lower risk of reporting genital numbness is supported in the literature. A study on male cyclists also found that higher handlebar height was associated with cycling-related genital numbness.5 An experimental study using biometric sensors for perineal pressure and vibratory sensory thresholds after laboratory exposure to cycling found that lower handlebar positions lead to increased perineal saddle pressure and decreased genital sensation in female cyclists. The authors postulated that lower handlebars require the cyclist to lean more anterior, leading to a shift in more weight on the perineum compressing the pudendal neurovascular structures which explains lower numbness with higher handlebar height.4,12 Gender-related differences in pressure loading on bicycle saddle have also been highlighted by previous studies.13 Centers of pressure for men were more anterior compared to women, but women demonstrated greater changes in anterior pressure and force when switching from higher handle position to lower handle position.14 Thus, women may be more at risk of experiencing genital numbness when riding with a lower handle positions due to the increased perineal pressure exerted by the bicycle. These studies highlight gender-related discrepancies in pressure profiles, which may be a result of differences in pelvic geometry and cycling style.11 To our knowledge, this is the first observational cohort study to report a significant association between handlebar height and genital numbness in female cyclists. Taken together with studies on the biophysical impact of handlebar height and perineal saddle pressure, our findings suggest that cyclists should opt to use bicycles with higher handlebar heights to minimize perineal pressure and genital numbness [inc 13].
Our finding that female cyclists who reported never wearing padded shorts also demonstrated lower odds of reporting genital numbness is corroborated in the literature. This association has been previously documented in women and men who cycle.7,10 Although it is impossible to determine causation with a cross-sectional design, the association can be due to reverse causation as cyclists who experience genital numbness may be more inclined to wear protective padded shorts to mitigate symptoms.
The current study participants reported genital numbness that was not associated with cycling duration, frequency, speed or distance. Greenberg et al. recently reported a study assessing genital pain and numbness and sexual dysfunction in a cohort of female cyclists.7 Similar to our study, Greenberg et al. found no association between cycling duration, distance, and frequency and genital numbness. However, the authors did find that women who cycled an average of over 10 hours a week were more likely to report genital pain. A study that stratified their female cycling population by low- and high-intensity cycling and utilized non-cyclist athletes as a reference found higher odds of reporting genital numbness in both cycling groups. The study also found greater odds of reporting genital numbness in the high-intensity group in relation to the low-intensity group (adjusted OR of 9.1 vs. 6.5). High intensity was defined as participants who cycled for more than 2 years, more than 3 times a week, and an average of 25 miles or more daily.6 These findings differ from the results published on male cyclists which report an increase in genital numbness in those who reported cycling more frequently, riding longer distances, and greater lifetime years of cycling.5 It is important to note the differences in cycling characteristics and anatomical effects of biking between women and men who cycle. Heesch et al. studied cycling characteristics and motivations in men and women to find that men reported a higher cycling frequency compared to women (27.5% vs 16.3% reported cycling 5-7 days/week).15 Men also reported a greater total years of cycling compared to women (47.0% vs 30.2% reported over 10 years of cycling).15 The associations between cycling frequency, duration, and total years and female genital numbness requires further study and more nuanced survey questions such as fitment process, gynecological history, and other exercise exposures.
Although the mean FSFI scores between those who did and did not report numbness did not differ greatly (26.0 ± 4.3 vs. 24.9 ± 4.6), we found that women cyclists who reported numbness had modestly higher odds of reporting lower average FSFI scores. This suggests that the clinical significance between our numbness and no numbness groups are not wide. The association was more significant in women with numbness of the perineum compared to the vulva. Moreover, we found that longer duration of numbness was associated with increased odds of reporting lower FSFI scores. In contrast, Greenberg et al. found clitoral numbness to be associated with increased risk of FSD and reported no association between time to relief of numbness and risk of FSD. Our study did not ask specifically about clitoral numbness. Our study found that genital numbness was associated with a decrease in FSD subdomain scores across the arousal, lubrication, and satisfaction subdomains of FSFI, whereas Greenberg et al. found a decrease in arousal, orgasm and satisfaction.7 We also found that cyclists who reported numbness also reported improved sexual pain scores. It is possible that we were able to detect these associations due to our larger sample size. The results of our study, in conjunction with that of Greenberg et al., emphasize that female cyclists are at greater risk of reporting genital numbness and symptoms suggestive of FSD and that genital numbness may be a predictive indicator of developing symptoms of FSD. Prospective cohort studies are required in order to better determine the causal relationship between cycling, genital numbness, and sexual dysfunction.
Studies on male cyclists did not find an association between genital numbness and worse sexual function.5,10 Although there was no association between numbness and erectile function in men, experimental studies on penile blood flow and cyclist positioning found that cycling in the upright position led to reduced penile perfusion. This suggests that there is a physiological compromise in blood supply that may be having a subclinical effect in men, but may prove to be a risk factor in the future.16,17 The same may hold true for our female study population. Additional experimental and functional studies on female cyclists should be performed to delineate the physiological impact on cycling-related trauma in women. This discrepancy in findings between men and women may also partly be due to the inherent differences in the survey tools used to assess sexual function. The studies on male cyclists utilized standardized questionnaires (Sexual Health Inventory for Men, International Index of Erectile Function) that assessed erectile dysfunction. Whereas, questionnaires used in studies for female cyclists approached sexual function multi-dimensionally (Female Sexual Function Index), including physiological and psychological metrics.6,7 These multi-dimensional questionnaires may be more sensitive in detecting the impact of cycling-related microtrauma on sexual dysfunction. Homologous female genital engorgement was not captured by these questionnaires, making it more difficult to compare the results to men. Our study and Greenberg et al. found that the sub-domains of arousal, lubrication, satisfaction and orgasm were most significantly impacted in female cyclists who experienced genital numbness. Vaginal lubrication involves a combination of transudation of fluid from vaginal epithelium and secretions from the Bartholin glands, vestibular glands, and uterus.18 Genital arousal and lubrication are highly influenced by mechanical stimulation of the genitals which are sensed by the free nerve endings and encapsulated receptors in the glans clitoris and surrounding areas around the genitals.19 Afferent sensory stimuli from peripheral nerves are conveyed to the spinal cord via the pudendal nerve which is most vulnerable to cycling-related microtrauma.20,21
Our study is not without limitations. FSD is a complex diagnosis that encompasses but is not limited to desire, arousal, orgasm, and sexual-related pain. Despite its common utilization in studies on sexual dysfunction in women, FSFI and the cut-off of <26 to suggest FSD cannot be used to diagnose FSD. Our study questionnaire is limited in that it did not ask participants about known risk factors for FSD such as poor mental health, stress, genitourinary problems, relationship dissatisfaction, and history of sexual abuse.22 Additional studies on cycling should include non-binary characterizations of gender and childbearing and gynecological history.23 Our questionnaire is also limited in that it did not ask participants about their cycling fitment process (professional fitment process, usage of female saddle and frame design, etc). Including more nuanced details on cycling fitment may help further stratify cyclists who are most at risk for genital numbness. This study is a cross-sectional study, making it difficult to assess causal relationships. The study design is also susceptible to survivorship bias as cyclists who have FSD may no longer cycle. Thus, the genital numbness and FSD reported in our study are likely underestimated. In addition, our assessment of genital numbness is limited to self-reporting, making it susceptible to reporting bias. Finally, we did not include stationary bicycles in our study. As they are becoming more commonplace, stationary bicycles should be further investigated to ensure that they are safely designed and utilized. The strengths of our study include our large sample size and even age distribution. It is the largest study to date on genital numbness and FSD among female cyclists. We utilized a validated questionnaire to characterize FSD in our study population.
Conclusions
Cycling duration and length in years were not associated with genital numbness in female cyclists, but genital numbness was associated with increased risk of FSD symptoms as described by modestly lower FSFI subdomain scores. More studies should be conducted to examine the differential biomechanical and cycling characteristics to further elucidate the mechanisms of neurovascular damage between genders and design bicycles that can better protect against sequelae of bicycle-related perineal trauma. Additional prospective cohort studies are also necessary to uncover the temporal and causal nature of the reported associations. This research is vital to informing cycling manufacturers in designing safer seats and protective equipment for female cyclists.
Statement Of Authorship
Hansen Lui: Conceptualization, Methodology, Investigation, Writing – Original Draft, Writing – Review & Editing; Nnenaya Mmonu: Investigation, Writing – Original Draft, Writing – Review & Editing, Supervision; Mohannad A. Awad: Conceptualization, Methodology, Investigation, Writing – Original Draft, Writing – Review & Editing; Nikan K. Namiri: Investigation, Writing – Review & Editing; Micha Y. Zheng: Investigation, Writing – Review & Editing; Gregory M. Amend: Writing – Review & Editing, Supervision; Benjamin N. Breyer: Conceptualization, Methodology, Writing – Original Draft, Writing – Review & Editing, Funding Acquisition, Resources, Supervision
Funding Supported by the Kevan and Anita Del Grande, Russell and Sara Hirsch, and the Alafi Foundation (Dr. Breyer).
References
Author notes
Conflict of Interest: The authors report no conflicts of interest.
