


Abstract
Patients with prostate cancer (PC) who undergo radical prostatectomy (RP) experience impaired sexual and urinary function.
To compare the effect of early couple counseling and pelvic floor muscle training (PFMT) with usual care for sexual and urinary dysfunction after RP.
The ProCan study was a randomized controlled trial (RCT) with two parallel treatment arms and 1:1 allocation. Between January 2016 and December 2017, candidates for RP were invited to a longitudinal questionnaire study and provided baseline measures before surgery. Patients who underwent RP, had a female partner, and were sexually active were invited to the ProCan RCT. Couples who provided informed consent were allocated to usual care or usual care and up to six couple counseling sessions, up to three instructions in PFMT and a video home-training program. All couples filled in follow-up questionnaires at 8 and 12 months and non-participants provided 12 months’ follow-up. Linear mixed-effect models and 95% confidence intervals were used to measure effects of the intervention.
Primary outcome was erectile function, measured with The International Index of Erectile Function, at 8 and 12 months follow-up. Secondary outcomes were sexual and urinary function and use of treatment for erectile dysfunction (ED) by patients; sexual function in female partners; and relationship function, health-related quality of life, anxiety, depression, and self-efficacy in both patients and female partners.
Thirty-five couples were randomized. No significant effect of the intervention was found on erectile function at 8 months (estimated difference in change, 1.41; 95% CI; –5.51 ; 8.33) or 12 months (estimated difference in change, 0.53; 95% CI; –5.94; 6.99) or in secondary outcomes, except for significantly increased use of ED treatment at 8 months.
We found no effect of early couple counseling and PFMT, possibly because of the limited number of participants.
Introduction
Patients with localized prostate cancer (PC) who undergo surgery may experience long-term urinary dysfunction and sexual dysfunctions,1 such as erectile dysfunction (ED), penile shortening, dry and painful orgasm, and orgasm-associated incontinence.2 ED may affect sexual function, and female partner satisfaction,3,4 and the urinary difficulties not only affect patients but also the female partners.5 These couples are furthermore facing a potentially life-threatening disease that may affect the relationship, communication patterns, and sexual intimacy.6,7
Overall, previous RCT´s suggest that couple counseling may increase the use of ED treatment8-12 and improve sexual function in men treated for PC.8-11 However, to our knowledge, only two previous studies 12,13 have tested the effect of early sexual counseling by peer or nurse 12 or by clinical sexologist 13 in combination with medical ED treatment, solely among patients undergoing surgery for PC. Only one of these 13 found improved sexual function defined as the ability to have regular penetrative sexual activity one year after surgery, however, this study was not randomized.13 Thus, there is still a knowledge gap regarding, how to address sexual and urinary dysfunctions following surgery for PC.
The most common treatments used for restoration of erectile function are oral phosphodiesterase (PDE-5) inhibitors, vacuum erection devices, and intracorporeal injection therapy.14,15 Other treatments, such as pelvic floor muscle training (PFMT) with bio feed-back, have been suggested to also improve erectile function and reduce orgasm-associated incontinence.16,17 Still, men are reluctant to seek medical help and compliance with treatment is poor.18 Initiation and adherence to treatment for ED may be modifiable through education on the different treatments and on how to use them,9-12 but also through encouragement from the female partner,19 who potentially may improve sexual function as a result of treatment of their male partners´ ED.20-22 Thus we had previously developed and pilot tested the ProCan intervention consisting of couple counseling and PFMT, which used elements from social cognitive theory23 such as: active learning, adjustment of outcome expectations, modeling guided practice, and psychoeducation on urinary and sexual problems including the use of treatment for ED.24
The aim of this RCT was to test the effect of the ProCan intervention on sexual and urinary dysfunction after surgery for PC compared to usual treatment. We hypothesized, that early couple counseling and PFMT would significantly improve the primary outcome erectile function, and the secondary outcomes including sexual and urinary function and use of treatment for ED by patients; sexual function of female partners; and relationship function, health-related quality of life, anxiety, depression and self-efficacy in both patients and female partners.
Materials And Methods
Study Design And Population
We evaluated the effect of the ProCan intervention on patients and their female partners in a two-armed single-center RCT. Patients were eligible if they were ≥ 18 years, had undergone open or robot-assisted nerve sparing or non-nerve sparing surgery within the past 8 to 12 weeks, were proficient in Danish, were in an active sexual relationship with a female partner, and had provided written informed consent. The exclusion criteria were: other active cancer diagnosis except for non-melanoma skin cancer, a major psychiatric disease, dementia, or abuse of alcohol or drugs. The inclusion criteria for the female partners were: age ≥ 18 years, proficiency in Danish, and provided informed consent. The study protocol was approved by the Danish National Ethical Committee for the Capital Region (registration number H-3-2013-206) and the Danish Data Protection Board (Journal No. 2015-41-3963). The trial is registered on ClinicalTrials.gov identifier: NCT02103088.
Recruitment
Between January 25, 2016 and December 31, 2017, all candidates for radical prostatectomy (RP) surgery at the Clinic of Urology, Rigshospitalet, in Copenhagen, Denmark were invited to participate in a longitudinal questionnaire study. Participants providing informed consent filled in a baseline questionnaire before surgery and again at 12 months follow-up. Patients who had provided a baseline questionnaire, had undergone RP, had a female partner, and were sexually active were further invited to participate in the ProCan RCT approximately 8 weeks after surgery. Couples who provided informed consent to participate in the RCT were randomized to the control or the intervention group. Patients and partners who refused to participate in the RCT were included as a comparison group of non-participants using data from the baseline and 12 months follow-up questionnaires (Figure 1 ).

Study Flow for the ProCan randomized controlled trial.
Randomization
Patients and their female partners were randomized (1:1) by computer-generated randomization in blocks of 6, 8, and 10, stratified according to nerve-sparing (NS) or non-nerve-sparing (NNS) surgery, and allocated to either the control group, who received usual treatment and care, or to the intervention group, who received the ProCan intervention in addition to usual treatment and care. The allocation was concealed from the project leader, who performed the randomization, but patients and study personnel could not be blinded. Patients were informed about their group allocation immediately after randomization.
Usual Treatment
Participants in both groups received usual treatment, which comprised pre-surgery instruction in PFMT, regular tests for prostate-specific antigen, outpatient visits to a physician, referral to municipal rehabilitation (focusing mainly on PFMT). Treatment for ED was offered if not contraindicated, which consisted of treatment with PDE-5 inhibitors daily or before sexual activity or urethral pin or penile injection of Alprostadil.
Intervention
The ProCan intervention was manualized and consisted of up to six 1-h couple counseling sessions with a certified sexual counselor and up to three individual instructions in PFMT, complemented by a home video training program.24 Participants were encouraged to complete at least two couple counseling and one PFMT. The counseling was based on elements of social cognitive theory,23 including: active learning, adjustment of outcome expectations, modeling guided practice, psychoeducation on sexual problems, use of different treatments for ED, and self-management of symptoms. Counseling was initiated approximately 2 to 3 months after surgery and continued for 6 months. The counselor aimed to establish a safe communication environment in which the couples could talk openly about their feelings, the relationship, intimacy, and sex. If they were interested, couples were introduced to sensuality training to increase their intimacy and sexual desire without penetrative sex. PFMT was based on the recommendations for treatment of urinary incontinence of the Professional Association of Danish Physiotherapists25 and was provided by certified physiotherapists qualified to perform both examination for and treatment of urinary incontinence; it was completed within 3 to 4 months of study inclusion. The exercise program was based on patients subjective experience with urinary difficulties and personal factors related to motivation and coping. The physiotherapist used manual palpation to determine the function, strength, and endurance of the pelvic floor muscles in order to design individual exercise programs.
Clinical Characteristics
Clinical characteristics were obtained from medical records. The spread and grade of the cancer were categorized according to the TNM Classification of Malignant Tumors and Gleason score ( ≤ 6-7, ≥ 8, ). The surgical procedure was categorized as robot-assisted or laparotomy, and nerve preservation was categorized as nerve-sparing or non-nerve-sparing. Information on comorbid conditions including diabetes, cardiovascular disease and depression were categorized as presence of 0, 1- ≥ 2 comorbid conditions at the time of diagnosis (Table 1 ).
Sociodemographic and clinical characteristics of participants in the ProCan RCT as well as the non-participants
| Characteristics, N (%) | Intervention patients (N= 16) | Control patients (N = 19) | Intervention partners (N = 16) | Control partners (N = 19) | Non-participants patients (N = 45) | Non-participants partners (N = 32) |
|---|---|---|---|---|---|---|
| Age, mean years (range) | 62.5 (53.9-71.5) | 63.4 (45.2-75.4) | 59.6 (50.1-74.2) | 60.7 (40.5-73.1) | 64.0 (47.7-73.8) | 61.4 (43.3-73.0) |
| Education (years) | ||||||
| Short/medium (≤9-13) | 5 (31.2) | 8 (42.1) | NA | 5 (26.3) | 20 (44.4) | 9 (28.1) |
| Long (> 13) | 11 (68.8) | 11 (57.9) | 13 (81.2) | 14 (73.7) | 25 (55.6) | 23 (71.9) |
| Disease stage T N M⁎ T2-T3 | 16(100) | 19 (100) | 45(100) | |||
| N-category | ||||||
| N0-N1 | 9 (56.2) | 5 (26.3) | 21 (46.7) | |||
| NX/missing | 7 (43.8) | 14 (63.2) | 24 (53.3) | |||
| M-category | ||||||
| MO | 16 (100) | 17 (89.5) | 43 (95.6) | |||
| MX/missing | NA | NA | ||||
| Gleason score† | ||||||
| ≤ 6-7 | 13 (81.3) | 19 (100) | 41 (91.1) | |||
| ≥ 8 | NA | NA | ||||
| Surgical procedure | ||||||
| Robot assisted | 12 (75) | 17 (89.5) | 41 (91.1) | |||
| Laparotomy | NA | NA | NA | |||
| Operation technique‡ | ||||||
| NS | 9 (56.2) | 10 (52.6) | 26 (57.8) | |||
| NNS | 7 (43.8) | 9 (47.4) | 19 (42.2) | |||
| Comorbidity | ||||||
| 0 | 9 (56.2) | 8 (42.1) | 21 (46.7) | |||
| 1- ≥ 2 | 7 (43.8) | 11 (57.9) | 24 (53.3) |
TNM staging: T=Tumor size, N=Lymph nodes involved M=Distant metastasis
Gleason score ≤ 6 = Low grade, 7= Intermediate grade, and 8-10=High grade cancer
NS= Nerve Sparing, NNS= Non Nerve Sparing
NA: Below five persons
Data Collection
Patients and partners filled out questionnaires at baseline and at follow-up at 8 and 12 months. In addition, all patients filled out a short questionnaire on sexual function at study inclusion 2 to 3 months after surgery. The baseline questionnaires elicited sociodemographic information (length of education, work, and cohabitation status), and all questionnaires elicited information on use of treatment for ED and validated and standardized measures of the outcomes described below.
Patient-Reported Outcomes
The primary outcome was erectile function (< 4 weeks) in male patients, measured with the 15-item International Index of Erectile Function (IIEF-15). The scale has been linguistically validated in Danish.26 It provides a total score and scores for: (i) erectile function, (ii) sexual desire, (iii) orgasmic function, (iv) intercourse satisfaction, and (v) overall satisfaction. Higher scores indicate better function, and a score ≤ 16 for the erectile domain indicates severe-to-moderate ED.27 All other outcomes were considered secondary. Urinary function was measured using the Expanded Prostate Cancer Index Composite Short Form (EPIC-26),28 within urinary, bowel, sexual, and hormonal symptoms, which were transformed linearly to scales of 0 to 100, higher scores indicating better function. The EPIC-26 has been linguistically validated and used in a Danish study.29
Partner-Reported Outcomes
Sexual function (< 4 weeks) in women was measured with the 19-item Female Sexual Function Index (FSFI)30 with total score and scores for: (i) desire, (ii) arousal, (iii) lubrication, (iv) orgasm, and (v) pain. A higher score indicates better sexual function, and a cut-off score < 26.55 indicates sexual dysfunction.31 The total score can be calculated only for sexually active (< 4 weeks) females,30,32 the only domain that can be reported regardless of sexual activity, is desire. The Danish version has been used in other studies.33 Sexual distress was measured on the 12 items Female Sexual Distress Scale; a higher score indicates greater distress, and a score ≥ 15 indicates sexual distress.34 The Danish version has been used in other studies.33
Patient- And Partner-Reported Outcomes
Patients and female partners also completed the following questionnaires: relationship function, health-related quality of life, anxiety, depression, and general self-efficacy. The secondary outcomes are described in Appendix A.
Statistical Analyses
An a-priori power calculation for a minimum detectable difference of four points in improvement of the erectile function score between groups was conducted with a two-sided t test. With an assumed significance level of 5%, a power of 80%, a standard deviation of eight points,9,35 and a 25% drop-out the inclusion of 80 participants in each treatment group, would yield a minimum detectable difference of four points. We used descriptive statistics to present results for participants in the two groups of the RCT and for non-participants who completed questionnaires on sociodemographic and clinical characteristics at baseline and primary and secondary outcomes at baseline and at 2 months (when available), 8 months (when available) and 12 months. t tests for continuous variables and chi-squared test for categorical variables were used to evaluate differences between the two groups of the ProCan RCT as well as to compare all participants in the ProCan RCT with respect to the non-participants at baseline.
To investigate the effect of the intervention on erectile function and secondary outcomes in patients and partners separately at 2 months, 8 months and 12 months, we fitted linear mixed-effect models and used all time points and assumed no difference between intervention and control at baseline, but allowed different intervention effects at 2 months, 8 months and 12 months. The models included the fixed effect of the intervention and random effects in patients and partners. The covariance structure was defined as unstructured, and the Kenward-Roger correction was used to improve the test validity with a small sample size. An estimate of treatment effect was presented for each follow-up time with 95% confidence intervals (CIs). The results for selected outcomes are presented graphically, with plots showing trends in predicted estimated means for the intervention and control groups. Models for each outcome for both patients and partners were computed from the available data, with no effect on model validity, as patterns of missing data can be considered at random. Model assumptions were evaluated by visual inspection of residual plots, and analyses were conducted in SAS version 9.4.
Results
Participant Characteristics
Thirty-five couples were randomized and allocated to the intervention (n = 16) and the control groups (n = 19) (Figure 1). In total 66 couple counseling sessions (median, four per couple) and 34 PFMT sessions (median, two per patient) were delivered to the intervention group. Descriptive data on sociodemographic and clinical characteristics and on patient- and partner-reported outcomes are shown in Table 1 and Appendices B, C, D.
Intervention Effects On Patient And Partner Outcomes
No statistically significant effect of the intervention was found on either primary or secondary outcomes, except for significantly increased use of ED treatment by patients in the intervention group at 8 months (P < .003). No significant effect was found on erectile function at 8 months (estimated difference in change, 1.41; 95% CI; –5.51; 8.33) or 12 months (0.53; –5.94; 6.99) or for any other sexual function domain (Appendix B) (Figure 2 ). No significant effects were found on urinary incontinence, although improvements were seen at 8 months (6.90; –10.96; 24.76) and at 12 months (5.43; –12.46; 23.32) as well as for total sum score at 8 and 12 months (Appendix C) (Figure 3 ). Although improvements were observed in female sexual function in the intervention group, the effects were not significant at 8 months (estimated difference in change, 4.15; 95% CI, –0.45; 8.73) or at 12 months (2.30; –1.73; 6.34) or in any other sexual function domain (Appendix B) (Figure 4 ). Furthermore, no significant difference was observed at any time in overall sexual distress between partners in the intervention and in the control group (Appendix B).
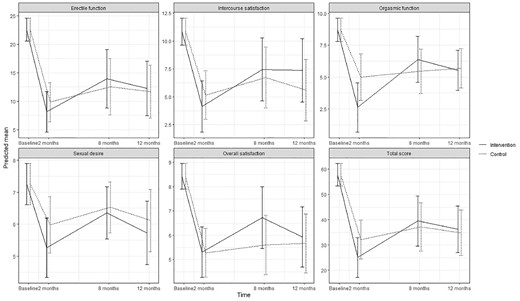
Predicted means and 95 % confidence intervals for sexual function (IIEF-15) according to intervention group and control group in the ProCan randomized controlled trial (n = 35).
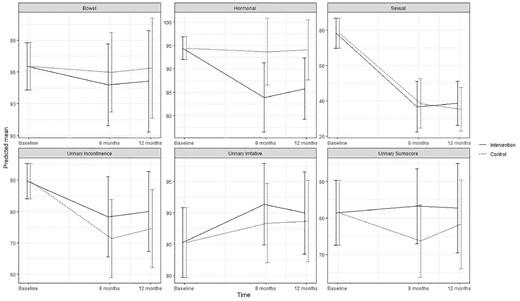
Predicted means and 95 % confidence intervals for urinary function (EPIC-26) according to intervention group and control group in the ProCan randomized controlled trial (n = 35).
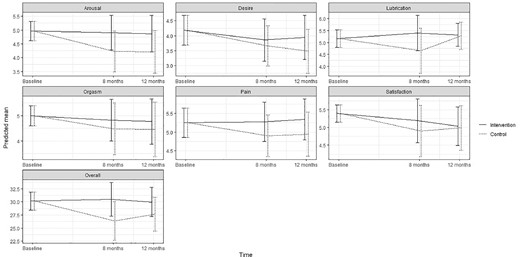
Predicted means and 95 % confidence intervals for female sexual function (FSFI-19) according to intervention group and control group in the ProCan randomized controlled trial (n = 35).
No significant differences in clinical or sociodemographic characteristics or in patient- and partner-reported outcomes were observed between participants in the Procan RCT and non-participants (Table 1), except for a significantly lower total mean score for male sexual function (P = .018) and significantly lower physical function in partners (P = .012).
Discussion
Contrary to our hypothesis, we found no statistically significant effect of the ProCan intervention, which combines sexual counseling and PFMT for men undergoing surgery for PC and their partners on the primary outcome erectile function. Neither did we find an effect on any secondary outcomes measured in patients and partners separately, except for significantly increased use of ED treatment at 8 months by patients in the intervention group. The lack of statistical power may be an important explanation for why we did not find the expected significant effect of the ProCan intervention. However, also the timing and efficiency of the intervention are important factors to be considered.
In principal early recovery of ED is emphasized to prevent fibrosis of the corpora cavernosa15 and in contrast to previous studies, 9,11 we included all patients 2 to 3 months after surgery and they were counseled until 8 months after inclusion. This meant these patients were included when they were still recovering from the bodily changes induced by the surgery, such as penile shortening, erectile and urinary dysfunction,1,2 which may have limited the desire to engage in sexual activity. Furthermore, the couples had recently been faced with a potentially life threatening disease, which may cause psychological distress and relationship strain.6,7 Due to these physical and psychological consequences of the treatment for PC, it may for some couples have been too early to resume sexual activity and to engage in the counseling sessions needed to achieve noticeable improvements in male and female sexual function. In order to compare to other studies,11,12 and as the intervention effect tend to fade over time, we measured the intervention effect upon completion at 8 months and at 12 months. The short follow up period of 12 months may however, have restricted the possibility of detecting improvements in erectile function, as a firmer, more reliable erection may be recovered only 2 to 4 years after surgery in some patients.12,13
The increased use of ED treatment is in accordance with findings of studies applying different couple counseling formats,9-12 some of which also found improved male sexual function.9-11 We did find an increased use of medical treatment for ED in the intervention group, however no significant improvements in erectile function and male or female sexual function were identified. This may raise the questions that either the offered ED treatment was not sufficient or the compliance with treatment was poor. The majority of patients used oral medical treatment with PDE-5 inhibitors on demand, which studies point to may not be sufficient to improve erectile function following NS or NNS surgery for PC.13
Treatment for ED may not solve other sexual concerns such as decreased pleasure, dry and painful orgasm, and difficulties in reaching orgasm.36 Furthermore, recovery of erection may not result in the same sexual satisfaction as before surgery, and it is important to integrate both physical and psychological aspects to restore sexual satisfaction.37,38 The pilot test of the ProCan intervention24 showed good acceptability of the counseling. Still, it may not have been sufficient to improve overall male and female sexual function and the intervention did neither benefit nor harm participants compared to usual care.
We did not observe significant improvements in urinary incontinence and urinary irritative symptoms suggesting that the participants in the intervention did not benefit from PFMT substantially more than controls. Studies 39 have reported an effect of PFMT already after 12 weeks of training and we had thus expected an effect, if any, of the PFMT at both 8 and 12 months follow-up. All patients were offered municipal rehabilitation on demand, which as a minimum often includes PFMT. However, as only two cases and three controls made use of this offer it is not likely to have influenced the results.
The strengths of this study include early recruitment of patients treated for PC with surgery only, and the inclusion of female partners, which has been shown to be an important factor for increasing use of and adherence to treatment for ED.18,22,36 The intervention was manualized and based on a solid theoretical framework, tested in a small non-randomized pilot study, and adjusted to the couples needs accordingly. Certified, experienced health professionals carried out the intervention, and attrition was low (Figure 1). We used validated scales to measure sexual function in patients and partners and had information on couples who refused to participate in the RCT at baseline and at the 12-month follow-up. Although the scales applied have been tested in several Danish studies, most of the scales have only been linguistically validated and not psychometrically validated in Danish, and this may have introduced measurement bias. The small sample size limits interpretation of the results and their generalizability. Power calculations indicated that each arm should have included 80 couples, but we had to stop inclusion after the planned recruitment period of 2 years due to cost and time constraints. We cannot rule out that there might have been a significant effect of the ProCan intervention that we were not able to detect. All the patients had surgery, however different surgical techniques were used, which may have affected post-operative outcomes. In order to consider this the randomization was stratified according to NS and NNS surgery.
Comparisons between participants and the non-participants showed no baseline differences in socio-demographic or clinical variables; however, non-participating patients had a significantly lower total mean score in sexual function, and non-participating partners reported significantly lower physical function. It is thus possible that the couples most in need were not included in the study, which may present a ceiling effect and affect the generalizability of the results.
Conclusions
We found no effect of early couple counseling and PFMT over that of treatment as usual on sexual and urinary outcomes and relationship function. Further studies are necessary to improve recruitment and develop effective intervention components in order to establish evidence-based strategies to relieve sexual and urinary dysfunction among PC patients and their partners.
Acknowledgments
The study was funded by the Research Foundation in the Capital Region [grant number E-23724-01]and the Danish Cancer Society. We thank the participating couples, the counselors Rikke Permild and Hanne Ryttergaard and the physiotherapists Agnethe Lawaetz, Eva Krause and Ulla Due, who made this study possible.
Institutional review board: The study protocol was approved by the Danish National Ethical Committee for the Capital Region (registration number H-3-2013-206) and the Danish Data Protection Board (Journal No. 2015-41-3963). The trial is registered on ClinicalTrials.gov identifier: NCT02103088.
Funding None.
References
Appendix A. Description of secondary outcome measures for patients and partners
| Outcome | Measure and scoring | Outcome domains |
|---|---|---|
| Relationship function | Dyadic Adjustment Scale (DAS).1 32 items, norm score = 114.8 Cut off score for distress = 98 | Dyadic consensus, dyadic satisfaction, dyadic cohesion, affectional expression and total score. |
| Health related quality of life | Medical Outcomes Study, Short Form (SF-36) version 2.2 Subscales are scored from 0 (poorest health) to 100 (best health). Global physical (PCS) and mental component summaries (MCS) are calculated from all eight subscales | Physical functioning, role-physical, bodily pain, vitality, social functioning, role-emotional, mental health and general health. Global physical (PCS) and mental component summaries (MCS). |
| Anxiety | Symptom Check List 92 (SCL-92).3 The Danish translation and combination of the Symptom Checklist-90 and Symptom Check list-90R assessing 10 symptoms of anxiety with score ranges from zero to 40. | |
| Depression | Major Depression Inventory (MDI).4 Twelve questions covering 10 categories of depressive symptoms of major depression in DSM-IV and moderate to severe depression in ICD-10. The total score range from zero (no symptoms) to 50 (max symptom burden). | |
| Self-efficacy | General Self-efficacy Scale (GSE)5 in the Danish version adapted from a study by Mikkelsen et al.6 The GSE consists of 10 items scored from one to four and the total score is a mean score of all the answered items. |
1. Spanier GB. Measuring dyadic adjustment: new scales for assessing the quality of marriage and similar dyads. Journal of Marriage and the Family. 1976;38:15-28.
2. Ware JE, Jr., Kosinski M, Bjorner JB, et al. User's manual for the SF-36v2 Health Survey. Lincoln, RI: QualityMetric Incorporated; 2007.
3. Olsen LR, Mortensen EL, Bech P. The SCL-90 and SCL-90R versions validated by item response models in a Danish community sample. Acta PsychiatrScand. 2004;110:225-9.
4. Bech P, Rasmussen NA, Olsen LR, et al. The sensitivity and specificity of the Major Depression Inventory, using the Present State Examination as the index of diagnostic validity. Journal of Affective Disorders. 2001;66:159-64.
5. Jerusalem M, & Schwarzer, R. Self-efficacy as a resource factor in stress appraisal processes. In R. Schwarzer (Ed.), Self-efficacy: Thought control of action (pp. 195-213). ed. Washington, DC, US: Hemisphere Publishing Corp.; 1992.
6. Mikkelsen EG, Einarsen S. Relationships between exposure to bullying at work and psychological and psychosomatic health complaints: the role of state negative affectivity and generalized self-efficacy. Scand J Psychol. 2002;43:397-405.
| Outcome | Measure and scoring | Outcome domains |
|---|---|---|
| Relationship function | Dyadic Adjustment Scale (DAS).1 32 items, norm score = 114.8 Cut off score for distress = 98 | Dyadic consensus, dyadic satisfaction, dyadic cohesion, affectional expression and total score. |
| Health related quality of life | Medical Outcomes Study, Short Form (SF-36) version 2.2 Subscales are scored from 0 (poorest health) to 100 (best health). Global physical (PCS) and mental component summaries (MCS) are calculated from all eight subscales | Physical functioning, role-physical, bodily pain, vitality, social functioning, role-emotional, mental health and general health. Global physical (PCS) and mental component summaries (MCS). |
| Anxiety | Symptom Check List 92 (SCL-92).3 The Danish translation and combination of the Symptom Checklist-90 and Symptom Check list-90R assessing 10 symptoms of anxiety with score ranges from zero to 40. | |
| Depression | Major Depression Inventory (MDI).4 Twelve questions covering 10 categories of depressive symptoms of major depression in DSM-IV and moderate to severe depression in ICD-10. The total score range from zero (no symptoms) to 50 (max symptom burden). | |
| Self-efficacy | General Self-efficacy Scale (GSE)5 in the Danish version adapted from a study by Mikkelsen et al.6 The GSE consists of 10 items scored from one to four and the total score is a mean score of all the answered items. |
1. Spanier GB. Measuring dyadic adjustment: new scales for assessing the quality of marriage and similar dyads. Journal of Marriage and the Family. 1976;38:15-28.
2. Ware JE, Jr., Kosinski M, Bjorner JB, et al. User's manual for the SF-36v2 Health Survey. Lincoln, RI: QualityMetric Incorporated; 2007.
3. Olsen LR, Mortensen EL, Bech P. The SCL-90 and SCL-90R versions validated by item response models in a Danish community sample. Acta PsychiatrScand. 2004;110:225-9.
4. Bech P, Rasmussen NA, Olsen LR, et al. The sensitivity and specificity of the Major Depression Inventory, using the Present State Examination as the index of diagnostic validity. Journal of Affective Disorders. 2001;66:159-64.
5. Jerusalem M, & Schwarzer, R. Self-efficacy as a resource factor in stress appraisal processes. In R. Schwarzer (Ed.), Self-efficacy: Thought control of action (pp. 195-213). ed. Washington, DC, US: Hemisphere Publishing Corp.; 1992.
6. Mikkelsen EG, Einarsen S. Relationships between exposure to bullying at work and psychological and psychosomatic health complaints: the role of state negative affectivity and generalized self-efficacy. Scand J Psychol. 2002;43:397-405.
Appendix B. Sexual function outcomes
Mean scores and standard deviations (SD) for the intervention group and the control group in the ProCan RCT and the non-participants for both for patients and partners. Linear mixed model estimates for differences in change (Estimate) in sexual function scores and 95 % confidence intervals (CI) between the intervention group and the control group for both patients and partners.
| Sexual function patients | Intervention(N = 16) | Control(N = 19) | Non-participants(N = 45) | Linear mixed model estimates | |||||
|---|---|---|---|---|---|---|---|---|---|
| N | Mean (SD) | N | Mean SD | N | Mean (SD) | Estimate | 95% CI | p | |
| Erectile function | |||||||||
| Baseline | 16 | 24.0 (3.0) | 19 | 21.4 (7.5) | 45 | 18.2 (8.9) | |||
| 2 months | 16 | 8.9 (7.7) | 18 | 8.7 (6.8) | - 1.69 | (-6.47- 3.09) | 0.48 | ||
| 8 months | 15 | 14.6 (9.7) | 16 | 11.8 (10.5) | 1.41 | (-5.51- 8.33) | 0.68 | ||
| 12 months | 16 | 13.3 (9.8) | 16 | 11.4 (9.8) | 40 | 11.0 (8.6) | 0.53 | (-5.94 - 6.99) | 0.87 |
| Test for no intervention effect | 0.39 | ||||||||
| Orgasmic function | |||||||||
| Baseline | 16 | 9.4 (1.0) | 19 | 8.2 (3.4) | 45 | 7.5 (3.9) | |||
| 2 months | 16 | 3.0 (3.4) | 18 | 4.6 (4.4) | -2.37 | (-4.98-0.24) | 0.07 | ||
| 8 months | 15 | 6.6 (2.3) | 16 | 4.8 (4.6) | 0.94 | (-1.47-3.34) | 0.43 | ||
| 12 months | 16 | 6.0 (2.8) | 16 | 5.4 (3.9) | 40 | 5.3 (4.1) | -0.15 | (-2.18-1.89) | 0.88 |
| Test for no intervention effect | 0.10 | ||||||||
| Sexual desire | |||||||||
| Baseline | 16 | 7.6 (1.6) | 19 | 7.0 (2.1) | 45 | 6.8 (2.2) | |||
| 2 months | 16 | 5.4 (2.0) | 18 | 5.8 (2.0) | -0.72 | (-1.91-0.48) | 0.23 | ||
| 8 months | 15 | 6.6 (1.7) | 16 | 6.4 (2.2) | -0.17 | (-1.10-0.75) | 0.71 | ||
| 12 months | 16 | 5.9 (1.9) | 16 | 6.0 (2.3) | 40 | 6.3 (1.9) | -0.39 | (-1.73-0.95) | 0.56 |
| Test for no intervention effect | 0.69 | ||||||||
| Intercourse satisfaction | |||||||||
| Baseline | 16 | 11.7 (2.1) | 19 | 10.2 (4.3) | 45 | 7.8 (6.3) | |||
| 2 months | 16 | 4.7 (4.7) | 18 | 4.7 (4.9) | -1.02 | (-4.04-2.01) | 0.50 | ||
| 8 months | 15 | 7.9 (5.1) | 16 | 6.6 (6.4) | 0.73 | (-3.02-4.47) | 0.70 | ||
| 12 months | 16 | 7.9 (5.8) | 16 | 5.3 (5.8) | 40 | 5.5 (5.8) | 1.78 | (-2.11-5.68) | 0.36 |
| Test for no intervention effect | 0.40 | ||||||||
| Overall satisfaction | |||||||||
| Baseline | 16 | 8.4 (1.5) | 19 | 8.4 (1.6) | 45 | 7.1 (2.6) | |||
| 2 months | 16 | 5.3 (2.2) | 18 | 5.2 (1.9) | 0.03 | (-1.41-1.48) | 0.97 | ||
| 8 months | 15 | 6.6 (2.7) | 16 | 5.7 (2.1) | 1.12 | (-0.60-2.83) | 0.19 | ||
| 12 months | 16 | 5.9 (2.5) | 16 | 5.9 (2.5) | 40 | 6.1 (2.2) | 0.27 | (-1.40-1.94) | 0.74 |
| Test for no intervention effect | 0.51 | ||||||||
| Total score | |||||||||
| Baseline | 16 | 61.1 (4.5) | 19 | 55.1 (16.9) | 45 | 47.9 (21.1) | |||
| 2 months | 16 | 27.3 (16.3) | 18 | 30.4 (16.2) | -7.06 | (-17.43-3.30) | 0.17 | ||
| 8 months | 15 | 42.8 (18.1) | 16 | 35.3 (22.1) | 2.33 | (-10.29-14.94) | 0.71 | ||
| 12 months | 16 | 38.9 (19.6) | 16 | 33.9 (19.6) | 40 | 34.9 (19.7) | 1.43 | (-10.61-13.47) | 0.81 |
| Test for no intervention effect | 0.28 | ||||||||
| Sexual Function partners Desire | |||||||||
| Baseline | 16 | 4.4 (1.3) | 19 | 4.0 (1.6) | 30 | 3.4 (1.6) | |||
| 8 months | 14 | 4.0 (1.6) | 16 | 3.5 (1.5) | 0.20 | (-0.65-1.04) | 0.63 | ||
| 12 months | 14 | 4.0 (1.5) | 14 | 3.4 (1.6) | 27 | 3.4 (1.3) | 0.46 | (-0.50-1.42) | 0.33 |
| Test for no intervention effect | 0.62 | ||||||||
| Arousal | |||||||||
| Baseline | 16 | 4.9 (1.2) | 15 | 5.1 (0.7) | 21 | 4.6 (1.2) | |||
| 8 months | 11 | 4.9 (0.8) | 7 | 4.4 (1.5) | 0.69 | (-0.23-1.60) | 0.13 | ||
| 12 months | 10 | 4.8 (1.1) | 7 | 4.5 (1.2) | 10 | 4.5 (1.4) | 0.66 | (-0.31-1.62) | 0.17 |
| Test for no intervention effect | 0.27 | ||||||||
| Lubrication | |||||||||
| Baseline | 16 | 5.1 (1.0) | 15 | 5.2 (1.0) | 21 | 5.2 (0.9) | |||
| 8 months | 11 | 5.4 (0.7) | 7 | 4.8 (1.5) | 0.74 | (-0.45-1.94) | 0.21 | ||
| 12 months | 10 | 5.3 (0.7) | 7 | 5.5 (0.7) | 10 | 4.9 (1.2) | 0.04 | (-0.72-0.79) | 0.92 |
| Test for no intervention effect | 0.50 | ||||||||
| Orgasm | |||||||||
| Baseline | 16 | 4.8 (1.3) | 15 | 5.3 (0.8) | 21 | 5.0 (1.3) | |||
| 8 months | 11 | 4.7 (1.3) | 7 | 4.5 (1.3) | 0.34 | (-0.99-1.68) | 0.60 | ||
| 12 months | 10 | 4.7 (1.1) | 7 | 4.7 (1.6) | 10 | 4.0 (1.7) | 0.31 | (-1.10-1.72) | 0.64 |
| Test for no intervention effect | 0.84 | ||||||||
| Satisfaction | |||||||||
| Baseline | 16 | 5.2 (0.8) | 15 | 5.6 (0.5) | 21 | 5.2 (0.9) | |||
| 8 months | 10 | 5.2 (1.0) | 7 | 5.0 (0.9) | 0.29 | (-0.66-1.24) | 0.52 | ||
| 12 months | 10 | 4.9 (1.1) | 7 | 5.20 (0.6) | 10 | 4.9 (1.2) | 0.05 | (-0.76-0.86) | 0.89 |
| Test for no intervention effect | 0.80 | ||||||||
| Pain | |||||||||
| Baseline | 16 | 5.4 (0.8) | 15 | 5.1(1.3) | 21 | 5.4 (0.9) | |||
| 8 months | 10 | 5.4 (0.7) | 7 | 4.9 (1.4) | 0.37 | (-0.17-0.92) | 0.17 | ||
| 12 months | 10 | 5.6 (0.9) | 7 | 5.0 (1.9) | 10 | 5.8 (0.4) | 0.40 | (-0.17-0.97) | 0.16 |
| Test for no intervention effect | 0.33 | ||||||||
| Total Score* | |||||||||
| Baseline | 16 | 29.8 (5.5) | 15 | 30.6 (4.0) | 21 | 29.4 (5.0) | |||
| 8 months | 10 | 30.3 (4.9) | 7 | 27.1 (6.5) | 4.15 | (-0.45-8.74) | 0.07 | ||
| 12 months | 10 | 29.6 (4.7) | 7 | 29.1 (5.5) | 10 | 28.1 (6.2) | 2.30 | (-1.73-6.34) | 0.24 |
| Test for no intervention effect | 0.22 | ||||||||
| Female Sexual Distress Overall score | |||||||||
| Baseline | 14 | 7.9 (8.1) | 18 | 8.4 (7.6) | 29 | 10.3 (10.9) | |||
| 8 months | 13 | 10.4 (8.9) | 14 | 11.2 (7.9) | -0.80 | (-6.37-4.79) | 0.77 | ||
| 12 months | 14 | 10.3 (8.6) | 13 | 11.7 (10.1) | 26 | 12.2 (10.1) | -1.95 | (-7.04-3.13) | 0.44 |
| Test for no intervention effect | 0.68 | ||||||||
*Total scores are based only on partners who were sexually active at the different time points
| Sexual function patients | Intervention(N = 16) | Control(N = 19) | Non-participants(N = 45) | Linear mixed model estimates | |||||
|---|---|---|---|---|---|---|---|---|---|
| N | Mean (SD) | N | Mean SD | N | Mean (SD) | Estimate | 95% CI | p | |
| Erectile function | |||||||||
| Baseline | 16 | 24.0 (3.0) | 19 | 21.4 (7.5) | 45 | 18.2 (8.9) | |||
| 2 months | 16 | 8.9 (7.7) | 18 | 8.7 (6.8) | - 1.69 | (-6.47- 3.09) | 0.48 | ||
| 8 months | 15 | 14.6 (9.7) | 16 | 11.8 (10.5) | 1.41 | (-5.51- 8.33) | 0.68 | ||
| 12 months | 16 | 13.3 (9.8) | 16 | 11.4 (9.8) | 40 | 11.0 (8.6) | 0.53 | (-5.94 - 6.99) | 0.87 |
| Test for no intervention effect | 0.39 | ||||||||
| Orgasmic function | |||||||||
| Baseline | 16 | 9.4 (1.0) | 19 | 8.2 (3.4) | 45 | 7.5 (3.9) | |||
| 2 months | 16 | 3.0 (3.4) | 18 | 4.6 (4.4) | -2.37 | (-4.98-0.24) | 0.07 | ||
| 8 months | 15 | 6.6 (2.3) | 16 | 4.8 (4.6) | 0.94 | (-1.47-3.34) | 0.43 | ||
| 12 months | 16 | 6.0 (2.8) | 16 | 5.4 (3.9) | 40 | 5.3 (4.1) | -0.15 | (-2.18-1.89) | 0.88 |
| Test for no intervention effect | 0.10 | ||||||||
| Sexual desire | |||||||||
| Baseline | 16 | 7.6 (1.6) | 19 | 7.0 (2.1) | 45 | 6.8 (2.2) | |||
| 2 months | 16 | 5.4 (2.0) | 18 | 5.8 (2.0) | -0.72 | (-1.91-0.48) | 0.23 | ||
| 8 months | 15 | 6.6 (1.7) | 16 | 6.4 (2.2) | -0.17 | (-1.10-0.75) | 0.71 | ||
| 12 months | 16 | 5.9 (1.9) | 16 | 6.0 (2.3) | 40 | 6.3 (1.9) | -0.39 | (-1.73-0.95) | 0.56 |
| Test for no intervention effect | 0.69 | ||||||||
| Intercourse satisfaction | |||||||||
| Baseline | 16 | 11.7 (2.1) | 19 | 10.2 (4.3) | 45 | 7.8 (6.3) | |||
| 2 months | 16 | 4.7 (4.7) | 18 | 4.7 (4.9) | -1.02 | (-4.04-2.01) | 0.50 | ||
| 8 months | 15 | 7.9 (5.1) | 16 | 6.6 (6.4) | 0.73 | (-3.02-4.47) | 0.70 | ||
| 12 months | 16 | 7.9 (5.8) | 16 | 5.3 (5.8) | 40 | 5.5 (5.8) | 1.78 | (-2.11-5.68) | 0.36 |
| Test for no intervention effect | 0.40 | ||||||||
| Overall satisfaction | |||||||||
| Baseline | 16 | 8.4 (1.5) | 19 | 8.4 (1.6) | 45 | 7.1 (2.6) | |||
| 2 months | 16 | 5.3 (2.2) | 18 | 5.2 (1.9) | 0.03 | (-1.41-1.48) | 0.97 | ||
| 8 months | 15 | 6.6 (2.7) | 16 | 5.7 (2.1) | 1.12 | (-0.60-2.83) | 0.19 | ||
| 12 months | 16 | 5.9 (2.5) | 16 | 5.9 (2.5) | 40 | 6.1 (2.2) | 0.27 | (-1.40-1.94) | 0.74 |
| Test for no intervention effect | 0.51 | ||||||||
| Total score | |||||||||
| Baseline | 16 | 61.1 (4.5) | 19 | 55.1 (16.9) | 45 | 47.9 (21.1) | |||
| 2 months | 16 | 27.3 (16.3) | 18 | 30.4 (16.2) | -7.06 | (-17.43-3.30) | 0.17 | ||
| 8 months | 15 | 42.8 (18.1) | 16 | 35.3 (22.1) | 2.33 | (-10.29-14.94) | 0.71 | ||
| 12 months | 16 | 38.9 (19.6) | 16 | 33.9 (19.6) | 40 | 34.9 (19.7) | 1.43 | (-10.61-13.47) | 0.81 |
| Test for no intervention effect | 0.28 | ||||||||
| Sexual Function partners Desire | |||||||||
| Baseline | 16 | 4.4 (1.3) | 19 | 4.0 (1.6) | 30 | 3.4 (1.6) | |||
| 8 months | 14 | 4.0 (1.6) | 16 | 3.5 (1.5) | 0.20 | (-0.65-1.04) | 0.63 | ||
| 12 months | 14 | 4.0 (1.5) | 14 | 3.4 (1.6) | 27 | 3.4 (1.3) | 0.46 | (-0.50-1.42) | 0.33 |
| Test for no intervention effect | 0.62 | ||||||||
| Arousal | |||||||||
| Baseline | 16 | 4.9 (1.2) | 15 | 5.1 (0.7) | 21 | 4.6 (1.2) | |||
| 8 months | 11 | 4.9 (0.8) | 7 | 4.4 (1.5) | 0.69 | (-0.23-1.60) | 0.13 | ||
| 12 months | 10 | 4.8 (1.1) | 7 | 4.5 (1.2) | 10 | 4.5 (1.4) | 0.66 | (-0.31-1.62) | 0.17 |
| Test for no intervention effect | 0.27 | ||||||||
| Lubrication | |||||||||
| Baseline | 16 | 5.1 (1.0) | 15 | 5.2 (1.0) | 21 | 5.2 (0.9) | |||
| 8 months | 11 | 5.4 (0.7) | 7 | 4.8 (1.5) | 0.74 | (-0.45-1.94) | 0.21 | ||
| 12 months | 10 | 5.3 (0.7) | 7 | 5.5 (0.7) | 10 | 4.9 (1.2) | 0.04 | (-0.72-0.79) | 0.92 |
| Test for no intervention effect | 0.50 | ||||||||
| Orgasm | |||||||||
| Baseline | 16 | 4.8 (1.3) | 15 | 5.3 (0.8) | 21 | 5.0 (1.3) | |||
| 8 months | 11 | 4.7 (1.3) | 7 | 4.5 (1.3) | 0.34 | (-0.99-1.68) | 0.60 | ||
| 12 months | 10 | 4.7 (1.1) | 7 | 4.7 (1.6) | 10 | 4.0 (1.7) | 0.31 | (-1.10-1.72) | 0.64 |
| Test for no intervention effect | 0.84 | ||||||||
| Satisfaction | |||||||||
| Baseline | 16 | 5.2 (0.8) | 15 | 5.6 (0.5) | 21 | 5.2 (0.9) | |||
| 8 months | 10 | 5.2 (1.0) | 7 | 5.0 (0.9) | 0.29 | (-0.66-1.24) | 0.52 | ||
| 12 months | 10 | 4.9 (1.1) | 7 | 5.20 (0.6) | 10 | 4.9 (1.2) | 0.05 | (-0.76-0.86) | 0.89 |
| Test for no intervention effect | 0.80 | ||||||||
| Pain | |||||||||
| Baseline | 16 | 5.4 (0.8) | 15 | 5.1(1.3) | 21 | 5.4 (0.9) | |||
| 8 months | 10 | 5.4 (0.7) | 7 | 4.9 (1.4) | 0.37 | (-0.17-0.92) | 0.17 | ||
| 12 months | 10 | 5.6 (0.9) | 7 | 5.0 (1.9) | 10 | 5.8 (0.4) | 0.40 | (-0.17-0.97) | 0.16 |
| Test for no intervention effect | 0.33 | ||||||||
| Total Score* | |||||||||
| Baseline | 16 | 29.8 (5.5) | 15 | 30.6 (4.0) | 21 | 29.4 (5.0) | |||
| 8 months | 10 | 30.3 (4.9) | 7 | 27.1 (6.5) | 4.15 | (-0.45-8.74) | 0.07 | ||
| 12 months | 10 | 29.6 (4.7) | 7 | 29.1 (5.5) | 10 | 28.1 (6.2) | 2.30 | (-1.73-6.34) | 0.24 |
| Test for no intervention effect | 0.22 | ||||||||
| Female Sexual Distress Overall score | |||||||||
| Baseline | 14 | 7.9 (8.1) | 18 | 8.4 (7.6) | 29 | 10.3 (10.9) | |||
| 8 months | 13 | 10.4 (8.9) | 14 | 11.2 (7.9) | -0.80 | (-6.37-4.79) | 0.77 | ||
| 12 months | 14 | 10.3 (8.6) | 13 | 11.7 (10.1) | 26 | 12.2 (10.1) | -1.95 | (-7.04-3.13) | 0.44 |
| Test for no intervention effect | 0.68 | ||||||||
*Total scores are based only on partners who were sexually active at the different time points
Appendix C. Urinary function (EPIC-26)
Mean scores and standard deviations (SD) for the intervention group and the control group in the ProCan RCT and the non-participants. Linear mixed model estimates for differences in change (Estimate) in urinary function scores and 95 % confidence intervals (CI) between patients in the intervention group and the control group.
| Intervention(N = 16) | Control(N = 19) | Non-participants(N = 45) | Linear mixed model estimates | ||||||
|---|---|---|---|---|---|---|---|---|---|
| N | Mean (SD) | N | Mean SD | N | Mean (SD) | Estimate | 95% CI | P | |
| Urinary irritative | |||||||||
| Baseline | 15 | 81.3 (18.0) | 19 | 88.5 (13.9) | 42 | 83.3 (19.6) | |||
| 8 months | 15 | 90.8 (11.8) | 16 | 89.1 (13.0) | 3.02 | (-6.21-12.25) | 0.51 | ||
| 12 months | 16 | 89.8 (11.6) | 15 | 87.9 (13.9) | 40 | 91.9 (9.7) | 1.29 | (-8.08-10.66) | 0.78 |
| Test for no intervention effect | 0.77 | ||||||||
| Urinary incontinence | |||||||||
| Baseline | 16 | 90.0 (17.7) | 19 | 89.4 (15.8) | 44 | 93.8 (12.7) | |||
| 8 months | 15 | 77.7 (23.6) | 16 | 70.4 (26.5) | 6.90 | (-10.96-24.76) | 0.44 | ||
| 12 months | 16 | 80.1 (24.7) | 16 | 74.8 (25.8) | 39 | 84.4 (17.2) | 5.43 | (-12.46-23.32) | 0.54 |
| Test for no intervention effect | 0.72 | ||||||||
| Urinary sum-score | |||||||||
| Baseline | 16 | 78,1 (22,1) | 19 | 84.2 (29.1) | 44 | 79.0 (27.5) | |||
| 8 months | 15 | 83.3 (15.4) | 16 | 73.4 (23.2) | 9.6 | (-4.87-24.0) | 0.19 | ||
| 12 months | 16 | 82.8 (21.8) | 16 | 78.1 (25.6) | 40 | 81.9 (22.6) | 4.4 | (-13.07-21.89) | 0.61 |
| Test for no intervention effect | 0.40 | ||||||||
| Bowel sum-score | |||||||||
| Baseline | 16 | 97.9 (4.6) | 19 | 95.4 (7.7) | 44 | 92.3 (15.3) | |||
| 8 months | 15 | 95.0 (8.2) | 16 | 95.6 (6.9) | -1.18 | (-6.56-4.21) | 0.66 | ||
| 12 months | 16 | 95.6 (11.6) | 16 | 96.6 (5.7) | 39 | 94.1 (9.9) | -1.25 | (-7.98-5.49) | 0.71 |
| Test for no intervention effect | 0.90 | ||||||||
| Sexual sum-score | |||||||||
| Baseline | 16 | 82.3 (14.5) | 19 | 75.0 (31.1) | 45 | 69.9 (33.5) | |||
| 8 months | 15 | 36.8 (28.2) | 16 | 34.0 (28.1) | -1.82 | (-20.53-16.88) | 0.84 | ||
| 12 months | 16 | 41.2 (25.3) | 16 | 35.1 (28.4) | 39 | 33.6 (29.6) | 3.38 | (-12.66-19.41) | 0.67 |
| Test for no intervention effect | 0.44 | ||||||||
| Hormonal sum-score | |||||||||
| Baseline | 16 | 95.3 (7.2) | 19 | 93.7 (7.0) | 44 | 88.1 (18.3) | |||
| 8 months | 15 | 84.3 (19.4) | 16 | 93.4 (9.3) | -9.76 | (-19.5-0.02) | 0.05 | ||
| 12 months | 16 | 86.6 (16.8) | 16 | 93.8 (8.3) | 40 | 85.4 (19.9) | -8.30 | (-17.12-0.52) | 0.06 |
| Test for no intervention effect | 0.12 | ||||||||
Appendix D. Relationship function (DAS), health related quality of life (SF-36 component summaries PCS and MSC), anxiety (SCL-92), depression (MDI) and self-efficacy (GSE)
Mean scores and standard deviations (SD) for the intervention group and the control group in the ProCan RCT and the non-participants both patients and partners. Linear mixed model estimates for differences in change (Estimate) in scale's scores and 95 % confidence intervals (CI) between the intervention group and the control group for both patients and partners
| Intervention N = 16 | Control N = 19 | Non-participants | Linear mixed model estimates | ||||||
|---|---|---|---|---|---|---|---|---|---|
| N | Mean (SD) | N | Mean (SD) | N | Mean (SD) | Estimate | 95% CI | P | |
| Dyadic adjustment Patients | |||||||||
| Baseline | 15 | 125.8 (8.3) | 16 | 125.3 (8.7) | 39 | 120.5 (12.3) | |||
| 8 months | 12 | 120.0 (21.1) | 15 | 123.1 (9.3) | -3.42 | (-14.59-7.75) | 0.54 | ||
| 12 months | 13 | 122.2 (9.6) | 10 | 125.6 (11.1) | 27 | 118.2 (10.7) | -4.41 | (-17.37-8.54) | 0.48 |
| Test for no intervention effect | 0.79 | ||||||||
| Dyadic adjustment Partners | |||||||||
| Baseline | 16 | 125.7 (9.4) | 18 | 122.8 (9.8) | 21 | 121.7 (11.5) | |||
| 8 months | 14 | 124.9 (13.1) | 14 | 124.7 (6.7) | -1.35 | (-8.82-6.11) | 0.71 | ||
| 12 months | 12 | 123.3 (10.8) | 10 | 121.9 (8.1) | 17 | 123.2 (12.1) | -0.19 | (-6.94-6.57) | 1.00 |
| Test for no intervention effect | 0.86 | ||||||||
| SF-36 PCS Patients | |||||||||
| Baseline | 16 | 58.6 (3.1) | 19 | 55.8 (5.4) | 45 | 55.4 (7.7) | |||
| 8 months | 15 | 53.2 (9.4) | 16 | 53.8 (6.6) | -1.80 | (-7.41-3.82) | 0.52 | ||
| 12 months | 15 | 51.7 (9.1) | 16 | 53.3 (4.9) | 40 | 54.0 (7.5) | -4.01 | (-9.30-1.28) | 0.13 |
| Test for no intervention effect | 0.18 | ||||||||
| SF-36 MCS Patients | |||||||||
| Baseline | 16 | 53.1 (8.4) | 19 | 51.8 (10.0) | 45 | 50.3 (10.3) | |||
| 8 months | 15 | 53.9 (10.0) | 16 | 57.3 (4.5) | -3.94 | (-9.18-1.30) | 0.14 | ||
| 12 months | 15 | 56.0 (6.9) | 16 | 56.8 (6.5) | 40 | 52.3 (11.4) | -2.21 | (-7.25-2.83) | 0.38 |
| Test for no intervention effect | 0.33 | ||||||||
| SF-36 PCSPartners | |||||||||
| Baseline | 16 | 56.8 (6.1) | 18 | 57.4 (5.7) | 32 | 52.8 (7.6) | |||
| 8 months | 14 | 55.2 (6.6) | 16 | 52.7 (7.3) | 2.86 | (-0.34-6.05) | 0.08 | ||
| 12 months | 14 | 54.7 (7.6) | 15 | 52.1 (8.0) | 27 | 49.5 (7.6) | 3.32 | (-0.30-6.94) | 0.07 |
| Test for no intervention effect | 0.10 | ||||||||
| SF-36 MCS Partners | |||||||||
| Baseline | 16 | 49.2 (9.1) | 18 | 51.6 (7.7) | 32 | 48.9 (12.2) | |||
| 8 months | 14 | 54.4 (5.6) | 16 | 56.0 (8.6) | -0.79 | (-6.0-4.40) | 0.76 | ||
| 12 months | 14 | 55.9 (7.3) | 15 | 56.8 (5.0) | 27 | 52.2 (9.6) | 0.07 | (-4.18-4.33) | 0.97 |
| Test for no intervention effect | 0.93 | ||||||||
| Anxiety Patients | |||||||||
| Baseline | 16 | 0.3 (0.4) | 19 | 0.3 (0.4) | 45 | 0.4 (0.5) | |||
| 8 months | 15 | 0.3 (0.4) | 16 | 0.4 (1.0) | -0.04 | (-0.63-0.54) | 0.88 | ||
| 12 months | 16 | 0.3 (0.4) | 16 | 0.5 (1.0) | 39 | 0.3 (0.4) | -0.14 | (-0.70-0.41) | 0.60 |
| Test for no intervention effect | 0.86 | ||||||||
| Anxiety Partners | |||||||||
| Baseline | 16 | 0.6 (0.5) | 19 | 0.4 (0.4) | 31 | 0.5 (0.6) | |||
| 8 months | 13 | 0.4 (0.5) | 16 | 0.3 (0.6) | 0.05 | (-0.31-0.42) | 0.77 | ||
| 12 months | 14 | 0.3 (0.4) | 15 | 0.2 (0.3) | 28 | 0.5 (0.7) | 0.05 | (-0.17-0.27) | 0.62 |
| Test for no intervention effect | 0.87 | ||||||||
| MDI Patients | |||||||||
| Baseline | 16 | 5.2 (8.3) | 19 | 4.6 (4.2) | 45 | 7.1 (8.0) | |||
| 8 months | 15 | 6.5 (7.7) | 16 | 3.8 (3.6) | 2.58 | (-1.19-6.35) | 0.17 | ||
| 12 months | 16 | 6.6 (7.1) | 15 | 4.9 (4.8) | 39 | 6.2 (7.9) | 1.66 | (-2.49-5.80) | 0.42 |
| Test for no intervention effect | 0.39 | ||||||||
| MDI Partners | |||||||||
| Baseline | 16 | 6.6 (4.1) | 19 | 4.7 (4.6) | 32 | 7.6 (8.1) | |||
| 8 months | 14 | 5.5 (4.6) | 16 | 4.3 (6.7) | -0.19 | (-3.31-2.93) | 0.90 | ||
| 12 months | 14 | 6.4 (8.5) | 15 | 4.9 (5.0) | 27 | 6.4 (6.3) | -0.23 | (-4.45-3.99) | 0.91 |
| Test for no intervention effect | 0.99 | ||||||||
| General self-efficacy Patients | |||||||||
| Baseline | 16 | 3.5 (0.4) | 19 | 3.5 (0.4) | 45 | 3.3 (0.5) | |||
| 8 months | 15 | 3.3 (0.4) | 16 | 3.5 (0.5) | -0.17 | (-0.44-0.09) | 0.20 | ||
| 12 months | 16 | 3.2 (0.7) | 16 | 3.6 (0.4) | 40 | 3.3 (0.6) | -0.40 | (-0.76 - (-0.03) | 0.03 |
| Test for no intervention effect | 0.08 | ||||||||
| General self-efficacy Partners | |||||||||
| Baseline | 16 | 3.2 (0.5) | 19 | 3.3 (0.3) | 32 | 3.1 (0.5) | |||
| 8 months | 13 | 3.3 (0.6) | 16 | 3.5 (0.4) | -0.13 | (-0.47-0.22) | 0.46 | ||
| 12 months | 14 | 3.3 (0.6) | 15 | 3.3 (0.4) | 28 | 3.1 (0.5) | 0.19 | (-0.14-0.51) | 0.24 |
| Test for no intervention effect | 0.10 | ||||||||
Author notes
Conflict of Interest: The authors report no conflicts of interest.
