


Abstract
Most premenopausal women in China have normal lipid profiles while the sexual function among them was scarcely demonstrated.
To find out the characteristics of the sexual function in premenopausal Chinese women without hyperlipidemia using the Female Sexual Function Index (FSFI) and the Golombok Rust Inventory of Sexual Satisfaction (GRISS).
This cross-sectional study was performed to find out the characteristics of sexual function in premenopausal Chinese women without hyperlipidemia. Between January 2019 and March 2019, we recruited 216 women, 25–49 years of age. Data from questionnaires and health checkups were collected and analyzed.
We report the prevalence of and factors related to female sexual dysfunction (FSD) in premenopausal Chinese women without hyperlipidemia in accordance with the FSFI and the GRISS.
The prevalence of FSD in our study was 46.2%. The mean age was 38.07 ± 6.94 years. More highly educated women suffered from FSD than those in the control group (61.1% vs 35.2%, P < .05). Binge eating was significantly different between the groups (P = .023). Multiple logistic regression analyses demonstrated that total cholesterol level was positively associated with low desire (OR, 2.13; 95% CI, 1.10–4.13; P = .025) and so was the low-density lipoprotein level (OR, 2.18; 95% CI, 1.03–4.62; P = .0.041). The high-density lipoprotein level was inversely associated with infrequency (OR, 0.18; 95% CI, 0.06–0.59; P = .004). More women with FSD had orgasm disorder than those in the control group, for 83.3% vs 35.2% in the FSFI (P < .001), 88.9% vs 54.3% in the GRISS (P < .001), respectively. Dissatisfaction remained the most common issue for the control group in both the FSFI and the GRISS (90.50% and 58.10%, respectively).
FSD is frequent in premenopausal Chinese women without hyperlipidemia. Dissatisfaction as the common problem influenced over half of them and orgasm disorder is a severe sexual issue for women with FSD.
Xiang Y, Tang Y, Li J, et al. How Is the Sexual Function of Premenopausal Chinese Women Without Hyperlipidemia. J Sex Med 2019;8:65–75.
Introduction
Female sexual dysfunction (FSD) is multifactorial, including physiological, psychological, and social factors. A meta-analysis showed that menopause negatively affected sexual function.1 With the delay of age at transition to menopause, the risk of FSD decreased accordingly.2 Impaired lipid profile is also a risk factor for the development of FSD.3 In women with metabolic syndrome, higher triglyceride levels are linked to a higher risk of FSD regardless of menopausal status.4,5 For premenopausal women with diabetes and obesity, the high-density lipoprotein (HDL) level directly correlated with the Female Sexual Function Index (FSFI) score.6 Accordingly, menopause and hyperlipidemia are considered as risk factors for FSD. However, most premenopausal women in China have normal lipid profiles. The sexual function among them was scarcely demonstrated.
Furthermore, most Chinese FSD studies were based on the FSFI. Sun et al7 translated the FSFI into Chinese and demonstrated that the Chinese version of the FSFI (CVFSFI) is a reliable and a valid questionnaire for measuring FSD in Chinese women. The FSFI is a 19-item questionnaire for assessing 6 domains of sexual function, including desire, arousal, lubrication, orgasm, satisfaction, and pain.8 Lower scores point to worse sexual function. Although the FSFI has strong measurement properties owing to the simple factor structure and right internal consistency,9 it was criticized for biased results of sexually inactive women and evident conceptual problems with the desire domain.9,10
The Golombok Rust Inventory of Sexual Satisfaction (GRISS) includes domains of interaction between sexual partners, making up for the deficiency in the FSFI. It is a 56-item (28 items for men and 28 for women) inventory designed to evaluate sexual function within a heterosexual relationship.11 Seven subscales for women are as follows: female nonsensuality (NSF), female avoidance (AVF), infrequency (INF), female dissatisfaction (DIS), female noncommunication (NCO), vaginismus (VAG), and anorgasmia (ANO). Its overall and individual subscale scores are separately transformed into standardized stanine scores. A score of 5 or above indicates a problem. The GRISS is cherished for its superior reliability and validity,12 whereas little literature using it was reported in China.
In addition, test-retest reliability for DIS in the GRISS was only 0.47, while the most substantial relation for the satisfaction domain in the FSFI was observed in the Locke-Wallace Marital Adjustment Test.13 In terms of merits and drawbacks of the 2 questionnaires, applications of different scales are needed to delineate the current status of FSD among Chinese women without hyperlipidemia. Because the agreement between the FSFI and GRISS for the diagnosis of sexual dysfunction was 28.6%,14 we assigned women defined as FSD by both two questionnaires to the FSD group.
Aim
Our investigation aimed to find out the characteristics of the sexual function in premenopausal Chinese women without hyperlipidemia using the FSFI and the GRISS.
Materials and Methods
Study Population
The study was cross-sectional conducted from January 2019 through March 2019 at the health management center of the Third Xiangya Hospital of Central South University. We investigated 216 consecutive women who came for health checkups. Twenty-one women among them were excluded for hyperlipidemia in accordance with the Chinese guidelines.15 One hundred ninety-five women were ultimately involved in our study. All the participants had lived locally for >5 years, maintained a heterosexual relationship for ≥2 years, and had sexual activity in the past 4 weeks. (Sexual activity16 was defined as “any mutually voluntary activity with another person that involves sexual contact, whether or not intercourse or orgasm occurs.”) They had to be premenopausal and able to understand and participate in the survey. In accordance with the criteria of the Stages of Reproductive Aging Workshop17 (STRAW 10), menopausal status was defined as follows: premenopause, having regular menses; menopausal transition, a persistent ≥7-day difference in length of consecutive cycles and persistence referred to recurrence within 10 cycles of the first variable length cycle; and postmenopause, absent menses for ≥12 months. Premenopausal Chinese women were selected by menstrual history taking. The exclusion criteria were pregnancy, breastfeeding, pelvic surgery, psychiatric disorders (eg, depression, sexual distress, and psychological comorbidities), the use of medication affecting sexual functions (eg, psychotropic or hormonal medications), the presence of special or malignant diseases (eg, genital tract abnormalities, endometriosis, breast diseases, and tumors), and hyperlipidemia. All respondents provided written informed consent. This study was approved by the ethics committees at the Third Xiangya Hospital of Central South University.
Measures
A general questionnaire was completed to collect the sociodemographic data and information regarding lifestyle factors. The sociodemographic data included age, education level, occupation, marital status, childbearing history, smoking, alcohol drinking, hypertension, and diabetes mellitus. Lifestyle factors are as follows: having meals on time (yes/no), having night snacks frequently (yes/no), dining out (never/rarely/monthly/weekly/regularly/daily), binge eating (yes/no), personal taste (bland/salty/hard to tell), staple food (mainly rice/roughage and rice/mainly roughage/hard to tell), drinking milk (never/rarely/monthly/weekly/regularly/daily), eating eggs (never/rarely/monthly/weekly/regularly/daily), bean product intake (never/rarely/monthly/weekly/regularly/daily), fruit intake (monthly/weekly/regularly/daily), vegetable intake (<100/100–200/>200g per day), lean meat intake (<50/50–100/>100g per day), fat meat intake (never/rarely/monthly/weekly/regularly/daily), innards intake (never/rarely/monthly/weekly/regularly/daily), fish or seafood intake (never/rarely/monthly/weekly/regularly/daily), coffee intake (never/rarely/monthly/weekly/regularly/daily), and sugary drink intake (never/rarely/monthly/weekly/regularly/daily).
The results of health checkups were obtained from participants: physical examination (body mass index [BMI], waist circumference, hip circumference, systolic blood pressure, and diastolic blood pressure) and gynecologic examination (hydrogen peroxide–positive, vaginal cleaning degree: III, N-acetylgalactosaminidase–positive, leukocyte esterase–positive, trichomonas-positive, mold-positive, increase of pH value, HPV-positive, decreased pelvic floor muscle strength, decreased fatigue strength, dynamic pelvic floor pressure–abnormal, poor pelvic floor coordination, stress urinary incontinence, human mycoplasmas–positive, ureaplasmas-positive, chlamydia-positive). Venous blood samples were drawn after fasting for ≥8h to check for biochemical tests (fasting blood glucose, alanine aminotransferase [ALT], aspartate aminotransferase [AST], total bilirubin [TB], conjugated bilirubin [CB], serum total bile acids [TBA], serum total protein [TP], serum albumin [Alb], serum globulin [Glo], blood urea nitrogen [BUN], Creatinine [Cr], uric acid [UA], total cholesterol [TC], total triglyceride [TG], HDL cholesterol, and low-density lipoprotein cholesterol [LDL]).
The subjects' sexual function was assessed by the FSFI and the GRISS. For the FSFI, the Chinese cutoff was ≤23.45 for the overall score, ≤2.7 for low desire, ≤3.15 for arousal disorder, ≤4.05 for lubrication disorder, ≤3.8 for orgasm disorder, ≤3.8 for sexual pain, and ≤3.6 for dissatisfaction.18 For the GRISS, a subscale score of 5 or above was considered as the corresponding sexual problem.11 Women whose FSFI overall scores were ≤23.4518 and GRISS overall scores ≥511 were assigned to the FSD group, while the remaining were assigned to the control group.
Statistical Analysis
The quantitative values such as age, BMI, biochemical parameters, and scores of the 2 questionnaires were analyzed by independent-sample t-test. The Pearson chi-squared test was conducted to compare sociodemographic data except for age, lifestyle factors, gynecologic examination data, and prevalence of sexual dysfunction between the FSD group and the control group. We also applied multiple logistic regression with forced entry method to analyze binge eating and Alb level for FSD. Binary logistic regression with forced entry method was used to model the likelihood of each domain (eg, low desire and NSF). These models adjusted for age as well as education level and selected lipid profiles separately as covariates. Age was categorized into 2 subgroups (<40y and ≥40y) in the logistic regression analyses. Because the mechanism of our missing data was missing completely at random, we used pairwise deletion that could not cause bias (eg, underestimated mean).19 SPSS (Statistical Package for Social Sciences, version 17.0) was used for statistical analyses. A P value of < .05 was considered to be statistically significant.
Results
Sociodemographic Characteristics
The sociodemographic characteristics of 195 survey respondents are shown in Table 1 . The prevalence of FSD in our study was 46.2%. The mean age was 38.07 ± 6.94 years. As many studies reported, age and education level were significantly different between the 2 groups (P < .01). Moreover, the proportion of women with higher education in the FSD group was higher than that in the control group. The 2 groups were comparable concerning marital status, childbearing history, smoking and alcohol drinking habits, hypertension, and diabetes.
Characteristics of 195 survey respondents in the two groups
| Characteristic | FSD (N = 90) | Control (N = 105) | P value |
|---|---|---|---|
| Age∗, y (SD) | 36.6 (6.6) | 39.4 (7.0) | .005 |
| Education level∗, No. (%) | <.001 | ||
| Primary or less | 4 (4.4) | 22 (21.0) | |
| Intermediate | 15 (16.7) | 18 (17.1) | |
| Secondary | 16 (17.8) | 28 (26.7) | |
| Higher education | 55 (61.1) | 37 (35.2) | |
| Occupation, No. (%) | .264 | ||
| Official | 16 (17.8) | 12 (11.4) | |
| Clerk | 34 (37.8) | 31 (29.5) | |
| Worker/farmer | 10 (11.1) | 21 (20.0) | |
| Self-employed | 8 (8.9) | 10 (9.5) | |
| Others | 22 (24.4) | 31 (29.5) | |
| Marital status, No. (%) | .776 | ||
| Single | 3 (3.3) | 3 (2.9) | |
| Married | 84 (93.3) | 96 (91.4) | |
| Divorced/Widowed | 3 (3.3) | 6 (5.7) | |
| Childbearing history, No. (%) | .311 | ||
| With one or no child | 55 (61.1) | 56 (53.3) | |
| With two or more children | 35 (38.9) | 49 (46.7) | |
| Smoking, No. (%) | .346 | ||
| Ex-regular/current regular | 3 (3.3) | 7 (6.7) | |
| Alcohol drinking, No. (%) | .789 | ||
| Ex-regular/current regular | 6 (6.7) | 9 (8.6) | |
| Hypertension, No. (%) | .738 | ||
| Yes | 2 (2.2) | 3 (2.9) | |
| No | 83 (92.2) | 93 (88.6) | |
| Unknown | 5 (5.6) | 9 (8.6) | |
| Diabetes mellitus, No. (%) | .178 | ||
| Yes | 0 | 0 | |
| No | 83 (92.2) | 90 (85.7) | |
| Unknown | 7 (7.8) | 15 (14.3) |
FSD = female sexual dysfunction; SD = standard deviation.
P < .05.
The FSFI and the GRISS
The number of women with FSD was 130 and 127 in accordance with the FSFI and GRISS overall score, respectively. The FSFI and the GRISS overall scores between the 2 groups were 18.62 ± 5.20 vs 22.85 ±5.18 (P < .001) and 6.19 ± 0.79 vs 4.59 ± 1.73 (P < .001), respectively. The mean FSFI scores of each domain in the FSD group were lower than those in the control group, for 3.45 ± 0.99 vs 4.26 ± 0.92 in desire (P < .001), 2.31 ± 1.07 vs 3.41 ± 1.13 in arousal (P < .001), 3.32 ± 1.31 vs 3.87 ± 1.19 in lubrication (P = .002), 2.99 ± 1.18 vs 3.73 ± 1.22 in orgasm (P < .001), 2.00 ± 0.99 vs 2.99 ± 1.18 in satisfaction (P < .001), 4.56 ± 1.69 vs 4.58 ± 1.68 in pain (P = .939), respectively (Figure 1A). However, not all these 6 domains in the FSFI were statistically significant. No significant difference was observed in pain (P = .939). The remaining 5 fields had a P-value less than .01. The GRISS scores, except in DIS, were significantly higher in the FSD group, for 6.14 ± 1.57 vs 4.80 ± 1.69 in NSF (P < .001), 6.18 ± 1.25 vs 4.52 ± 1.79 in AVF (P < .001), 6.08 ± 1.35 vs 4.76 ± 1.74 in INF (P < .001), 5.56 ± 1.63 vs 4.69 ± 1.98 in NCO (P = .001), 5.77 ± 1.47 vs 4.56 ± 1.79 in VAG (P < .001), 5.98 ± 1.13 vs 4.63 ± 1.83 in ANO (P < .001), respectively (Figure 1B). Only DIS showed no significant difference between the groups (5.35 ± 1.54 vs 4.95 ± 1.98, P = .113). Besides, Figure 1C and 1D reflected the prevalence of sexual dysfunction based on the scores of the 2 questionnaires. Prevalence of 6 domains in the FSFI fluctuated much, while the GRISS was relatively steady. We found that dissatisfaction remained the most common issue for the control group in both the FSFI and the GRISS (90.50% and 58.10%, respectively). However, the prevalence of DIS in the GRISS was comparable between the groups (62.20% vs 51.80%, P = .558), which was not consistent with the result of the FSFI satisfaction domain (100% vs 90.5%, P = .003). There was no significance in the FSFI for sexual pain (21.10% vs 17.10%, P = .481). More women with FSD had orgasm disorder than those in the control group, for 83.3% vs 35.2% in the FSFI (P < .001), 88.9% vs 54.3% in the GRISS (P < .001), respectively. The prevalence of NCO as the lowest in both groups was 58.9% for the FSD group, and 42.9% for the control group.
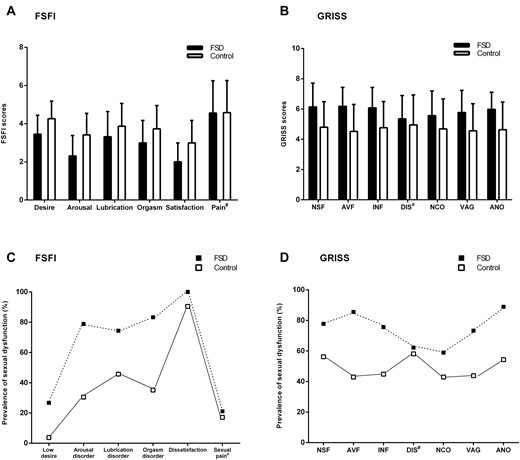
Comparison of each domain in the two groups. (A) FSFI scores of the individual domain in women of the two groups (N=195). The p value in each domain was <0.001 in desire, <0.001 in arousal, 0.002 in lubrication, <0.001 in orgasm, <0.001 in satisfaction, 0.939 in pain. (B) GRISS scores of individual subscale in women of the two groups (N=195). The p value in each domain was <0.001 in NSF, <0.001 in AVF, <0.001 in INF, 0.113 in DIS, 0.001 in NCO, <0.001 in VAG, <0.001 in ANO. (C) The prevalence of sexual dysfunction according to FSFI scores. The p value in each domain was <0.001 in low desire, <0.001 in arousal disorder, <0.001 in lubrication disorder, <0.001 in orgasm disorder, 0.003 in dissatisfaction, 0.481 in sexual pain. (D) The prevalence of sexual dysfunction according to GRISS scores. The p value in each domain was 0.001 in NSF, <0.001 in AVF, <0.001 in INF, 0.558 in DIS, 0.026 in NCO, <0.001 in VAG, <0.001 in ANO. Data of FSFI and GRISS scores represent the mean ± standard deviation. #P > 0.05.Abbreviations: NSF, female nonsensuality; AVF, female avoidance; INF, female infrequency; DIS, dissatisfaction; NCO, noncommunication; VAG, vaginismus; ANO, anorgasmia.
Lifestyle Factors
We also studied lifestyle factors among premenopausal Chinese women without hyperlipidemia (Table 2 ). Binge eating was significantly different between the groups (P = .023). It suggested that 6 of 8 women with FSD and 1 of 2 women without FSD who reported binge eating had a higher education level. Hence, subsequent analyses were adjusted for age and education level. Before adjusted, binge eating was a risk factor for FSD (odds ratio [OR], 5.29; 95% confidence interval [CI], 1.09–25.73; P = .039). It was no longer significant after adjustment for age and education level (OR, 5.33; 95% CI, 0.94–30.35; P = .059). The remaining lifestyle factors (eg, personal taste and coffee) did not differ from the groups.
Comparison of lifestyle factors between the FSD group and the control group
| Items | FSD (N = 6), No. (%) | Control (N = 92), No. (%) | P value |
|---|---|---|---|
| Having meals on time | .826 | ||
| Yes | 50 (65.8) | 62 (67.4) | |
| No | 26 (34.2) | 30 (32.6) | |
| Having night snacks frequently | .273 | ||
| Yes | 22 (28.9) | 34 (37.0) | |
| No | 54 (71.1) | 58 (63.0) | |
| Dining out | .332 | ||
| Never/rarely/monthly | 61 (80.3) | 79 (85.9) | |
| Weekly/regularly/daily | 15 (19.7) | 13 (14.1) | |
| Binge eating | .023∗ | ||
| Yes | 8 (10.5) | 2 (2.2) | |
| No | 68 (89.5) | 90 (97.8) | |
| Personal taste | .349 | ||
| Bland | 31 (40.8) | 42 (45.7) | |
| Salty | 24 (31.6) | 20 (21.7) | |
| Hard to tell | 21 (27.6) | 30 (32.6) | |
| Staple food | .103 | ||
| Mainly rice | 25 (32.9) | 32 (34.8) | |
| Roughage and rice | 27 (35.5) | 41 (44.6) | |
| Mainly roughage | 10 (13.2) | 3 (3.3) | |
| Hard to tell | 14 (18.4) | 16 (17.4) | |
| Drinking milk | .059 | ||
| Never/rarely | 30 (39.5) | 23 (25) | |
| Monthly | 37 (48.7) | 48 (52.2) | |
| Weekly/regularly/daily | 9 (11.8) | 21 (22.8) | |
| Eating eggs | .430 | ||
| Never/rarely/monthly | 41 (53.9) | 44 (47.8) | |
| Weekly/regularly/daily | 35 (46.1) | 48 (52.2) | |
| Bean product intake | .435 | ||
| Never/rarely/monthly | 57 (75) | 64 (69.6) | |
| Weekly/regularly/daily | 19 (25) | 28 (30.4) | |
| Fruit intake | .121 | ||
| Monthly/Weekly | 29 (38.2) | 25 (27.2) | |
| Regularly | 39 (51.3) | 48(52.2) | |
| Daily | 8 (10.5) | 19 (20.7) | |
| Vegetable intake (per d) | .652 | ||
| <100g | 13 (17.1) | 14 (15.2) | |
| 100–200g | 47 (61.8) | 53 (57.6) | |
| >200g | 16 (21.5) | 25 (27.2) | |
| Lean meat intake (per d) | .279 | ||
| <50g | 22 (28.9) | 24 (26.1) | |
| 50–100g | 41 (53.9) | 59 (64.1) | |
| >100g | 13 (17.1) | 9 (9.8) | |
| Fat meat intake | .399 | ||
| Never/rarely/monthly | 38 (50) | 52 (56.5) | |
| Weekly/regularly/daily | 38 (50) | 40 (43.5) | |
| Innards intake | .691 | ||
| Never/rarely/monthly | 21 (27.6) | 28 (30.4) | |
| Weekly/regularly/daily | 55 (72.4) | 64 (69.6) | |
| Fish or seafood intake | .742 | ||
| Never/rarely/monthly | 57 (75) | 71 (77.2) | |
| Weekly/regularly/daily | 19 (25) | 21 (22.8) | |
| Coffee intake | .417 | ||
| Never/rarely/monthly | 61 (80.3) | 69 (75) | |
| Weekly/regularly/daily | 15 (19.7) | 23 (25) | |
| Sugary drink intake | .116 | ||
| Never/rarely/monthly | 48 (63.2) | 47 (51.1) | |
| Weekly/regularly/daily | 28 (36.8) | 45 (48.9) | |
| Physical activity | .906 | ||
| Yes | 42 (55.3) | 50 (54.3) | |
| No | 34 (44.7) | 42 (45.7) | |
| Type of physical activity | .892 | ||
| Walking | 20 (47.6) | 23 (46.0) | |
| Jogging | 7 (16.7) | 7 (14.0) | |
| Others | 15 (35.7) | 20 (40.0) | |
| Frequency of physical activity | .370 | ||
| Weekly | 35 (83.3) | 45 (90.0) | |
| Regularly | 7 (16.7) | 5 (10.0) | |
| Duration of physical activity (per time) | .448 | ||
| <0.5 h | 8 (19.0) | 15 (30.0) | |
| 0.5–1 h | 28 (66.7) | 30 (60.0) | |
| >1 h | 6 (14.3) | 5 (10.0) | |
| Duration of keeping exercising | .320 | ||
| <1 y | 12 (28.6) | 21 (42.0) | |
| 1–5 y | 17 (40.5) | 19 (38.0) | |
| >5 y | 13 (30.9) | 10 (20.0) |
FSD = female sexual dysfunction.
Weekly (1-3 days/week); regularly (≥ 4 days/week).
P < .05.
Health Checkups
Table 3 lists the results of health checkups. There was no significant difference in physical examination, kidney function tests, and gynecologic examination. The Alb level was higher in the FSD group (45.4 vs 44.3, P = .003), but the Alb levels in both groups were normal. The multiple logistic regression analyses showed that it was not an independent factor for FSD; AST, CB, and TBA were confounders for the Alb level (data not shown). Besides, pelvic floor function deserved more attention despite no significance observed. The prevalence of decreased pelvic floor muscle strength, reduced fatigue strength, and poor pelvic floor coordination were more than 80% in the 2 groups.
Parameters of health checkups in the FSD group and the control group
| Parameters | FSD (N = 90), Mean (SD) | Control (N = 105), Mean (SD) | P value |
|---|---|---|---|
| Physical examination | |||
| Body mass index (BMI), kg/m2 | 22.7 (3.7) | 22.9 (3.4) | .611 |
| Waist circumference (WC), cm | 74.9 (7.3) | 75.8 (7.2) | .423 |
| Hip circumference (HC), cm | 92.3 (5.1) | 92.7 (4.7) | .556 |
| Systolic blood pressure (SBP), mmHg | 111.2 (15.0) | 112.5 (13.7) | .574 |
| Diastolic blood pressure (DBP), mmHg | 67.6 (10.1) | 67.8 (9.9) | .886 |
| Biochemical tests | |||
| Fasting blood glucose (FBG), mmol/L | 5.3 (0.5) | 5.2 (0.5) | .689 |
| Alanine aminotransferase (ALT), U/L | 19.9 (11.5) | 16.8 (9.5) | .235 |
| Aspartate aminotransferase (AST), U/L | 18.5 (5.9) | 19.0 (6.0) | .640 |
| Total bilirubin (TB), μmol/L | 12.4 (4.7) | 12.4 (4.4) | .952 |
| Conjugated bilirubin (CB), μmol/L | 3.8 (1.8) | 3.5 (1.6) | .347 |
| Serum total bile acids (TBA), μmol/L | 3.9 (2.6) | 3.0 (2.5) | .182 |
| Serum total protein (TP), g/L | 71.7 (3.7) | 70.9 (4.1) | .179 |
| Serum albumin (Alb), g/L | 45.4 (2.5) | 44.3 (2.3) | .003∗ |
| Serum globulin (Glo), g/L | 26.3 (3.2) | 26.6 (3.1) | .506 |
| Blood urea nitrogen (BUN), mmol/L | 4.3 (1.0) | 4.3 (1.3) | .992 |
| Creatinine (Cr), μmol/L | 58.7 (8.5) | 60.3 (8.3) | .220 |
| Uric acid (UA), μmol/L | 269.9 (47.1) | 272.4 (60.0) | .759 |
| Total cholesterol (TC), mmol/L | 4.6 (0.7) | 4.6 (0.7) | .829 |
| Total triglyceride (TG), mmol/L | 1.0 (0.4) | 1.0 (0.4) | .852 |
| High-density lipoprotein (HDL) cholesterol, mmol/L | 1.5 (0.3) | 1.5 (0.3) | .734 |
| Low-density lipoprotein (LDL) cholesterol, mmol/L | 2.6 (0.6) | 2.7 (0.6) | .720 |
| Gynecologic examination, % | |||
| Hydrogen peroxide–positive | 100 | 100 | |
| Vaginal cleaning degree: III | 14.1 | 16.9 | .650 |
| N-acetylgalactosaminidase–positive | 4.7 | 2.8 | .566 |
| Leukocyte esterase–positive | 9.4 | 15.5 | .285 |
| Trichomonas-positive | 0 | 0 | |
| Mold-positive | 4.7 | 2.8 | .566 |
| Increase of pH value | 9.4 | 14.1 | .398 |
| HPV-positive | 19.5 | 11.7 | .152 |
| Decreased pelvic floor muscle strength | 100 | 100 | |
| Reduced fatigue strength | 96.6 | 98.0 | .534 |
| Dynamic pelvic floor pressure–abnormal | 29.5 | 32.4 | .677 |
| Poor pelvic floor coordination | 87.5 | 94.1 | .111 |
| Stress urinary incontinence | 40.9 | 49.0 | .263 |
| Human mycoplasmas–positive | 5.6 | 6.4 | .842 |
| Ureaplasmas-positive | 19.7 | 28.2 | .277 |
| Chlamydia-positive | 0 | 2.6 | .174 |
The values presented are either mean (SD) or percentage (%).
HPV = human papilloma virus; TCT = thinprep cytologic test.
P < .05.
Lipid Profiles
We selected lipid profiles as explanatory variables to further investigate the relationship with FSD because some literature1,3–6 reported that lipid profiles correlated with FSD. However, lipid profiles were not related to FSD in our univariate analyses (Table 3). Multiple logistic regression analyses are shown in Table 4 . The TC level was positively associated with low desire (OR, 2.13; 95% CI, 1.10–4.13; P = .025) and so was LDL level (OR, 2.18; 95% CI, 1.03–4.62; P = .041). We subsequently used TC and LDL levels into the model for desire, but these 2 levels became insignificant (P = .294 and P = .923, respectively). The HDL level was inversely associated with INF (OR, 0.18; 95% CI, 0.06–0.59; P = .004). Moreover, TC, TG, and LDL levels were not confounding variables for HDL level (Table 5 ).
Adjusted odds ratio of lipid profiles for each domain in the FSFI and the GRISS
| Domains | TC | TG | HDL | LDL |
|---|---|---|---|---|
| FSFI | ||||
| Low desire | 2.13(1.10–4.13)∗ | 1.49(0.54–4.12) | 1.82(0.42–7.84) | 2.18(1.03–4.62)∗ |
| Arousal disorder | 1.12(0.73–1.74) | 0.77(0.36–1.66) | 1.46(0.50–4.28) | 1.13(0.68–1.89) |
| Lubrication disorder | 1.23(0.80–1.91) | 0.83(0.38–1.77) | 0.93(0.32–2.67) | 1.41(0.84–2.36) |
| Orgasm disorder | 1.05(0.70–1.67) | 1.08(0.50–2.34) | 1.47(0.50–4.35) | 1.01(0.60–1.67) |
| Dissatisfaction | 1.35(0.54–3.35) | 0.54(0.12–2.45) | 1.76(0.16–19.16) | 1.53(0.51–4.58) |
| Sexual pain | 1.03(0.60–1.77) | 0.56(0.20–1.59) | 1.82(0.47–7.02) | 1.03(0.54–1.94) |
| GRISS | ||||
| NSF | 0.85(0.54–1.35) | 1.52(0.65–3.56) | 1.07(0.35–3.33) | 0.73(0.43–1.25) |
| AVF | 0.68(0.43–1.07) | 0.85(0.38–1.89) | 0.98(0.32–2.95) | 0.61(0.36–1.05) |
| INF | 0.68(0.43–1.08) | 1.27(0.56–2.87) | 0.18(0.06–0.59)∗ | 0.83(0.49–1.41) |
| DIS | 0.83(0.53–1.28) | 1.65(0.74–3.68) | 0.58(0.20–1.68) | 0.79(0.48–1.33) |
| NCO | 0.70(0.45–1.10) | 1.13(0.52–2.46) | 1.03(0.36–2.97) | 0.60(0.35–1.02) |
| VAG | 0.84(0.54–1.30) | 1.26(0.58–2.76) | 1.58(0.53–4.69) | 0.68(0.40–1.13) |
| ANO | 1.18(0.73–1.91) | 1.28(0.53–3.09) | 1.11(0.34–3.62) | 1.17(0.67–2.04) |
The values presented are the adjusted odds ratio (95% confidence interval).
AVF = female avoidance; ANO = anorgasmia; DIS = female dissatisfaction; FSFI = Female Sexual Function Index; GRISS = Golombok Rust Inventory of Sexual Satisfaction; HDL = high-density lipoprotein; INF = infrequency; LDL = low-density lipoprotein; NCO = female noncommunication; NSF = female nonsensuality; TC = total cholesterol; TG = total triglyceride; VAG = vaginismus.
P < .05.
Binary logistic regression analysis of HDL for INF
| Variables | Adjusted odds ratio (95% CI) | P-value |
|---|---|---|
| Model 1 | ||
| HDL level | 0.18 (0.06-0.59) | .004 |
| Model 2 | ||
| HDL level | 0.21 (0.06-0.73) | .014 |
| TC level | 0.85 (0.52-1.41) | .537 |
| Model 3 | ||
| HDL level | 0.18 (0.06-0.60) | .005 |
| LDL level | 0.86 (0.50-1.48) | .576 |
| Model 4 | ||
| HDL level | 0.17 (0.05-0.58) | .005 |
| TG level | 0.83 (0.34-2.02) | .685 |
| Model 5 | ||
| HDL level | 0.23 (0.03-1.64) | .143 |
| LDL level | 1.18 (0.14-9.98) | .883 |
| TC level | 0.74 (0.10-5.37) | .738 |
HDL = high-density lipoprotein; INF = infrequency; LDL = low-density lipoprotein; TC = total cholesterol; TG = total triglyceride.
Discussion
Sexual dysfunctions are a heterogeneous group of disorders that are typically characterized by a clinically significant disturbance in a person's ability to respond sexually or to experience sexual pleasure.20 Women with hyperlipidemia have more FSD than women without hyperlipidemia.21 However, whether higher or lower lipid levels in the normal range would have impacts on FSD remains to be determined. Our univariate analyses showed no correlation between lipid profiles and FSD in premenopausal Chinese women without hyperlipidemia. Artini Abidin found lipid levels were not related to FSD among overweight and obese women.22 It can reasonably be inferred that the effect of lipid levels on FSD may not be overt in women with and without hyperlipidemia, respectively. However, this effect may be more pronounced when comparing the two. Our further study detected that HDL was a protective factor for INF among premenopausal Chinese women without hyperlipidemia. But caution is warranted because the rest of our results indicated that lipid levels are not associated with FSD and its domains.
The FSFI and GRISS have significant domain discrimination.14 They consistently reflected 2 findings in this study: (i) Dissatisfaction as the most common problem influenced over half of the women without FSD and (ii) The prevalence of orgasm disorder in the FSD group substantially increased to more than 80%, compared with that in the control group. A study of 400 healthy women showed that the prevalence of dissatisfaction was 77.7% and considered as the most common area of difficulty.23 Satisfaction with the amount of closeness with a partner, with a sexual relationship, and with overall sex life is involved in the evaluation. It suggested that sexual dissatisfaction was highly correlated with marital dissatisfaction.24 A population-based epidemiological survey in Beijing showed that dissatisfaction with the spouse's sexual ability (OR = 3.520) and with married life (OR = 1.476) were risk factors for FSD.25 A study by Zhang et al26 that was conducted on reproductive-aged Chinese married women in Hong Kong reported the same results. We discovered that sexual dissatisfaction was as well a severe sexual problem. As marital dissatisfaction could have negative impacts on the occurrence and development of FSD, more attention should be paid to dissatisfaction of Chinese women. In another aspect, orgasm is defined as a sensation of intense pleasure resulting in a physiologic reaction and sensations of well-being and contentment.27 A proportion of 60.5% of our participants were younger than 40 years, and younger women were more likely to have difficulty with orgasm than older women,28 which could interpret the high prevalence of anorgasmia in the survey.
Echeverry et al,29 Zhang et al,30 and Laumann et al31 demonstrated that lower education level increased risk of having FSD while Addis et al32 found that a higher education level was correlated with an increase in overall dysfunction. Our survey was consistent with the latter. McCool et al1 systematically sought observational studies on the prevalence of FSD in premenopausal women in relevant databases (January 2000 through July 2014) and revealed that illiteracy and unemployment were positively associated with FSD.1 Education level is inconclusive. Better-educated women pay more attention to sexual consciousness and property rights and are more able to express their appeal and dissatisfaction,25 which is of great benefit to sexual health. Furthermore, most better-educated Chinese women are office ladies instead of housewives. Stress and irregular schedules may change their endocrine and psychological status to increase the risk of FSD,31 which could be supported by our results that women with higher education level were more likely to have binge eating. Binge eating episodes serve to reduce negative effect by providing short-term comfort and/or distraction.33 Psychological distress and anxiety co-occur with binge eating disorder.34 Likewise, FSD is related to psychological factors such as depression. Higher anxiety scores inversely correlated with sexuality.35 Despite no participants with mental disorders in our study, binge eating as a symptom rather than a disorder is still worth considering because negative mood serves as a crucial antecedent of binge eating episodes.36
Pelvic floor muscle functioning is closely linked to healthy female sexuality.37 FSD often associated with concomitant pelvic floor disorders. Salonia et al38 revealed that the prevalence of FSD was 46% in women with urinary incontinence. The presence of urinary incontinence resulted in lower FSFI domain scores.39 Because of the conservative attitudes toward sex, limited data of pelvic floor dysfunction with FSD were available in China. An observational study on 648 patients with pelvic floor dysfunction uncovered that pelvic organ prolapse and stress urinary incontinence were common among the older Chinese women and were associated with decreased sexual satisfaction.40 We discovered that most Chinese women had poor pelvic floor function. This can result partly from vaginal delivery with episiotomy. The rate of episiotomy in China was 36.9% based on an epidemiologic study.41 None of the multiparae in our survey had a history of cesarean section, and specific data regarding traumatic events happened in delivery were not obtained. Hence, it is noteworthy for clinicians to focus on this issue.
The present study had several limitations. We did not collect the specific reasons for sexual dissatisfaction, which could help identify this problem. The partners were not included in our analyses, which could have provided more detailed data about sexual satisfaction. In addition, some participants had gynecological infections that might affect the evaluation of sexual health. But their scores were comparable with those in the population without gynecological infections (23.46 ± 2.66 vs 20.65 ± 6.07 in the FSFI, P = .306; 4.18 ± 3.06 vs 5.31 ± 1.67 in the GRISS, P = .457). Although these women came for health checkups without apparent clinical symptoms of gynecological infections, we still recruited them. However, we did not have further follow-up data on whether they have undergone adequate therapy and subsequent re-evaluation.
In conclusion, FSD is frequent in premenopausal Chinese women without hyperlipidemia. Dissatisfaction as the common problem influenced over half of them, and orgasm disorder is a severe sexual issue for women with FSD.
Statement of Authorship
Category 1
Conception and Design
Yali Xiang
Acquisition of Data
Yuxin Tang
Analysis and Interpretation of Data
Jiaqun Li
Category 2
Drafting the Article
Jiaqun Li
Revising It for Intellectual Content
Dongjie Li
Category 3
Final Approval of the Completed Article
Yali Xiang
Supplementary Data
Supplementary data related to this article can be found at https://doi.org/10.1016/j.esxm.2019.10.004.
Funding This research was supported by funding from the National Natural Science Foundation of China (81571432, Y.Tang).
References
Author notes
Conflict of Interests: The authors report no conflict of interest.
