


Abstract
Urinary incontinence (UI) has been associated with negative effects on women's sexuality. Women's sexuality and sexual function are a complex issue, and the role of UI is not completely clear.
To assess the impact of UI on female sexual function by comparing this population with a control group of continent women.
We performed a case-control study from August 2012 to September 2013. We evaluated continent and incontinent women (age range = 30–70 years) for their sexuality.
All patients were evaluated by anamnesis, physical examination, and self-report quality-of-life questionnaires. In addition, incontinent women underwent a 1-hour pad test. Patients without sexual activity were evaluated for the role of UI in their sexual abstinence. Sexual abstinence was defined as the absence of sexual activity for more than 6 months. All sexually active women completed the self-report Sexuality Quotient–Female Version (SQ-F) questionnaire.
A total of 356 women were included in the study (incontinent, n = 243; continent, n = 113). Sexual abstinence was found in 162 women (45%). Incontinent women presented a higher prevalence (P < .001) of sexual abstinence than their counterparts (129 [53%] and 33 [29.2%], respectively). Age, marital status, and UI were found to be isolated predictive factors for more sexual abstinence in incontinent women. Sexually active women (incontinent, n = 114; continent, n = 80) presented similar demographic data. Despite a similar frequency of sexual activity, incontinent women had less sexual desire, foreplay, harmony with a partner, sexual comfort, and sexual satisfaction than their counterparts. Women with greater urinary leakage during the 1-hour pad test (weight > 11 g) had the worst sexual function (SQ-F) score.
Women with UI were more likely to be sexual abstinent than continent women. Furthermore, women with UI showed less sexual desire, sexual comfort, and sexual satisfaction than their counterparts despite having a similar frequency of sexual activity.
Introduction
Urinary incontinence (UI) is a common disorder that affects a large number of women and their quality of life.1,2 A total of 423 million people worldwide are estimated to present with UI by 2018.3 UI can be classified based on symptoms: stress UI (SUI), urge UI (UUI), and mixed UI (MUI). To identify different types of incontinence, validated questionnaires have been developed and recommended as reproducible clinical research tools.2 Incontinent women have been reported to present urinary leakage during sexual penetration and orgasm, difficulties reaching orgasm, and less desire, lubrication, and satisfaction.4 For those women who experience leakage of urine during sexual activity, it has been suggested that UUI and SUI show a stronger association with leaking urine during orgasm and during penetration, respectively.5
Women's sexuality and sexual function are complex issues, and the role of UI is not completely clear. The effect of UI on sexuality is associated not only with leaking urine during sexual penetration or orgasm but also with several confounding variables, such as aging, pelvic surgery, hormonal influence, self-image perception, and chronic diseases, which are risk factors for sexual dysfunction and present a high prevalence in women with UI.5–8 Several attempts to control for such variables have been published.9–11 Shaw9 reported a 46% prevalence of sexual abstinence in incontinent women. Despite the high sexual abstinence rate in that study, the lack of a control group of continent women did not allow any major conclusion on the role of UI in sexual abstinence. In contrast, Tannenbaum et al10 observed that elderly women (mean age = 71 years) remained sexually active regardless of continence status in a large cross-sectional postal survey. However, the amount of urine loss, degree of SUI, and nocturnal incontinence affected sexual activity in that population. Schoenfeld et al11 evaluated sexual function in a group of German women with and without UI. They found that all women with UI were less sexually active than the healthy controls. However, the study did not present demographic data, such as marital status, educational level, and chronic diseases.
In the present study, we assessed the impact of UI on general female sexual function (desire and interest in sex, sexual excitement, harmony with the partner, comfort, satisfaction, and orgasm) by comparing incontinent women with a control group of continent women.
Methods
We performed a case-control study from August 2012 to September 2013. The university's local ethics committee approved the study, and all participants signed an informed consent. All patients included in the study were directly invited to participate. We recruited women with UI from the outpatient voiding dysfunction division of our department. Women without UI were recruited from the outpatient ophthalmology and cardiology departments at the same institution.
The inclusion criteria were women 30 to 60 years old with UI (SUI, UUI, or MUI) and without UI who voluntarily participated in the study for the case and control groups. The exclusion criteria were pregnancy, neurologic dysfunction, pelvic organ prolapse greater than stage II (Pelvic Organ Prolapse Quantification), urinary tract infection in the past 3 months, and cognitive dysfunction or poor comprehension.
All patients (incontinent and continent) were assessed by anamnesis and self-report questionnaires: the World Health Organization for Quality of Life (score range = 0–100; higher scores indicate better quality of life),12 the International Consultation on Incontinence Questionnaire–Short Form (score range = 0–21; higher scores indicate greater incontinence severity),13 and the Overactive Bladder Questionnaire (patients with overactive bladder are those with cumulative scores > 8).14 In addition, after completion of the self-report questionnaires, all incontinent women underwent 1-hour pad test and physical examination in accord with the International Continence Society recommendation.15
Sexual abstinence was defined as the absence of any sexual activity with a partner for more than 6 months. Sexual activity was defined not only by sexual intercourse but also by other modalities, such as oral sex and mutual masturbation with a partner.
Sexually Active Women Evaluation
All sexually active patients completed the Sexuality Quotient–Female Version (SQ-F). The SQ-F consists of 10 questions, including the main domains of female sexuality: desire, arousal, orgasm, and sexual comfort. The overall score ranges from 0 to 100; those with scores lower than 62 were considered as having a risk for sexual dysfunction.16
In addition, each patient was asked two questions to evaluate urinary leakage during sexual intercourse:
- 1.
Do you leak urine during sexual activity?
- 2.
Do you believe that leaking urine affects your sexual life?
Statistical Analysis
The sample size with 95% CI and 90% power was defined based on results from previous studies and a pilot study with 50 sexually active women at our institution.16 Statistical analysis was performed with SPSS 16.0 for Windows (SPSS, Inc, Chicago, IL, USA). Quantitative data were described as mean ± SD. The t-test and Mann-Whitney test were used for parametric and non-parametric data, respectively. Categorical variables were described as percentages and absolute values. The χ2 and Fisher tests were used, and multiple logistic regressions were performed to assess the predictive factors for sexual abstinence in incontinent women. Statistical significance was defined as a P value less than .05.
Results
We initially evaluated 400 women. The subject distribution is presented in Figure 1 and demographic data are presented in Table 1. Forty-four women did not fulfill the inclusion and exclusion criteria or refused to participate in the study. Of the 356 women included in the study, 162 (45%) were sexually abstinent. Sexual abstinence (P < .001) in incontinent women was statistically higher than in the continent group (129 [53%] and 33 [29.2%], respectively).
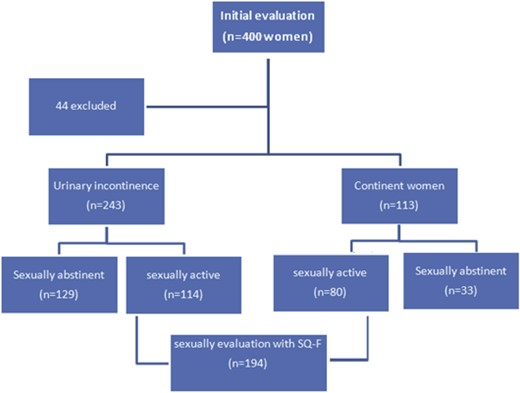
Study design and subject distribution.
Demographic data of study population
| Incontinent (n = 243) | Continent (n = 113) | P value | |
|---|---|---|---|
| Age (y), mean ± SD | 57.47 ± 10.62 | 55.81 ± 11.31 | .179 |
| Delivery, median (25–75 percentile) | 3 (2–5) | 2 (0–5) | .001 |
| Vaginal parity | 2 (0–3) | 1 (0–3) | .182 |
| Cesarean parity | 0 (0–1) | 0 (0–2) | .306 |
| BMI (kg/m2), mean ± SD | 28.77 ± 5.11 | 26.54 ± 4.65 | .043 |
| Marital status, % (n) | |||
| Single or divorced | 27 (67) | 32 (35) | |
| Married | 54 (131) | 53 (57) | .580 |
| Widow | 18 (44) | 15 (16) | |
| Education level, % (n) | |||
| Elementary school | 72 (177) | 60 (68) | |
| Middle school | 16 (38) | 21 (24) | .081 |
| High school | 11 (28) | 17 (21) | |
| Comorbidities, % (n) | |||
| Systemic arterial hypertension | 53 (71) | 61 (69) | .104 |
| Diabetes mellitus | 16 (40) | 11 (13) | .140 |
| Type of incontinence, % (n) | |||
| Stress UI | 28 (70) | — | |
| Urge UI | 12 (29) | — | |
| Mixed UI | 59 (144) | — | |
| WHOQOL-BREF, mean ± SD | 54 ± 18 | 68 ± 20 | .001 |
| ICIQ-SF, mean ± SD | 15 ± 5 | 0 | <.001 |
| OABV8, mean ± SD | 22 ± 9 | 5 ± 2 | <.001 |
| Sexual abstinence, % (n) | 53 (129) | 29 (33) | <.001 |
BMI = body mass index; ICIQ-SF = International Consultation on Incontinence Questionnaire–Short Form; OAB = Overactive Bladder Questionnaire; UI = urinary incontinence; WHOQOL-BREF = World Health Organization for Quality of Life.
Age, marital status, and UI were found as isolated predictive factors for more sexual abstinence. The presence of comorbidities, such as systemic hypertension or diabetes mellitus, and quality-of-life questionnaire score were not predictive factors for sexual activity. These data are presented in Table 2.
Predictive factors for sexual abstinence (in continent and incontinent women): multivariable analysis
| Sexually active (n = 194) | Sexually abstinent (n = 162) | Odds ratio (95% CI) | P value | |
|---|---|---|---|---|
| Age (y), mean ± SD | 52.65 ± 10.13 | 62.32 ± 9.54 | 1.136 (1.096–1.178) | <.001 |
| Single or divorced, % (n) | 19.5 (38) | 41.3 (64) | 1.689 (0.669–4.260) | <.001 |
| Married, % (n) | 73.3 (143) | 29 (45) | 0.168 (0.073–0.382) | .267 |
| Systemic arterial hypertension, % (n) | 52 (104) | 60 (94) | 1.692 (0.891–3.212) | .108 |
| Diabetes mellitus, % (n) | 13 (25) | 18 (28) | 1.053 (0.459–2.413) | .904 |
| Urinary incontinence symptoms, % (n) | 59.6 (118) | 79.1 (125) | 2.335 (1.040–5.245) | .040 |
| WHOQOL, mean ± SD | 73.14 ± 37.15 | 57.4 ± 25.02 | 0.988 (0.975–1.001) | .061 |
WHOQOL = World Health Organization for Quality of Life.
Sexually Active Women Evaluation
To understand the aspects of female sexuality, we analyzed the data of sexually active women after excluding the two groups of abstinent women. Demographic data for sexually active women are presented in Table 3.
Demographic data of sexually active women
| Incontinent (n = 114) | Continent (n = 80) | P value | |
|---|---|---|---|
| Age (y), mean ± SD | 52.0 ± 9.18 | 53.2 ± 10.1 | .398 |
| Delivery, median (25–75 percentile) | 3 (2–5) | 2 (1–4) | .002 |
| Vaginal parity | 2 (1–3) | 1 (0–3) | .127 |
| Cesarean parity | 0 (0–2) | 1 (0–2) | .926 |
| BMI (kg/m2), mean ± SD | 29.30 ± 4.70 | 27.21 ± 4.74 | .003 |
| Marital status, % (n) | |||
| Single or divorced | 13 (15) | 29 (23) | |
| Married | 81 (92) | 61 (47) | .009 |
| Widow | 6 (7) | 9 (7) | |
| Education level, % (n) | |||
| Elementary school | 69 (79) | 55 (44) | |
| Middle school | 17 (20) | 25 (19) | .221 |
| High school | 13 (15) | 21 (17) | |
| Previous disorder, % (n) | |||
| Systemic arterial hypertension | 47 (34) | 61 (49) | .039 |
| Diabetes mellitus | 13 (15) | 12 (10) | .104 |
| Type of incontinence, % (n) | |||
| Stress UI | 30 (34) | — | |
| Urge UI | 10 (11) | — | |
| Mixed UI | 60 (69) | — | |
| WHOQOL-BREF, mean ± SD | 55 ± 18 | 68 ± 19 | <.001 |
| ICIQ-SF, mean ± SD | 14 ± 4 | 0 | <.001 |
| OABV8, mean ± SD | 21 ± 9 | 4 ± 2 | <.001 |
BMI = body mass index; ICIQ-SF = International Consultation on Incontinence Questionnaire–Short Form; OAB = Overactive Bladder Questionnaire; UI = urinary incontinence; WHOQOL-BREF = World Health Organization for Quality of Life.
The 1-hour pad test showed 16 women (14%) without urinary leakage, 61 (53%) with a pad weight of 1 to 10 g, and 37 (32%) with a pad weight greater than 11 g. The correlation between severity of urinary leakage and sexual activity was evaluated. Women with greater urinary leakage by the 1-hour pad test (weight > 11 g) had the worst SQ-F scores (Figure 2).
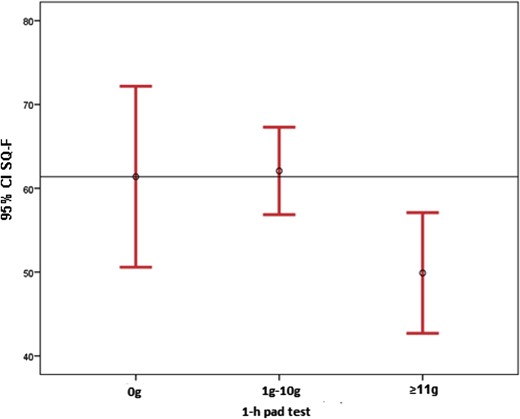
Correlation between 1-hour pad test result and Sexuality Quotient–Female Version (SQ-F) scores.
Of the 114 sexually active incontinent women, 52 (45.6%) self-reported urinary leakage during sexual intercourse. The mean SQ-F score was similar in women with and without urinary leakage during sexual activity (55.72 ± 20.62 and 56.12 ± 24.09, respectively; P = .552).
Despite a similar frequency of sexual activity, incontinent women had less sexual desire, foreplay, harmony with a partner, sexual comfort, and sexual satisfaction compared with their counterparts (continent women). The SQ-F scores are listed in Table 4.
SQ-F (total score)
| Domains | Incontinent (n = 114) | Continent (n = 80) | P value |
|---|---|---|---|
| SQ-F, mean ± SD | 58 ± 21.3 | 73.3 ± 20.6 | .001 |
| Intercourse frequency, median (range) | 4 (2–8) | 4 (1–8) | .675 |
| Sexual desire, mean ± SD | 1.98 ± 1.03 | 2.44 ± 1.18 | .001 |
| Foreplay, mean ± SD | 4.31 ± 1.82 | 5.11 ± 1.64 | .001 |
| Harmony with partner, mean ± SD | 3.73 ± 1.66 | 4.56 ± 1.81 | .001 |
| Sexual comfort, mean ± SD | 3.89 ± 1.53 | 4.82 ± 1.35 | .001 |
| Satisfaction and orgasm, mean ± SD | 3.32 ± 1.92 | 4.20 ± 1.76 | .001 |
SQ-F = Sexuality Quotient–Female Version.
Discussion
The present study was an observational study designed to identify factors that might contribute to sexual dysfunction in women with UI. Few studies have compared the sexuality of incontinent and continent women with similar demographic characteristics. Our findings showed that the worst sexual dysfunction scenario, which is abandoning a sexual life, in women with UI was significantly more prevalent than in their counterparts (53% vs 29%). When we evaluated sexually active women, the UI group had less sexual desire, sexual comfort, and sexual satisfaction than their counterparts, despite having a similar frequency of sexual activity. Leaking urine during sexual intercourse was reported as an embarrassing condition by 43% of incontinent women. We also observed that the severity of urinary loss seemed to have an impact on sexuality. Women who had urinary leakage greater than 11 g (during the 1-hour pad test) had the worst SQ-F scores.
Our results showed that women with UI were more likely to present with sexual abstinence. UI is one of several variables that could interfere with sexuality.17 Our results differed from a database analysis of a large cross-sectional postal survey, which showed that women remained sexually active regardless of their continence status. The different results could be a consequence of conducting the study in an elderly population of women (mean age = 71 years).10 We found a significant difference in sexual abstinence in continent and incontinent women with a mean age of 50 years in the present study, suggesting that UI could have a greater impact on sexuality in younger women.
In our study, the demographic data of continent and incontinent women were similar. However, women with UI had a higher body mass index and more vaginal deliveries compared with the continent group. Because obesity, pregnancy, and vaginal deliveries are risk factors for UI, these variables were expected to be more prevalent in women with UI.3,8,18 It highlights the challenge of having an adequate control group in such a study. The demographic differences could be associated with weaker pelvic floor musculature as a possible cause for sexual dysfunction in women with UI and should be addressed in future studies.18,19
Aging plays an important role in diminishing sexual activity, desire, and sexuality.7,10 The Women's International Study of Health and Sexuality (WISHeS) study showed that the proportion of women with low desire increased significantly with age, although the proportion of women distressed about their low desire decreased with age.20 Similarly, we found that age was an isolated predictive factor for sexual abstinence. However, we did not evaluate the accompanying distress. Most of our subjects were in middle age. Distress about lack of sexual activity has been observed to be higher in middle-age women than in younger and older patients.20,21 In 2006, the Prevalence and Correlates of Female Sexual Disorders and Determinants of Treatment Seeking (PRESIDE) showed that the prevalence of low desire associated with distress in middle-age women (45–64 years, 12.3%) was higher than that in younger women (18–44 years, 8.9%) or older women (>65 years, 7.4%).21 The impact of age on women’s sexual function and sexuality could be associated with premenopausal and menopausal status, which is followed by a significant decrease in estrogen and testosterone levels, which is associated with a weakening sex drive. In the present study, we did not evaluate hormonal status, which could be a confounding variable.
Sexual motivation depends not only on hormonal status but also on the partner. As described by Clayton,22 if desire is not the motivating force for sexual activity, then the loss of spontaneous desire might not have a great impact on a woman's sexual life if her partner is still interested and initiates sexual activity. Furthermore, a study conducted by Schoenfeld et al11 reported the importance of having a partner to maintain sexual activity. In that study, they found that the main reason for sexual abstinence was the absence of a partner (22.4%), no sexual desire (10.2%), an impotent partner (6.4%), fear of urinary leakage during intercourse (5.4%), lack of lubrication (4.5%), and discomfort during penetration (4.2%). In our study, the partner's sexual health was not evaluated. This could negatively interfere with our results, particularly with sexual abstinence. We found that married women, regardless of being continent or incontinent, were more sexually active than single, divorced, or widowed women. This could be related to a partner initiating sexual activity. However, maintaining sexual activity did not guarantee a pleasant sexual life. Despite having a partner and maintaining a similar frequency of sexual activity, sexually active women with UI had worse scores for all sexual domains than continent women. These data strongly suggest that UI has a direct impact on female sexuality. Future research should determine the partner's sexual status and include only women with non-dysfunctional partners.
Based on our results, women with UI were less likely to be sexually active than continent women. Nevertheless, to understand the aspects of female sexuality, we performed an analysis of sexually active women and excluded abstinent women. Although continent and incontinent women had a similar frequency of sexual activity, women with UI had less sexual desire, sexual comfort, and sexual satisfaction, poorer harmony with a partner, and foreplay than their counterparts. The presence of a partner in this group could act as a protective factor in maintaining sexual activity frequency.20
It has been reported that as the severity of UI symptoms increases, the inconvenience increases and quality of life decreases.6,23 In the same way, the impact of UI on sexuality could be associated with the severity of urinary leakage. Handa et al24 reported that women with severe UI were likely to report low libido, vaginal dryness, and dyspareunia compared with women without severe incontinence. Paick et al25 reported that patient-perceived severity of UI significantly influenced health-related quality of life and sexual function. In our study, women who had urinary leakage greater than 11 g (by the 1-hour pad test) had worse SQ-F scores than their counterparts. The impact of UI on sexuality might be associated not only with urinary leakage but also with psychological insecurity and worse self-image, which could be more frequent in patients with severe UI.
Women with more severe UI could be more susceptible to urinary leakage during intercourse. Coital UI is a symptom affecting 10% to 36% of incontinent women.26–28 Although underreported, studies have shown that the presence of coital incontinence can have a significant impact on quality of life.25,26 The moment women leak urine during intercourse (penetration or orgasm) could depend on the type of incontinence (SUI, UUI, or MUI).5,26,27,29 The presence of detrusor overactivity seems to predispose to urine leakage during orgasm.27,29 In contrast, SUI would be associated with urinary leakage from straining during intercourse.5,26 However, no consensus exists on the role of the different subtypes of incontinence in sexual dysfunction. In the present study, coital UI was reported by 43% of women who did not report any direct impact on sexuality. We evaluated women with different UI subtypes. Most had MUI, which is the most common clinical presentation. A few patients with pure SUI and UUI did not allow a determination of the impact of different incontinence types on sexual function. Future studies should include a larger number of patients with pure SUI and UUI to determine the impact of specific incontinence subtypes on sexual dysfunction.
Our study has some limitations. We did not evaluate women’s hormonal status and the partner's sexual health. The studied population had a low income and/or low educational level, and these characteristics have been described as important risk factors for sexual dysfunction.30 Despite these limitations, our study clearly showed that UI had an isolated major role in the development of sexual dysfunction in women.
Conclusion
UI had a significant impact on women's sexual life. Women with UI had a higher probability of sexual abstinence compared with women without UI. Furthermore, women with UI showed less sexual desire, sexual comfort, and sexual satisfaction than their counterparts despite having a similar frequency of sexual activity.
Statement of authorship
Category 1
Conception and Design
Mariana Rhein Felippe; Joao Paulo Zambon; Marcia Eli Girotti; Juliana Schulze Burti; Claudia Rosenblatt Hacad; Fernando Almeida
Acquisition of Data
Mariana Rhein Felippe; Joao Paulo Zambon; Marcia Eli Girotti; Claudia Rosenblatt Hacad; Lina Cadamuro; Fernando Almeida
Analysis and Interpretation of Data
Mariana Rhein Felippe; Marcia Eli Girotti; Claudia Rosenblatt Hacad; Fernando Almeida
Category 2
Drafting the Article
Mariana Rhein Felippe; Joao Paulo Zambon; Marcia Eli Girotti; Juliana Schulze Burti; Claudia Rosenblatt Hacad; Lina Cadamuro; Fernando Almeida
Revising It for Intellectual Content
Mariana Rhein Felippe; Joao Paulo Zambon; Marcia Eli Girotti; Juliana Schulze Burti; Claudia Rosenblatt Hacad; Lina Cadamuro; Fernando Almeida
Category 3
Final Approval of the Completed Article
Mariana Rhein Felippe; Joao Paulo Zambon; Marcia Eli Girotti; Juliana Schulze Burti; Claudia Rosenblatt Hacad; Lina Cadamuro; Fernando Almeida
Funding
None.
References
Author notes
Conflicts of Interest: Authors report no conflicts of interest.
