


Abstract
The association of inflammatory biomarkers with erectile dysfunction (ED) is still largely unknown.
The study sought to explore the association of inflammatory biomarkers with ED in U.S. adults.
Participant data for this study were extracted from the National Health and Nutrition Examination Survey, and individuals that lacked information on clinical variables were excluded. Dose-response curve analysis was applied to explore the association of inflammatory biomarkers with ED prevalence. The confounders were adjusted for with weighted logistic regression analysis. We employed 1:1 propensity score matching to eliminate the effects of clinical variables to confirm the reliability of the results.
ED prevalence was investigated with potential risk factors.
A total of 2331 men ≥20 years of age who participated in the National Health and Nutrition Examination Survey 2001-2004 were included in this study. Compared with individuals without ED, ED cohort displayed higher levels of neutrophil-to-lymphocyte ratio, lymphocyte-to-monocyte ratio, systemic immune-inflammatory index, and systemic inflammation response index. Dose-response curve analysis indicated ED prevalence increased with the increase of platelet-to-lymphocyte ratio, systemic immune-inflammatory index, and systemic inflammation response index. Weighed logistic regression analysis revealed neutrophil-to-lymphocyte ratio was positively associated with ED. The reliability of the results was confirmed by 1:1 propensity score matching reanalysis.
Individuals with chronic inflammatory conditions should be alert for the development of ED.
It is a large controlled study to investigate the relationship between inflammatory indexes and ED. However, it is a cross-sectional study and it lacks an accurate assessment of the degree of ED.
Inflammatory biomarkers were associated with ED prevalence.
Introduction
Erectile dysfunction (ED) refers to the inability to achieve or maintain an erection satisfactory for sexual intercourse and is a common clinical entity that seriously influences people’s quality of life and physical and mental health.1 An estimated 50% of men 40 to 70 years of age experience ED, with almost 15% of patients reporting complete ED and the remainder reporting varying degrees of ED.2 Conditions commonly associated with ED include aging, depression, obesity, physical inactivity, diabetes, hypertension, dyslipidemia, cardiovascular disease, lower urinary tract symptoms associated with benign prostatic hyperplasia, hypogonadism, and hyperprolactinemia.3
Chronic inflammation is considered a common pathophysiologic process and significantly contributes to the emergence and development of ED.4,5 Patients with ED have high levels of inflammatory markers, including C-reactive protein, interleukins, and tumor necrosis factor α (TNF-α).4,6–8 Neutrophil-to-lymphocyte ratio (NLR),9 platelet-to-lymphocyte ratio (PLR),10 lymphocyte-to-monocyte ratio (LMR),11 systemic immune-inflammatory index (SII), and systemic inflammation response index (SIRI)12 are important indicators of the systemic inflammatory response of the organism. Due to their easy availability and high sensitivity, they have been proposed as predictors of the prognosis of several diseases. Some of these indicators have been reported to relate to ED. However, most studies have limited number of participants. The relationship between inflammatory indicators and ED is need to explore and validate in larger study cohorts. The National Health and Nutrition Examination Survey (NHANES) is a national survey that monitors the health and nutritional status of adults and children across the United States. From 2001 to 2004, NHANES implemented a question to collect the erectile function of men. A total of 21 161 men participated in the survey. In this study, we investigated whether NLR, PLR, MLR, SII, and SIRI are associated with ED and explored potential nonlinear relationships between them using data from the 2001-2004 NHANES.
Methods
Data sources
Data for this study were obtained from the NHANES database, with data released publicly on a 2-year cycle. The survey included sociodemographic characteristics, physiological indicators, indicators of nutritional status, laboratory tests, and health status. All data are obtained from surveys conducted by experienced medical personnel. A detailed statement of the NHANES database is available on the official website of National Center for Health Statistics (NCHS) (https://www.cdc.gov/nchs/nhanes). All procedures were approved by the NCHS Research Ethics Committee (NCHS IRB/ERB Protocol No. #2011-17), and all participants provided written informed consent. We conformed to the NHANES data user agreement and used the data for secondary analysis. Hence, the ethical review was exempted by the Ethics Committee of the Affiliated Zhongda Hospital of Southeast University.
Study population
A total of 21 161 men participated in the 2001-2004 survey. Individuals without relevant data were excluded. The exclusion criteria and flow were shown in Figure 1. Finally, 2331 men ≥20 years of age were included in this study.
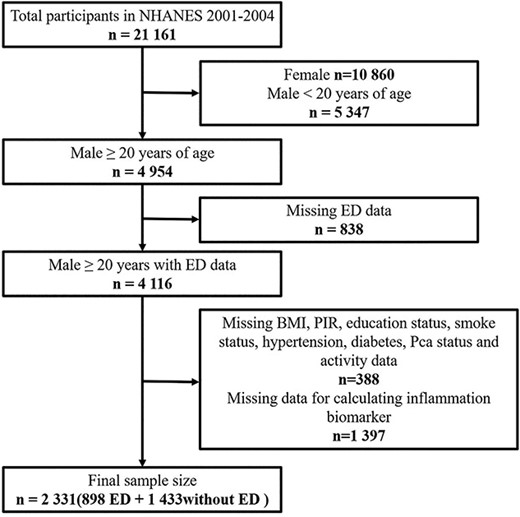
Schematic flow diagram of inclusion and exclusion criteria for our study cohort.
Study covariables
The following variables were included in the study: (1) demographic information, including age, race (Mexican American, non-Hispanic White, non-Hispanic Black, and other), education (less than high school, high school diploma, and more than high school), smoking status (yes or no), and body mass index (BMI) (<25.0 kg/m2, 25-29.99 kg/m2, and ≥30.0 kg/m2); (2) laboratory data, including platelet count (PC), neutrophil count (NC), lymphocyte count (LC), and monocyte count (MC); (3) questionnaire information, including history of hypertension and diabetes; and (4) physical activity data.
ED assessment
The endpoint of the study was a history of ED. Trained interviewers used the question, “How would you describe your ability to get and keep an erection adequate for satisfactory sexual intercourse” to assess the respondent’s erectile function. In this study, “sometimes able or never able” is defined as having ED and “always able or almost always able and usually able” is defined as not having ED, which is consistent with previous studies.13
Definition of inflammatory biomarkers
All indexes are calculated from the results of the complete blood count test and the laboratory methods for the complete blood count test are available on the NHANES website. In addition, LC, MC, PC, and NC were measured in units of 1000 cells/μL. Relevant formulas are as follows: LMR = LC/MC; NLR = NC/LC; PLR = PC/LC; SII = (PC × NC)/LC; SIRI = (NC × MC)/LC.
Statistical analysis
In descriptive analysis, continuous variables conforming to a normal distribution were expressed as mean ± SD; categorical variables were expressed as frequency and percentage. The t test and chi-square test were used to test the statistical differences between normally distributed continuous and categorical variables in the 2 groups. Because of the multistage and probability cluster design of NHANES, we considered weights in this study to improve the representativeness. Weighted multivariable-adjusted logistic regression was used to calculate the odds ratio with 95% confidence interval (CI). Three models were built to assess the association between inflammatory biomarkers and ED. Model 1 is unadjusted. In model 2, we adjusted for age, race, BMI, smoking, education, and poverty impact ratio (PIR). Finally, we adjusted for model 2 covariates and for physical activity, hypertension, diabetes, and glomerular filtration rate (GFR) in model 3.
The restricted cubic spline function was applied to describe the dose-response relationship between the inflammatory biomarkers and ED, adjusted for variables including age, race, smoking status, education status, PIR, physical activity status, hypertension, diabetes, and GFR.
Propensity score matching (PSM) was used to reduce the effects of data bias and confounding variables for a more reliable result. PSM involves matching study subjects with similar propensity scores across treatment groups, which ensures study objectivity and uses similar covariate distributions to construct the study population without impacting study outcomes, which is equivalent to achieving randomization. In this study, the Matching package of R (version 3.5.1; R Foundation for Statistical Computing) was used to obtain the control population by matching the ED patient data separately at a 1:1 matching ratio.
All statistical analyses were performed using R (version 3.5.1). P < .05 (2-sided) was considered statistically significant.
Baseline demographic and clinical characteristics of study population, National Health and Nutrition Examination Survey 2001-2004.
| Characteristic | Non-ED (n = 33 206 622) | ED (n = 12 909 604) | P value |
|---|---|---|---|
| Age, y | 51.28 ± 9.40 | 64.36 ± 11.46 | <.001a |
| Race | <.001a | ||
| Mexican American | 1 688 879 (5.09) | 527 722.7 (4.09) | |
| Non-Hispanic White | 26 590 303 (80.08) | 10 513 627.8 (81.44) | |
| Non-Hispanic Black | 2 849 800 (8.58) | 1 015 232.3 (7.86) | |
| Other | 2 077 640 (6.26) | 853 020.8 (6.61) | |
| PIR | <.001a | ||
| <1.3 | 3 957 792 (11.92) | 2 120 369 (16.42) | |
| ≥1.3, <3.5 | 9 578 620 (28.85) | 5 331 204 (41.30) | |
| ≥3.5 | 19 670 209 (59.24) | 5 458 030 (42.28) | |
| Education | <.001a | ||
| Less than high school | 3 742 213 (11.27) | 3 388 983 (26.25) | |
| High school diploma | 8 984 646 (27.06) | 3 126 972 (24.22) | |
| More than high school | 20 479 763 (61.67) | 6 393 649 (49.53) | |
| Cigarette smoking | <.001a | ||
| Yes | 19 675 013 (59.25) | 9 103 022 (70.51) | |
| No | 13 531 609 (49.75) | 3 806 582 (29.49) | |
| BMI | <.001a | ||
| <25 kg/m2 | 7 462 771 (22.47) | 3 007 015 (23.29) | |
| 25-30 kg/m2 | 15 602 551 (46.99) | 5 093 350 (39.45) | |
| >30 kg/m2 | 10 141 300 (30.54) | 4 809 238 (37.25) | |
| Hypertension | <.001a | ||
| Yes | 9 827 007 (29.59) | 6 742 303 (52.23) | |
| No | 23 379 614 (70.41) | 6 167 300 (47.77) | |
| Diabetes | <.001a | ||
| Yes | 1 815 550.3 (5.47) | 2 892 556.8 (22.41) | |
| No | 31 002 017.1 (93.36) | 9 841 821.6 (76.24) | |
| Prediabetes | 389 054.2 (1.17) | 175 225.1 (1.36) | |
| Physical activity status | |||
| Vigorous | <.001a | ||
| Yes | 12 491 628 (37.62) | 2 382 143 (18.45) | |
| No | 20 714 994 (62.38) | 10 527 460 (81.55) | |
| Moderate | <.001a | ||
| Yes | 19 293 274 (58.1) | 6 494 614 (50.31) | |
| No | 13 913 348 (41.9) | 6 414 989 (49.69) | |
| GFR, mL/(min* 1.73m2) | 98.26 ± 18.34 | 86.48± 20.83 | <.001a |
| Platelet count, 103/μL | 254.06 ± 60.36 | 240.24 ± 66.04 | <.001a |
| Neutrophil count, 103/μL | 4.16 ± 1.58 | 4.33 ± 1.50 | .017a |
| Lymphocyte count, 103/μL | 2.09 ± 1.54 | 2.00 ± 2.55 | .547 |
| Monocyte count, 103/μL | 0.57 ± 0.19 | 0.61 ± 0.22 | .025a |
| SII, ×103 | 558.59 ± 302.65 | 630.89 ± 477.94 | <.001a |
| NLR | 2.19 ± 1.00 | 2.61 ± 1.45 | <.001a |
| PLR | 135.71 ± 50.28 | 143.21 ± 65.69 | .062 |
| LMR | 3.81 ± 1.50 | 3.37 ± 1.55 | <.001a |
| SIRI | 10.08 ± 6.44 | 11.88 ± 9.02 | <.001a |
Values are mean ± SD or n (%). For categorical variables, P values were analyzed by chi-square tests. For continuous variables, P values were analyzed by t test. All of the continuous variables were exhibited by mean and SD.
Abbreviations: BMI, body mass index; ED, erectile dysfunction; GFR, glomerular filtration rate; LMR, lymphocyte-to-monocyte ratio; NLR, neutrophil-to-lymphocyte ratio; PIR, poverty impact ratio; PLR, platelet-to-lymphocyte ratio; SII, systemic immune-inflammatory index; SIRI, systemic inflammation response index.
Statistical difference.
Results
A total of 21 161 (weighted N = 46 116 226) participants in the NHANES pool from 2001 to 2004 were used as subjects for this study. Figure 1 shows the flow chart. We first excluded women (n = 10 860) and men younger than 20 years of age (n = 5347). Subsequent exclusion criteria were as follows: (1) participants who had not completed the ED survey (n = 838); (2) missing BMI, PIR, education status, smoking status, hypertension, diabetes, prostate cancer (Pca) status, and activity data (n = 388); and (3) missing data for calculating inflammation biomarker (n = 1397). Finally, a total of 2331 participants were enrolled in this research, of whom 898 were experiencing ED.
The differences between participants with and without ED are presented In Table 1. We found that age (P < .001), race (P < .001), PIR (P < .001), education status (P < .001), cigarette smoking (P < .001), BMI (P < .001), hypertension (P < .001), diabetes (P < .001), physical activity status (P < .001), and GFR (P < .001) were differed statistically. Compared with individuals without ED, those with ED had higher SII (P < .001), NLR (P < .001), SIRI (P < .001), and LMR (P < .001).
The dose-response curve revealed that the ED prevalence increased with the increase of PLR, SII, and SIRI after adjusting for age, race, smoking, education status, PIR, physical activity, hypertension, diabetes, and GFR (Figure 2). Interestingly, curves of LMR and NLR had an inflection point. For people with NLR >2, the higher the NLR was, the greater the risk of suffering from ED was.
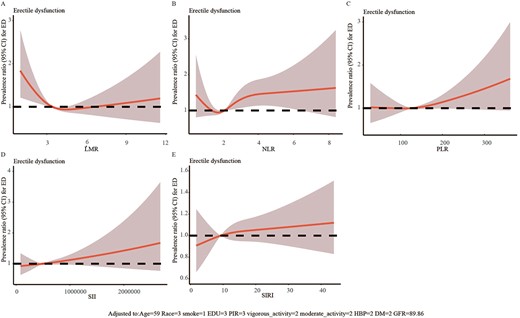
The dose-response analysis of inflammatory biomarkers and erectile dysfunction before propensity score matching.
The association between inflammatory indexes and ED was assessed by weighted logistic regression. We found that NLR was an independent risk factor for ED in models 1 (adjusted odds ratio [aOR], 1.36; 95% CI; 1.25-1.48; P < .001), 2 (aOR, 1.14; 95% CI; 1.03-1.27; P = .018), and 3 (aOR, 1.12; 95% CI; 1.01-1.24; P = .031) (Table 2).
Prevalence ratios of prevalent erectile dysfunction by inflammatory biomarkers, National Health and Nutrition Examination Survey 2001-2004.
| Model 1a | Model 2b | Model 3c | ||||
|---|---|---|---|---|---|---|
| aOR (95% CI) | P | aOR (95% CI) | P | aOR (95% CI) | P | |
| SII | 1.00 (1.00, 1.00) | <.001d | 1.00 (1.00, 1.00) | .174 | 1.00 (1.00, 1.00) | .214 |
| NLR | 1.36 (1.25, 1.48) | <.001d | 1.14 (1.03, 1.27) | .018d | 1.12 (1.01, 1.24) | .031d |
| PLR | 1.00 (1.00, 1.00) | .038d | 1.00 (1.00, 1.00) | .402 | 1.00 (1.00, 1.00) | 0.322 |
| LMR | 0.79 (0.71, 0.87) | <.001d | 0.93 (0.85, 1.02) | .137 | 0.94 (0.86, 1.03) | .175 |
| SIRI | 1.04 (1.02, 1.05) | <.001d | 1.01 (0.99, 1.03) | .236 | 1.01 (0.99, 1.02) | .501 |
Abbreviations: aOR, adjusted odds ratio; BMI, body mass index; CI, confidence interval; LMR, lymphocyte-to-monocyte ratio; NLR, neutrophil-to-lymphocyte ratio; PIR, poverty impact ratio; PLR, platelet-to-lymphocyte ratio; SII, systemic immune-inflammatory index; SIRI, systemic inflammation response index.
Model 1 is unadjusted.
Model 2 adjusted for age, race, BMI, smoking, education, and PIR.
Model 3 adjusted for model 2 covariates and for hypertension, diabetes, and glomerular filtration rate.
Statistical difference.
PSM analysis was performed on participants to eliminate the effects of confounding factors that may have an impact on ED. The 1:1 PSM analysis was conducted by adjusting for variables in Figure 3. A total of 543 individuals with ED and 543 individuals without ED were matched. Baseline features of the study population after PSM are described in Table 3. Age, race, PIR, education status, smoking status, BMI, hypertension, diabetes, physical activity status, and GFR did not significantly differ between the 2 cohorts. Moreover, we discovered that compared with non-ED cohort, the ED cohort displayed higher levels of NLR and PLR and a lower level of LMR.
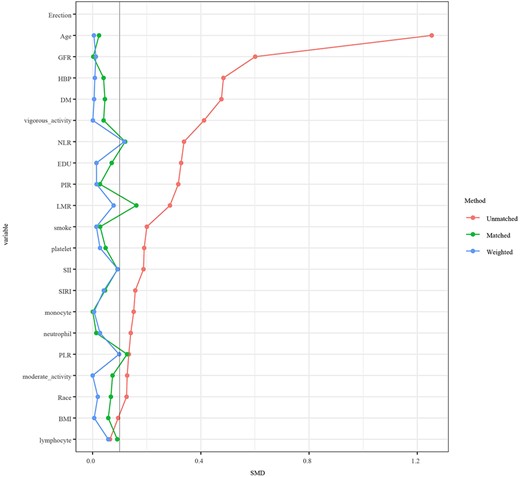
Propensity score matching analysis was performed by the 1:1-based minimum adjacency method.
Baseline demographic and clinical characteristics of the study population, National Health and Nutrition Examination Survey 2001-2004.
| Characteristic | Non-ED (n = 543) | ED (n = 543) | P value |
|---|---|---|---|
| Age, y | 63.93 ± 10.94 | 64.11 ± 11.11 | .792 |
| Race | .515 | ||
| Mexican American | 91 (16.8) | 88 (16.2) | |
| Non-Hispanic White | 342 (63.0) | 325 (59.9) | |
| Non-Hispanic Black | 78 (14.4) | 95 (17.5) | |
| Other | 32 (5.9) | 35 (6.4) | |
| PIR | .614 | ||
| <1.3 | 119 (21.9) | 132 (24.3) | |
| ≥1.3, <3.5 | 211 (38.9) | 209 (38.5) | |
| ≥3.5 | 213 (39.2) | 202 (37.2) | |
| Education | .416 | ||
| Less than high school | 167 (30.8) | 187 (34.4) | |
| High school diploma | 123 (22.7) | 113 (20.8) | |
| More than high school | 253 (46.6) | 243 (44.8) | |
| Cigarette smoking | .742 | ||
| Yes | 379 (69.8) | 373 (68.7) | |
| No | 164 (30.2) | 170 (31.3) | |
| BMI | .781 | ||
| <25 kg/m2 | 126 (23.2) | 135 (24.9) | |
| 25-30 kg/m2 | 236 (43.5) | 235 (43.3) | |
| >30 kg/m2 | 181 (33.3) | 173 (31.9) | |
| Hypertension | .466 | ||
| Yes | 267 (49.1) | 254 (46.8) | |
| No | 276 (50.8) | 289 (53.2) | |
| Diabetes | .77 | ||
| Yes | 92 (16.9) | 90 (16.6) | |
| No | 440 (81.0) | 445 (82.0) | |
| Prediabetes | 11 (2.0) | 8 (1.5) | |
| Physical activity status | |||
| Vigorous | .655 | ||
| Yes | 111 (20.4) | 118 (21.7) | |
| No | 432 (79.6) | 425 (78.3) | |
| Moderate | .274 | ||
| Yes | 267 (49.1) | 248 (45.7) | |
| No | 276 (50.8) | 295 (54.3) | |
| GFR, mL/(min* 1.73m2) | 85.79 ± 19.86 | 85.43 ± 20.33 | .766 |
| Platelet count, 103/μL | 244.61 ± 62.58 | 42.71 ± 65.00 | .624 |
| Neutrophil count, 103/μL | 4.22 ± 1.50 | 4.22 ± 1.58 | .943 |
| Lymphocyte count, 103/μL | 2.24 ± 3.97 | 1.98 ± 1.44 | .147 |
| Monocyte count, 103/μL | 0.59 ± 0.24 | 0.60 ± 0.19 | .912 |
| SII, ×103 | 566.78 ± 343.50 | 607.18 ± 417.46 | .082 |
| NLR | 2.33 ± 1.25 | 2.48 ± 1.32 | .044a |
| PLR | 133.21 ± 53.90 | 141.94 ± 66.76 | .018a |
| LMR | 3.73 ± 1.88 | 3.49 ± 1.60 | .022a |
| SIRI | 11.21 ± 8.42 | 12.03 ± 23.29 | .441 |
Values are mean ± SD or n (%). For categorical variables, P values were analyzed by chi-square tests. For continuous variables, P values were analyzed by t test. All of the continuous variables were exhibited by mean and SD.
Abbreviations: BMI, body mass index; ED, erectile dysfunction; GFR, glomerular filtration rate; LMR, lymphocyte-to-monocyte ratio; NLR, neutrophil-to-lymphocyte ratio; PIR, poverty impact ratio; PLR, platelet-to-lymphocyte ratio; SII, systemic immune-inflammatory index; SIRI, systemic inflammation response index.
Statistical difference.
After adjusting for age, race, smoking status, education status, PIR, physical activity status, hypertension, diabetes, and GFR, the dose-response curve showed that ED prevalence was positively related to PLR, SII, and SIRI and was negatively related to LMR. Similarly, ED risk increases with the increase of NLR for those with NLR >2 (Figure 4). In addition, multivariate logistic regression was also performed after PSM. It showed that NLR (model 1: aOR, 1.1; 95% CI, 1-1.21; P = .049; model 2: aOR, 1.1; 95% CI, 1-1.22; P = .044; model 3: aOR, 1.11; 95% CI, 1.01-1.23; P = .034), PLR (model 1: aOR, 1; 95% CI, 1-1; P = .038; model 2: aOR, 1; 95% CI, 1-1; P = .04; model 3: aOR, 1; 95% CI, 1-1; P = .035), and LMR (model 1: aOR, 0.91; 95% CI, 0.84-0.97; P = .01; model 2: aOR, 0.9; 95% CI, 0.83-0.97; P = .008; model 3: aOR, 0.9; 95% CI, 0.83-0.97; P = .007) were independent risk factors in all 3 models (Table 4).
Prevalence ratios of prevalent erectile dysfunction by inflammatory biomarkers after propensity score matching, National Health and Nutrition Examination Survey 2001-2004.
| Model 1a | Model 2b | Model 3c | ||||
|---|---|---|---|---|---|---|
| aOR (95% CI) | P | aOR (95% CI) | P | aOR (95% CI) | P | |
| SII | 1.00 (1.00, 1.00) | .131 | 1.00 (1.00, 1.00) | .125 | 1.00 (1.00, 1.00) | .102 |
| NLR | 1.10 (1.00, 1.21) | .049d | 1.10 (1.00, 1.22) | .044d | 1.11 (1.01, 1.23) | .034d |
| PLR | 1.00 (1.00, 1.00) | .038d | 1.00 (1.00, 1.00) | .040d | 1.00 (1.00, 1.00) | .035d |
| LMR | 0.91 (0.84, 0.97) | .010d | 0.90 (0.83, 0.97) | .008d | 0.90 (0.83, 0.97) | .007d |
| SIRI | 21.03 (0.01, 3.24 × 10⁶) | .481 | 22.63 (0.01, 4.51 × 10⁶) | .477 | 25.79 (0.01, 7.14 × 10⁶) | .472 |
Abbreviations: aOR, adjusted odds ratio; BMI, body mass index; CI, confidence interval; LMR, lymphocyte-to-monocyte ratio; NLR, neutrophil-to-lymphocyte ratio; PIR, poverty impact ratio; PLR, platelet-to-lymphocyte ratio; SII, systemic immune-inflammatory index; SIRI, systemic inflammation response index.
Model 1 is unadjusted.
Model 2 adjusted for age, race, BMI, smoking, education, and PIR.
Model 3 adjusted for model 2 covariates and for hypertension, diabetes, and glomerular filtration rate.
Statistical difference.
Discussion
Our research investigated the association of inflammatory biomarkers and ED prevalence based on the cumulative NHANES dataset. The NHANES sample population is representative of the U.S. population. It is one of the largest databases available for inflammatory biomarkers and ED in the general population. To the best of our knowledge, this is the first study to explore the connection between ED prevalence and NLR, PLR, LMR, SII, or SIRI.
Inflammation is considered to be one of the triggers of ED, and studies have found enhanced levels of inflammatory factors such as interleukin (IL)-6, IL-1β, and TNF-α in ED patients and rats.14 Araña Rosaínz et al15 verified that the elevation of anti-inflammatory factor IL-10 is related to a reduced risk of ED in diabetic patients. All evidence implies that systemic inflammation is inextricably linked to the development of ED. A large body of evidence suggests that some inflammatory molecules may be of great value in assessing ED risk or treatment efficacy. Several reports have shown that both ED and its severity are associated with mediators and markers of subclinical inflammation and endothelial dysfunction.16 In addition, 5-item International Index of Erectile Function scores were negatively associated with levels of fibrinogen, IL-1β, vascular hemophilia factor, and IL-6.17 Although the exact mechanism by which inflammation causes ED is still unclear, it is undeniable that there is a strong link between the two. In the predominantly proinflammatory environment, nitric oxide bioavailability is reduced and vasodilation is impaired due to inhibition of endothelial nitric oxide synthase expression and overproduction of reactive oxygen species, ultimately leading to endothelial dysfunction (Figure 5).18
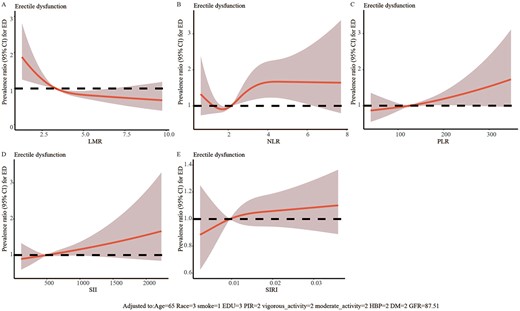
The dose-response analysis of inflammatory biomarkers and erectile dysfunction after propensity score matching.
NLR is a widely used prognostic index for oncological, cardiovascular, and inflammatory diseases. Neutrophils produce and secrete several inflammatory mediators such as myeloperoxidase (MPO) and reactive oxygen species, which can lead to endothelial cell damage.19 Liao et al20 proposed that an NLR over 1.94 predicted ED with a sensitivity of 60.2% and specificity of 76.9%. A meta-analysis demonstrated that ED patients displayed a higher NLR, which is consistent with our findings.21 In addition, tadalafil reduces systemic inflammation as evidenced by a reduction in inflammatory biomarkers such as NLR and PLR.22
PLR has been used in a variety of diseases to predict inflammation and mortality because of its easy availability and low cost.23 An elevated pretreatment PLR predicts a shorter overall survival for patients with prostate cancer.24 In addition, PLR can be employed as a prognostic marker to assess treatment response in patients with Crohn’s disease.25 PLR can evaluate the risk of systemic inflammatory response syndrome after percutaneous nephrolithotomy and with high sensitivity and specificity.26 A retrospective study revealed that PLR was associated with severity of ED based on the 5-item International Index of Erectile Function. However, only 175 ED patients were included in this study, and the patients were relatively young.27 In contrast, our study included a much larger number and a wider age range, and the findings were more reliable and generalizable.
LMR has been explored in multiple studies. Low LMR is related to poor prognosis in patients with non-small cell lung cancer.28 Several studies suggest that the decrease in LMR was related to the release of proinflammatory factors, including IL-6, IL-1β, and TNF-α, which play a vital role in inflammation.29 However, the association between LMR and ED has not been elaborated. Our results indicated LMR level was an independent risk factor for ED risk, and lower LMR level was related to higher ED risk independent of age, race, and other factors.
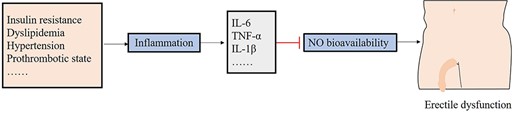
The potential mechanism of action related to inflammatory biomarkers and erectile dysfunction.
The current availability of blood cell testing is very convenient and thus may expand the range of indications for evaluating potential risk of ED in healthy individuals. This research indicated that some inflammatory indicators may help us to evaluate the general risk profile of patients with ΕD and may contribute to ED prevention. However, the evidence supporting this recommendation is still limited, and the mechanisms underlying the relationship between NLR, PLR, or LMR and ED have not been fully studied. Therefore, more comprehensive mechanical studies are essential to figure out the specific relationship of inflammatory biomarkers with ED.
Many factors have been reported to be associated with ED. For example, a cross-sectional research suggested that higher triglyceride-glucose (TyG) index was related to a higher prevalence of ED.30 However, Compared with biochemical tests, routine blood tests are more convenient and less costly. Therefore, the early warning role of inflammatory indexes for ED will have a broad clinical application.
Our study has some limitations. First, this was a cross-sectional study, so the ability to prove causality was not developed. Second, some sexual function rating scales should be used to investigate the erectile function of participants. Third, although PSM can adjust for the effects of confounding factors, it still has drawbacks such as model dependence and bias. Therefore, more carefully designed prospective studies and multicenter studies are necessary to explore the relationship between inflammatory biomarkers and ED.
Conclusion
NLR has predictive value as a novel, convenient, and inexpensive marker of inflammation for identifying ED. Therefore, this biomarker can be considered in the clinical setting as a method for ED prevention or early intervention.
Author contributions
Conceptualization: C.L. Data curation: Y.G. Formal analysis: C.L., J.J. Funding acquisition: C.S. Supervision: C.S., M.C. Writing - review & editing: all authors.
Funding
This study was supported by the National Natural Science Foundation of China (No. 81871157).
Conflict of interest
The authors have no conflicts of interest to declare.
Data availability
The data that support the findings of this study are available from the corresponding author upon reasonable request.
