


Abstract
To evaluate effects of lemborexant (LEM), a dual orexin receptor antagonist, on next-morning sleep propensity assessed by a modified Multiple Sleep Latency Test (M-MSLT) in adults with insomnia disorder.
Study 107 (E2006-A001-107) was a phase 1, randomized, double-blind, four-period crossover study. Subjects (n = 69) received oral single-dose placebo, LEM 5 mg (LEM5), and LEM 10 mg (LEM10) at bedtime in periods 1–3 in a randomized crossover and open-label flurazepam 30 mg in period 4. After an 8-hour overnight sleep opportunity, the M-MSLT measured average sleep onset latency (SOL). Mean change from baseline in average SOL versus placebo of −6.0 min or more was considered clinically meaningful. Other sleep propensity assessments included the proportion of subjects with average SOL >6 min shorter than placebo. LEM plasma concentrations, safety, and tolerability were also assessed.
M-MSLT assay sensitivity was confirmed by a clinically meaningful decrease in average SOL with flurazepam versus placebo (least squares mean [LSM] difference –6.06 min; 1-sided p < 0.0001). In contrast, decreases in average SOL with LEM5 (LSM difference vs. placebo –1.15 min; 1-sided p = 0.0262) and LEM10 (–3.48 min; p < 0.0001) did not meet the predefined threshold for a clinically meaningful effect (LEM5, –2.12; LEM10, –4.46). Some individuals did experience higher sleep propensity (average SOL >6.0 min shorter than placebo), particularly with LEM10 (LEM10, 29.4%; LEM5, 13.2%).
In contrast to flurazepam, LEM5 and LEM10 did not show clinically meaningful mean increases in next-morning sleep propensity versus placebo. The possibility that some subjects may experience residual morning effects cannot be excluded.
Clinical trial registration: ClinicalTrials.gov, NCT02350309
The dual orexin receptor antagonist lemborexant (LEM) is approved in the United States, Canada, and Japan for the treatment of insomnia in adults. Study 107 (E2006-A001-107) is the first study to use the modified Multiple Sleep Latency Test to focus on next-morning sleep propensity in the first few hours after waking following dosing with a sleep-promoting drug. The study showed no clinically meaningful increase in next-morning sleep propensity with LEM 5 or 10 mg compared with placebo, which is consistent with findings from studies using other measures to evaluate residual effects of LEM. Nevertheless, the possibility that some individuals may experience residual morning effects following treatment, particularly with the LEM 10-mg dose, cannot be excluded.
Introduction
Insomnia disorder is characterized by difficulties with sleep onset and/or sleep maintenance as well as a daytime impairment that can substantially and negatively impact the quality of life [1–4]. However, sleep-promoting drugs for the treatment of insomnia may themselves have residual effects that impede next-day functioning and interfere with work and home activities [5]. Current treatments for insomnia, including benzodiazepines, non-benzodiazepines (including the “Z-drugs”), and sedating antidepressants, have been associated with next-day fatigue and reduced performance in cognitive, psychomotor, and driving tests [6–9]. Therefore, it is important to assess any new sleep-promoting drug for the potential risk of residual morning impairment.
Lemborexant (LEM) is a dual orexin receptor antagonist that is approved in the United States, Canada, and Japan for the treatment of insomnia in adults [10]. In the pivotal phase 3 studies E2006-G000-304 (Study 304; SUNRISE-1; ClinicalTrials.gov identifier NCT02783729) and E2006-G000-303 (Study 303; SUNRISE-2; ClinicalTrials.gov identifier NCT02952820), LEM demonstrated significant benefit on objective [11] and patient-reported [11, 12] sleep onset and sleep maintenance measures compared with placebo in subjects with insomnia disorder. At steady state with once-daily dosing, LEM shows an approximate fourfold reduction in plasma concentrations from the time of maximum plasma concentration to 9 h post-dose [13]. This indicates that a large proportion of LEM exposure following bedtime dosing would be eliminated during the night, with substantially lower exposure during the daytime, a profile that is compatible with minimizing residual next-day effects. During the clinical development of LEM, the potential for residual effects was assessed in nine clinical studies using a variety of measures, including assessments of postural stability, cognitive performance, driving, and next-morning waketime subjective measures (Karolinska Sleepiness Scale and sleep diary ratings) and objective measures (Digit Symbol Substitution Test, Psychomotor Vigilance Test, and Reaction Time Index) [14]. In a recent overview, these studies of single and chronic dosing indicated that LEM has a low propensity to impair next-day functioning among healthy subjects and subjects with insomnia [14]. Included in that overview was a brief description of the study described in detail in this article.
Study 107 (E2006-A001-107; NCT02350309) was conducted as part of the LEM clinical development program to confirm that LEM, at doses of 5 and 10 mg, did not result in undesirable next-morning residual sleepiness. The study aimed to evaluate whether there was a clinically meaningful effect of LEM on next-morning sleep propensity, defined as a change from baseline in average sleep onset latency (SOL) versus placebo of −6.0 min or more. This definition was based on the size of the reported effects on SOL of the hypnotic flurazepam, which has been used as a positive control in previous studies of residual effects [15]. Study 107 was the first study of its kind to incorporate the modified Multiple Sleep Latency Test (M-MSLT) to elucidate the risk of residual effects following bedtime doses of a sleep-promoting drug. Unlike the standard MSLT, which typically commences 2–3 h after waketime and continues over a 10-hour daytime period [16], the M-MSLT focused on next-morning sleep propensity in the first few hours after waking. This study also evaluated LEM plasma concentrations, safety, and tolerability.
Methods
Study design
This was a phase 1, randomized, double-blind, placebo- and active-controlled crossover study (E2006-A001-107; NCT02350309) that examined the effect of 5-mg and 10-mg LEM doses evaluated in phase 3 clinical studies on next-morning sleep propensity in subjects with insomnia disorder. The study was carried out at two centers in the United States from December 2014 to April 2015 and was conducted in accordance with the Declaration of Helsinki, the International Conference on Harmonisation guidelines for Good Clinical Practice, and applicable laws and regulations. The study protocol was approved by the institutional review boards of the participating centers, and all subjects provided written informed consent before participating in the study.
Study population
Eligible subjects were male or female adults (≥18 years of age) who met the Diagnostic and Statistical Manual of Mental Disorders, fifth edition criteria for insomnia disorder [17]. Subjects had current insomnia symptoms of subjective SOL ≥30 min and subjective wake-after-sleep onset ≥60 min, both recorded by sleep diary on at least 3 of 7 consecutive nights during screening. Subjects also had a regular time in bed of 7–9 h, with regular bedtime between 21:00 and 24:00 and regular waketime between 05:00 and 09:00, and an Insomnia Severity Index (ISI) score ≥15 [18].
Subjects were excluded from the study if they had objective morning sleepiness, demonstrated by an average SOL <10 min at baseline measured by M-MSLT [19], or if they habitually napped >3 times per week. Subjects were excluded if they had a current diagnosis of comorbid sleep apnea, periodic limb movement disorder, restless legs syndrome, circadian rhythm sleep disorder, narcolepsy, or complex sleep-related behavior. Subjects were also excluded if the screening battery indicated potential undiagnosed obstructive sleep apnea (STOPBang [20]; exclusionary score ≥5), restless legs syndrome (International Restless Legs Scale [21]; exclusionary score ≥16), or excessive daytime sleepiness (Epworth Sleepiness Scale [22]; exclusionary score >5). Additional exclusion criteria included a history within the past year of confusional arousals, rapid eye movement (REM) behavior disorder, sleep-related violent behavior, or aberrant nocturnal behaviors, including sleep-driving or sleep-eating. It was planned that approximately half of the randomized subjects would be ≥65 years of age.
Treatment protocol
The study comprised a screening period of up to 3 weeks followed by four treatment periods with a washout period of ~14 days between treatments (Figure 1). During treatment periods 1–3, subjects received single oral doses of placebo, LEM 5 mg (LEM5), and LEM 10 mg (LEM10) in a randomized three-way Williams design crossover (Supplementary Table 1). In treatment period 4, all subjects received an open-label single oral dose of flurazepam 30 mg, included to confirm assay sensitivity based on its documented effect on mean SOL measured by standard MSLT in elderly subjects and subjects with insomnia disorder [15, 23]. Randomization was stratified by the study center. Each treatment was given at bedtime followed by an 8-hour overnight sleep opportunity in the study center. The time of dosing was based on the subject’s median habitual bedtime recorded in the sleep diary during the screening period. Caffeine intake was restricted to ≤600 mg/day and prohibited after 18:00 throughout the study (screening, treatment, and follow-up periods) and in the mornings before the M-MSLT. Alcohol intake was restricted to ≤2 alcoholic drinks per day and prohibited from 3 h before bedtime throughout the study (screening, treatment, and follow-up periods) and during days and nights spent in the clinic. Medications included CYP3A inhibitors and inducers, any drugs or nonpharmacological treatments for insomnia disorder, and any medications or substances with known sedating effects or alerting effects were prohibited from at least 1 week (or five half-lives, whichever was longer) before the first dose of study treatment until the end of the study.
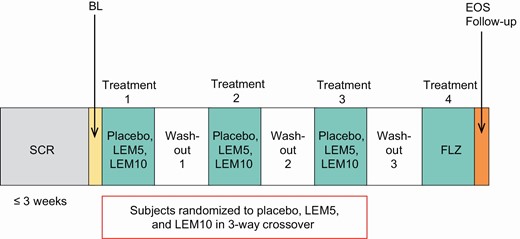
Study design.
BL, baseline; EOS, end of study; FLZ, flurazepam 30 mg; LEM5, lemborexant 5 mg; LEM10, lemborexant 10 mg; SCR, screening.
Outcome measures
Study assessments included next-morning sleep propensity, assessed by M-MSLT, LEM plasma concentrations, and the safety and tolerability of LEM.
Morning sleep propensity by M-MSLT.
The M-MSLT is a modified version of the MSLT [16] that objectively quantifies next-morning sleep propensity in the first few hours after waking, and was conducted at prespecified intervals shortly after morning waketime following an 8-hour overnight in-clinic sleep opportunity during screening (baseline) and after each treatment. Each M-MSLT consisted of four sleep latency tests starting at 45, 75, 105, and 135 min after waketime. For each sleep latency test, subjects were to remain in bed with the bedroom lights turned off, close their eyes, and try to fall asleep. The transition from wakefulness to sleep onset was determined objectively by a technician in real time based on electroencephalographic, electro-oculographic, and electromyographic signals. To be certain unambiguous sleep onset was measured on the MSLT, we defined sleep onset as occurring only at the time when one 30-s epoch of stage N2 or N3, or REM sleep occurred [19]. When sleep onset was unequivocally observed, the subject was immediately awakened and instructed to get out of bed so that sleep did not accumulate. If sleep did not occur, the sleep latency test was ended after 20 min. SOL was therefore the duration in min from “lights off” to sleep onset, or 20 min if sleep did not occur. Average SOL was the mean SOL from the four sleep latency tests during the M-MSLT.
LEM plasma concentrations.
Blood samples were taken within 20 min after the fourth sleep latency test of each treatment period and pre-dose in treatment periods 2–4. Plasma concentrations of LEM were quantified by liquid chromatography with tandem mass spectrometry methodology using a previously validated assay with a lower limit of quantitation of 0.100 ng/mL.
Safety and tolerability.
Safety assessments included treatment-emergent adverse events (TEAEs), laboratory parameters, vital signs, and electrocardiograms (ECGs). Somnolence was defined as a TEAE if it occurred after the end of the sleep period.
Statistical analysis
Analyses of M-MSLT were conducted using the full analysis set, defined as all randomized subjects who received at least one dose of study drug and had at least one post-dose measurement of average SOL by M-MSLT. LEM plasma concentrations were analyzed for the pharmacokinetic (PK) analysis set, which included all subjects who received at least one dose of LEM and had at least one quantifiable post-dose LEM concentration. Safety was analyzed for all subjects who received at least one dose of the study drug and had at least one postdose safety assessment.
The primary endpoint was mean change from baseline in average SOL by M-MSLT for each treatment in treatment periods 1–3 (i.e. placebo, LEM5, and LEM10). Each LEM dose was compared to placebo using a mixed-effects model for a crossover study, including treatment, period, and sequence as fixed effects, baseline (pre-dose) measurement as a covariate where applicable, and subject nested within-treatment sequence as a random effect. Least squares mean (LSM) change from baseline and LSM difference versus placebo were calculated with one-sided 95% confidence intervals (CIs), and one-sided p-values. A clinically meaningful effect on next-morning sleep propensity was defined as a mean change from baseline in average SOL versus placebo that was −6.0 min or more, a threshold based on the reported effects of flurazepam measured by MSLT [15]. Therefore, if the lower bound of the one-sided 95% CI was −6.0 min or more, the dose was considered to have a clinically meaningful effect. Additional analyses of the primary endpoint were conducted with age, age group (<65 years, ≥65 years), sex, body mass index (BMI), and BMI group (<25 and ≥25 kg/m2) as fixed effects in the model. An estimated sample size of 60 subjects was required to confirm no clinically meaningful effect of LEM on average SOL by M-MSLT, assuming a true difference between placebo and LEM10 for change from baseline in average SOL of up to 3 min.
Secondary endpoints assessed the percentage of subjects who exhibited increased next-morning sleep propensity on the M-MSLT according to a number of threshold criteria. The criteria included (1) percentage of subjects with average SOL <8.0 min, a threshold defined by the Committee of the American Academy of Sleep Medicine as an abnormal sleep latency based on the Maintenance of Wakefulness Test [24]; (2) percentage of subjects with average SOL >6.0 min shorter than placebo; and (3) percentage of subjects meeting both of these criteria. The percentages of subjects meeting each of the increased sleep propensity criteria were compared between each active treatment and placebo and between each LEM dose and flurazepam using McNemar’s test.
To establish M-MSLT assay sensitivity, mean change from baseline in average SOL by M-MSLT was compared between flurazepam (active comparator; treatment period 4) and placebo data from the first three treatment periods. The assay sensitivity model included treatment and sequence as fixed effects, and baseline (pre-dose) measurement as a covariate. LSM change from baseline and LSM difference for flurazepam versus placebo were calculated with one-sided 95% CIs and one-sided p-values.
LEM plasma concentrations were summarized using descriptive statistics. The relationship between LEM plasma concentrations and average SOL by M-MSLT was analyzed using Pearson’s correlation coefficient.
Safety data were summarized on an as-treated basis using descriptive statistics. All statistical analyses were performed using SAS version 9.3 (Cary, NC, USA).
Results
Demographic and baseline clinical characteristics
Of 69 subjects randomized, 68 completed all four treatment periods and 67 completed the end-of-study follow-up visit (Figure 2). One subject was discontinued at the discretion of the investigator after dosing on day 1, and one subject completed all treatment periods but did not attend the end-of-study visit due to personal reasons. All 69 subjects were included in the full analysis set, the PK analysis set, and the safety analysis set.
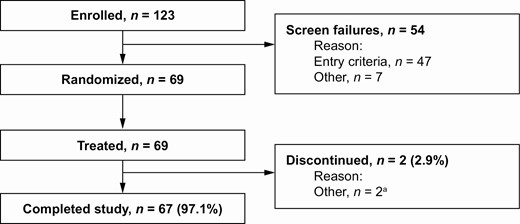
Subject disposition. aOne subject was discontinued on day 1 at the discretion of the investigator and one subject completed all treatment periods but not the end-of-study visit owing to personal reasons.
Most subjects were female (73.9%) and were of white (50.7%) or black/African American (47.8%) race (Table 1). Median age was 50 years (range, 19–79 years), and 11 subjects (15.9%) were elderly (≥65 years). Mean ISI total score was 21.4, indicating moderate-to-severe insomnia [25]. There were no meaningful differences in baseline characteristics between subjects by randomized treatment sequence.
Baseline characteristics (full analysis set)
| All subjects (N = 69) | |
|---|---|
| Age, years | |
| Mean (SD) | 50.2 (12.91) |
| Median (range) | 50 (19, 79) |
| Female, n (%) | 51 (73.9) |
| Race, n (%) | |
| White | 35 (50.7) |
| Black or African American | 33 (47.8) |
| Other Asian | 1 (1.4) |
| BMI, kg/m2, mean (SD) | 27.3 (4.39) |
| ISI total score, mean (SD) | 21.4 (3.67) |
| M-MSLT average SOL, min, mean (SD) | 18.3 (2.61) |
| Sleep parameters based on sleep diary | |
| sSOL, min, median (range) | 55.0 (18.4, 188.6) |
| sWASO, min, mean (SD) | 110.0 (39.73) |
| sSE, %, mean (SD) | 64.4 (11.95) |
BMI, body mass index; ISI, Insomnia Severity Scale; M-MSLT, Modified Multiple Sleep Latency Test; SD, standard deviation; SOL, sleep onset latency; sSE, subjective sleep efficiency; sSOL, subjective sleep onset latency; sWASO, subjective wake after sleep onset.
Change in average SOL
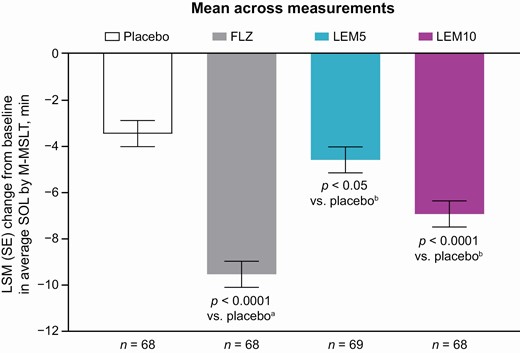
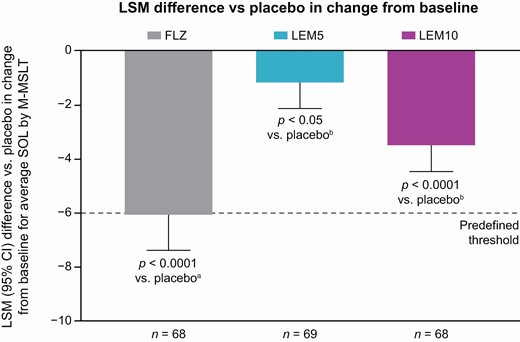
The validity of the M-MSLT assay was confirmed by the statistically significant and clinically meaningful decrease from baseline in average SOL with flurazepam (Table 2 and Figure 3). LSM difference between flurazepam and placebo in the change in average SOL was –6.06 min (1-sided p < 0.0001 vs. placebo), and the lower bound of the 95% CI (–7.38 min) met the predefined threshold for a clinically meaningful effect (Table 3 and Figure 4).
Change from baseline in average SOL by M-MSLT (full analysis set)
| Average SOL based on M-MSLT, min | Placebo (n = 68) | LEM5 (n = 69) | LEM10 (n = 68) | FLZ (n = 68) |
|---|---|---|---|---|
| Baseline, mean (SD) | 18.25 (2.62) | 18.28 (2.61) | 18.25 (2.62) | 18.25 (2.62) |
| Posttreatment, mean (SD) | 14.82 (4.58) | 13.71 (5.30) | 11.30 (5.82) | 8.76 (5.27) |
| Change from baseline | ||||
| Mean (SD) | –3.43 (4.42) | –4.56 (4.69) | –6.95 (4.97) | –9.49 (5.41) |
| Min, max | –15.6, 7.0 | –15.9, 3.0 | –18.0, 0.4 | –18.1, 7.0 |
FLZ, flurazepam 30 mg; LEM5, lemborexant 5 mg; LEM10, lemborexant 10 mg; max, maximum; min, minimum; M-MSLT, Modified Multiple Sleep Latency Test; SD, standard deviation; SOL, sleep onset latency.
Analysis of flurazepam change from baseline in average SOL by M-MSLT (full analysis set)
| Placebo (n = 68) | FLZ (n = 68) | |
|---|---|---|
| Treatment difference in change from baseline in average SOL, min | ||
| LSM change from baseline (SE) | –3.47 (0.57) | –9.53 (0.57) |
| LSM difference vs. placebo (lower bound of 95% CI) | –6.06 (–7.38) | |
| 1-sided p-valuea | <0.0001 |
| Placebo (n = 68) | FLZ (n = 68) | |
|---|---|---|
| Treatment difference in change from baseline in average SOL, min | ||
| LSM change from baseline (SE) | –3.47 (0.57) | –9.53 (0.57) |
| LSM difference vs. placebo (lower bound of 95% CI) | –6.06 (–7.38) | |
| 1-sided p-valuea | <0.0001 |
ap-Value vs. placebo data from the first three treatment periods using an assay sensitivity model, including treatment and sequence as fixed effects and baseline (pre-dose) measurement as a covariate.
If the lower bound of the one-sided 95% CI was –6.0 min or more, the dose was considered to have a clinically meaningful effect.
CI, confidence interval; FLZ, fluzarepam; LSM, least squares mean; M-MSLT, Modified Multiple Sleep Latency Test; SE, standard error; SOL, sleep onset latency.
Change from baseline in average SOL by M-MSLT (full analysis set).
ap-Value for change from baseline with flurazepam vs. placebo data from treatment periods 1–3 in an assay sensitivity model including treatment and sequence as fixed effects, and baseline (pre-dose) measurement as a covariate.
bp-Value for change from baseline with lemborexant vs. placebo using a mixed effects model, including treatment, period, and sequence as fixed effects, baseline (pre-dose) measurement as a covariate where applicable, and subject nested within-treatment sequence as a random effect.
Average SOL was the mean of the four sleep latency tests at 45, 75, 105, and 135 min after waketime during the M-MSLT.
FLZ, flurazepam 30 mg; LEM5, lemborexant 5 mg; LEM10, lemborexant 10 mg; LSM, least squares mean; M-MSLT, Modified Multiple Sleep Latency Test; SE, standard error; SOL, sleep onset latency.
Difference vs. placebo in change from baseline in average SOL by M-MSLT (full analysis set).
ap-Value for flurazepam vs. placebo data from treatment periods 1–3 in an assay sensitivity model including treatment and sequence as fixed effects and baseline (pre-dose) measurement as a covariate.
bp-Value for lemborexant vs. placebo using a mixed effects model, including treatment, period, and sequence as fixed effects, baseline (pre-dose) measurement as a covariate where applicable, and subject nested within-treatment sequence as a random effect.
If the lower bound of the one-sided 95% CI was −6.0 min or more, the dose was considered to have a clinically meaningful effect.
Average SOL was the mean of the four sleep latency tests at 45, 75, 105, and 135 min after waketime during the M-MSLT.
CI, confidence interval; FLZ, flurazepam 30 mg; LEM5, lemborexant 5 mg; LEM10, lemborexant 10 mg; LSM, least squares mean; M-MSLT, Modified Multiple Sleep Latency Test; SOL, sleep onset latency.
Average SOL showed a small and statistically significant decrease from baseline compared with placebo for LEM5 (LSM difference –1.15 min; 1-sided p = 0.0262 vs. placebo) and LEM10 (LSM difference –3.48 min; 1-sided p < 0.0001 vs. placebo) (Table 4 and Figure 3), confirming the high power of the study to detect a small treatment effect. However, the lower bounds of the 95% CIs (–2.12 min for LEM5 and –4.46 min for LEM10) were above the predefined threshold of –6.0 min, indicating no clinically meaningful effect of either LEM dose on next-morning sleep propensity (Table 4 and Figure 4). The terms treatment period, treatment sequence, and baseline were found not to be significant covariates in the primary analysis model. At baseline and following all treatments (placebo, both doses of LEM, and flurazepam), the mean of the first SOL in each M-MSLT was longer than that for the three subsequent tests (Supplementary Figure 1). The second, third, and fourth SOL intervals were of similar mean duration. Individual subject changes in average SOL with LEM versus placebo did not show a consistent dose-related trend; approximately 50% (n = 33) of subjects had the same or longer average SOL after receiving either of the LEM doses versus after receiving placebo (27 subjects with LEM5 and 20 subjects with LEM10).
Analysis of LEM change from baseline in average SOL by M-MSLT (full analysis set)
| Placebo (n = 68) | LEM5 (n = 69) | LEM10 (n = 68) | |
|---|---|---|---|
| Treatment difference in change from baseline in average SOL, min | |||
| LSM change from baseline (SE) | –3.44 (0.56) | –4.58 (0.56) | –6.92 (0.56) |
| LSM difference vs. placebo (lower bound of 95% CI) | –1.15 (–2.12) | –3.48 (–4.46) | |
| 1-sided p-valuea | 0.0262 | <0.0001 |
ap-Value vs. placebo using a mixed effects model, including treatment, period, and sequence as fixed effects, baseline (pre-dose) measurement as a covariate where applicable, and subject nested within-treatment sequence as a random effect.
If the lower bound of the one-sided 95% CI was –6.0 min or more, the dose was considered to have a clinically meaningful effect.
CI, confidence interval; LEM5, lemborexant 5 mg; LEM10, lemborexant 10 mg; LSM, least squares mean; M-MSLT, Modified Multiple Sleep Latency Test; SE, standard error; SOL, sleep onset latency.
Subgroup analyses
Age, age category (<65 and ≥65 years), sex, BMI, and BMI category (<25 and ≥25 kg/m2) were not significant factors when added as covariates to the primary analysis. The lower bound of the 95% CI for difference versus placebo in change from baseline in average SOL remained above the threshold for a clinically meaningful effect for LEM5 and LEM10 in all subgroups, except for LEM10 in the male subgroup where the lower CI slightly exceeded the –6.0 min threshold (lower 95% CI –6.09 min; n = 18) (Supplementary Table 2).
Proportions of subjects meeting increased sleep propensity criteria
The percentages of subjects with increased sleep propensity were assessed according to three criteria: percentage of subjects with average SOL < 8.0 min, percentage of subjects with average SOL >6.0 min shorter than placebo, and percentage of subjects meeting both criteria. The proportion of subjects with average SOL <8.0 min was significantly greater than placebo (4.4%) for both LEM doses (LEM5, 15.9%; LEM10, 29.4%; p < 0.05 for each comparison), and suggested a trend for more sleep propensity with LEM10 compared with LEM5 (Table 5). Similar apparent dose–response relationships were seen for subjects with average SOL >6.0 min shorter than placebo (LEM5, 13.2%; LEM10, 29.4%) and subjects meeting both criteria (LEM5, 5.9%; LEM10, 19.1%) (Table 5). Additionally, the proportions of subjects with increased sleep propensity were statistically significantly greater with flurazepam compared with LEM5 or LEM10 regardless of the criterion applied (Table 5).
Subjects meeting increased sleep propensity criteria for average SOL by M-MSLT (full analysis set)
| Average SOL based on M-MSLT | Placebo (n = 68) | LEM5 (n = 69) | LEM10 (n = 68) | FLZ (n = 68) |
|---|---|---|---|---|
| <8.0 min, n (%) | 3 (4.4) | 11 (15.9) | 20 (29.4) | 36 (52.9) |
| p-Value vs. placebo | 0.0215 | <0.0001 | <0.0001 | |
| p-Value vs. FLZ | <0.0001 | 0.0009 | ||
| >6.0 min shorter than placebo, n (%) | 9 (13.2) | 20 (29.4) | 35 (51.5) | |
| p-Value vs. FLZ | <0.0001 | 0.0041 | ||
| <8.0 min and >6.0 min shorter than placebo, n (%) | 4 (5.9) | 13 (19.1) | 25 (36.8) | |
| p-Value vs. FLZa | <0.0001 | 0.0118 |
ap-Values vs. placebo or vs. FLZ using McNemar’s test.
FLZ, flurazepam 30 mg; LEM5, lemborexant 5 mg; LEM10, lemborexant 10 mg; M-MSLT, Modified Multiple Sleep Latency Test; SOL, sleep onset latency.
The percentage of sleep latency tests that resulted in actual sleep was 49.8% with placebo, 57.9% with LEM5, 69.5% with LEM10, and 84.1% with flurazepam. Overall, 8 subjects entered REM sleep during a sleep latency test; 1 subject each with placebo (1.5%), LEM5 (1.4%), and LEM10 (1.5%), and 5 subjects (7.4%) with flurazepam.
LEM plasma concentration and relationship with average SOL
Median LEM plasma concentrations at the end of M-MSLT measurements (i.e. at least 10 h after dosing) increased in approximate proportion to LEM dose, rising to 2.70 ng/mL with LEM5 and to 6.01 ng/mL with LEM10, and showed moderate variability (% coefficient of variation of 48.6 and 53.4, respectively). Change from baseline in average SOL showed a slight but statistically significant correlation with LEM plasma concentration, with greater decreases in average SOL at higher LEM concentrations (Pearson’s correlation coefficient −0.2746; p = 0.0179) (Figure 5). Median LEM plasma concentration was higher for subjects with average SOL <8.0 min compared with ≥8.0 min (5.24 vs. 3.45 ng/mL; p = 0.0016) (Figure 6). However, there was a large overlap between the two categories and a minimum or “threshold” LEM concentration associated with SOL >8 min could not be identified.
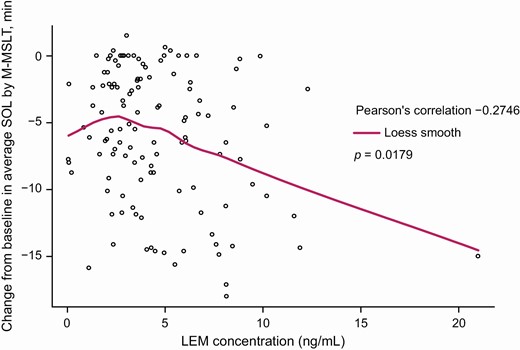
Locally weighted scatterplot smoothing (LOESS) fit of LEM plasma concentration vs. change from baseline in average SOL by M-MSLT (pharmacokinetic analysis set).
p-Value calculated using Kendall’s rank correlation test.
Plasma LEM was below the limit of quantitation for 10 subjects with LEM5 and 6 subjects with LEM10.
LEM, lemborexant; M-MSLT, Modified Multiple Sleep Latency Test; SOL, sleep onset latency.
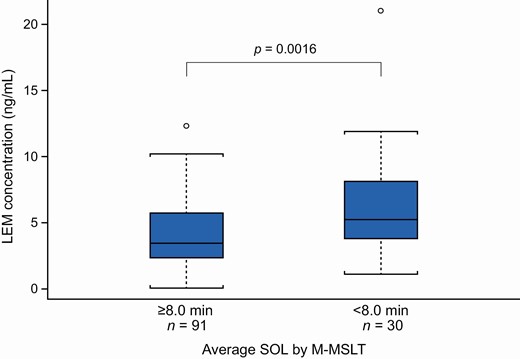
LEM plasma concentration by average SOL ≥8.0 vs. <8.0 min by M-MSLT (pharmacokinetic analysis set).
p-Value for ≥8.0 vs. <8.0 min using Wilcoxon rank-sum test.
Concentration data are presented as median (horizontal bar), interquartile range (box), and 95% confidence intervals (whiskers). Circles represent outliers.
Plasma LEM was below the limit of quantitation for 10 subjects with LEM5 and 6 subjects with LEM10.
LEM, lemborexant; M-MSLT, Modified Multiple Sleep Latency Test; SOL, sleep onset latency.
Safety and tolerability
TEAEs were reported for 7.2% of subjects with LEM5, 11.8% with LEM10, and 7.4% with flurazepam compared with 2.9% with placebo (Table 6). No severe TEAEs were reported, and no TEAEs led to discontinuation. Somnolence was the most common TEAE, reported for 5 subjects overall following treatment with either LEM5 (1 subject, 1.4%), LEM10 (3 subjects, 4.4%), or flurazepam (2 subjects, 2.9%). All TEAEs of somnolence were mild except for one event rated moderate in a subject treated with flurazepam. There was no clear relationship between TEAEs of somnolence and average SOL across the treatments.
Adverse event summary (safety analysis set)
| Category, n (%) | Placebo (n = 68) | LEM5 (n = 69) | LEM10 (n = 68) | FLZ (n = 68) |
|---|---|---|---|---|
| Subjects with ≥1 TEAE | 2 (2.9) | 5 (7.2) | 8 (11.8) | 5 (7.4) |
| Treatment-related TEAE | 1 (1.5) | 3 (4.3) | 5 (7.4) | 3 (4.4) |
| Severe TEAE | 0 | 0 | 0 | 0 |
| Serious TEAE | 0 | 0 | 0 | 0 |
| TEAEs in ≥2% of subjects in any active treatment group | ||||
| Somnolence | 0 | 1 (1.4) | 3 (4.4) | 2 (2.9) |
FLZ, flurazepam 30 mg; LEM5, lemborexant 5 mg; LEM10, lemborexant 10 mg; TEAE, treatment-emergent adverse event.
There were no clinically significant findings for laboratory parameters, vital signs, or ECGs.
Discussion
This is the first study to use the M-MSLT to evaluate the effects of sleep-promoting treatment on next-morning sleep propensity. The M-MSLT assay sensitivity was confirmed by the clinically meaningful increase in next-morning sleep propensity seen with flurazepam compared with placebo. In contrast, LEM5 and LEM10 did not meet the predefined threshold for a clinically meaningful effect on next-morning sleep propensity based on the primary endpoint of mean change from baseline in average SOL versus placebo. The robustness of this finding was supported by the subgroup analyses by age and BMI. In secondary evaluations of individual data, a dose-related trend was observed with LEM in the proportion of subjects with increased sleep propensity, whether defined as average SOL <8.0 min and/or average SOL >6.0 min shorter than placebo. The percentages of subjects with increased sleep propensity in the LEM5 and LEM10 groups were modest (up to 16% and 29%, respectively), whereas the percentages in the flurazepam group were much higher (up to 53%), consistent with a clinically important increase in sleep propensity with flurazepam that was not shown for either LEM dose. Consistent with this finding was the slight but statistically significant correlation between measures of increased sleep propensity and higher LEM plasma concentration also seen in our study. Overall, these results suggest that, while on average LEM shows no clinically important effect on next-morning sleep propensity, some individual subjects may experience residual effects, particularly with LEM10 as a result of the higher next-morning LEM exposure with this dose. Single doses of LEM5 and LEM10 were well-tolerated, consistent with the known safety profile of LEM.
The possibility of residual morning effects in some individuals after taking LEM10 is not a new finding and is consistent with the results of driving test studies. Although LEM5 and LEM10 did not cause statistically significant or clinically relevant mean changes in impairment of next-morning driving performance in adult or elderly subjects compared with placebo, driving ability was impaired in some subjects taking LEM10 [26]. The effects associated with LEM were not sufficient to result in any individual drive tests being stopped or canceled owing to sleepiness, in contrast with zopiclone, which resulted in three post-treatment drives being stopped [26]. However, a linear relationship was seen between LEM plasma concentration and driving performance, assessed by the standard deviation of lateral position in a standardized on-the-road driving test, after multiple LEM dosing up to 10 mg [26].
It is important to consider the current results in the context of findings using other methods of evaluating the potential for residual effects. Overall, based on a range of measures, clinical studies have indicated that LEM does not substantially impair next-day functioning. In healthy subjects and subjects with insomnia, LEM was shown to have minimal effects on objective and subjective measures of next-day sleepiness and residual drug effects, whether assessed at waketime or across-the-day, including next-morning sleep diary ratings, postural stability, cognitive performance assessment battery, and highway driving [14]. In addition, LEM has been shown to significantly improve daytime functioning, assessed by relevant items on the ISI [11], and increase subjective next-morning alertness, based on sleep diary ratings [12].
The M-MSLT used in our study differs from the standard MSLT in the shortened duration between waking and administration of the sleep latency test, allowing for assessment of any residual effects in the first few hours after waking. While the MSLT is a widely accepted test instrument, the M-MSLT has not been previously validated. However, the observation that 49.8% of sleep latency tests resulted in sleep onset within 20 min following placebo treatment suggests that subjects with insomnia disorder can readily fall asleep under conducive conditions so soon after waking. In addition, the previous night’s sleep has been reported to have a negligible effect on average SOL in insomnia patients [27], suggesting that measures of next-morning sleep propensity in our study are unlikely to have been confounded by any benefit of LEM on sleep quality the preceding night, although this hypothesis cannot be confirmed without measures of nocturnal polysomnography.
Other strengths of this study included the validation of the primary and secondary endpoints using a positive control, the crossover design, used to reduce the influence of confounding covariates and prevent an order effect, and the low rate of discontinuation, with only one subject failing to complete the four treatment periods. The exclusion of subjects with an average SOL <10 min at baseline was to ensure there was no “floor effect” on average SOL, but the findings may not be generalizable to subjects experiencing excessive daytime sleepiness before commencing LEM treatment. The study design was limited by the fact that subjects were constrained to an 8-hour sleep period, even if subjects habitually slept for longer or shorter periods. Thus, it is important to note that falling asleep during the M-MSLT may not equate to falling asleep in real-world situations. Finally, the study of single doses of both LEM5 and LEM10 in all subjects does not reflect the approved once-daily LEM regimen or permit titration to each subject’s optimized dose to treating insomnia disorder.
The results of this study using the M-MSLT are consistent with findings using other measures to evaluate residual effects of LEM [14]. In contrast to flurazepam, LEM at doses of 5 and 10 mg did not show a clinically meaningful mean increase in morning sleep propensity compared with placebo. However, individual data suggested a dose-related increase in sleep propensity and a slight but significant correlation with next-morning LEM plasma concentrations. Therefore, the possibility that some individuals may experience residual morning effects following treatment, particularly with the 10-mg dose, cannot be excluded.
Funding
This study was sponsored by Eisai Inc.
Role of the Sponsor
Eisai Inc. was involved in the study design, data collection, data analysis, and preparation of the manuscript.
Role of Contributors
All authors participated in the interpretation of study results and in the drafting, critical revision, and approval of the final version of the manuscript. DM, RR, and MM were involved in the study design. DM and RR were investigators in the study and were involved in data collection. All authors contributed to the interpretation of the study results.
Acknowledgments
Medical writing assistance was provided by Linda Donnini, PhD, CMPP and Rebecca Jarvis, PhD, CMPP of ProScribe – Envision Pharma Group, and was funded by Eisai Inc. ProScribe’s services complied with international guidelines for Good Publication Practice (GPP3). The authors would like to thank all study participants and Jim Ferry, PhD.
Disclosure Statement
DM has received grants from Eisai Inc. during the conduct of the study and grants from Actelion, Idorsia, Janssen, Jazz, Merck, Novartis, Takeda, and Vanda. RR has received grant/research support from Eisai Inc., Idorsia, Merck, and Vanda Pharmaceuticals. KP, ZH, and MM are employees of Eisai Inc. or Eisai Co., Ltd.
Data Availablility
De-identified subject data that underlie the results reported in this article will not be made available, but summary information will be made available on ClinicalTrials.gov.
References
