


Abstract
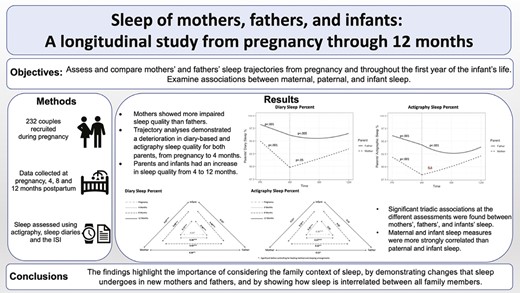
This study assessed and compared mothers’ and fathers’ sleep trajectories from pregnancy and throughout the first year of the infant’s life. We also examined associations between maternal, paternal, and infant sleep.
Two hundred and thirty-two couples were recruited for the study during pregnancy. Data were collected during pregnancy and at 4, 8, and 12 months postpartum. Maternal, paternal, and infant sleep were monitored at home for seven nights, using actigraphy, sleep diaries, and the Insomnia Severity Index (ISI).
Mothers showed more impaired sleep quality than fathers, at all assessments, whereas fathers had shorter sleep duration. Based on the ISI, about 70% of mothers and 50% of fathers showed at least subclinical insomnia at the different assessments. Trajectory analyses (controlling for feeding method and sleeping arrangements) demonstrated a significant deterioration in diary-based and actigraphy sleep quality for both parents, from pregnancy to 4 months. Both parents and infants had an increase in sleep quality from 4 to 12 months, though some parental sleep variables showed a quadratic pattern with a decrease in sleep quality at 8 months. Statistically significant triadic associations at the different assessments were found between mothers’, fathers’, and infants’ sleep. Maternal and infant sleep measures were more strongly correlated than paternal and infant sleep.
The findings highlight the importance of considering the family context of sleep, by demonstrating similarities and differences in the changes that sleep undergoes in new mothers and fathers and by showing how sleep is interrelated between all family members.
Research demonstrates that parental sleep changes considerably in the perinatal period. However, sleep has usually been examined separately in infants and parents, and fathers have been mostly ignored in this context. The present longitudinal study provides data on objective and self-reported sleep of mothers, fathers, and infants from pregnancy to 12 months. The findings demonstrate that, across the different assessments, maternal objective and self-reported sleep quality were poorer than paternal sleep and were more strongly associated with infant sleep. However, fathers’ sleep also undergoes significant changes following the arrival of the infant, suggesting that it should be given full attention in future studies. Additional research is also needed to explore the implications of consistent familial sleep disturbances on family functioning.
Introduction
The transition to parenthood is a major adjustment period for new parents [1]. One major change characterizing this period is the deterioration parents frequently experience in their sleep quality and duration [2–7]. In the beginning, during pregnancy, many mothers demonstrate an increase in insomnia symptoms, reduced sleep efficiency, and more frequent night waking. These changes are attributed mainly to pregnancy-related physical discomfort, fetal movements, and hormonal changes [2, 8]. The immediate postpartum period is characterized by a further deterioration in sleep quality and duration [7, 9], affected by factors such as changes in hormone levels, and the unconsolidated nature of infants’ sleep and their feeding needs [10–12]. Studies assessing the rates of poor sleep in the perinatal period, based on validated questionnaires such as the Pittsburgh sleep quality index or the Insomnia Severity Index (ISI) demonstrate that about 50%–60% of mothers during pregnancy and in the first few months postpartum score above the clinical cutoffs of these questionnaires (e.g. Pittsburgh sleep quality index global score >5, which indicates poor sleep quality) [8, 13–18].
While paternal sleep has been given much less focus in research, in comparison to maternal sleep, a few studies report that between 15% and 50% of men show symptoms of insomnia or short sleep duration during the perinatal period [2, 19]. The few studies that have directly compared sleep patterns of mothers and fathers showed that, although both parents experience a decrease in sleep quality throughout the perinatal period, mothers report more sleep disruptions than fathers [4, 6, 7, 19]. These differences in sleep quality between new mothers and fathers can probably be explained by the physiological changes that mothers undergo throughout this period and by the fact that mothers are typically more dominant in nighttime feeding and caregiving [20]. It should be noted, though, that most studies have used subjective reports of parental sleep, and only a few small-scale studies have investigated both parents’ sleep quality using objective sleep measures, which may provide a more accurate picture of parents’ sleep throughout this period [3, 4, 21, 22].
Furthermore, most of the studies about parental sleep in the postpartum period have focused on the first month after the birth of the infant, maybe because, this period is expected to be characterized by the most dramatic changes in parental sleep, given the fragmented nature of infant sleep at the beginning of life [12]. However, sleep problems affect 20%–30% of all young children between the ages of 6 months and 3 years [23], emphasizing the need to examine sleep disturbances in parents beyond the first few months [7]. The present study aimed at expanding the knowledge on parents’ sleep by objectively assessing the sleep of both mothers and fathers from pregnancy and throughout the first year of the infant’s life.
Interestingly, although it can be assumed that parental and infant sleep are intertwined, sleep of parents and infants has usually been studied separately, rather than within a family context, and has mostly focused on mothers as the primary caregiver, ignoring paternal sleep. Studying sleep within a family context is important given the dynamic bi-directional links between infant sleep problems and their social environments. In particular, parental factors such as parental soothing behaviors, cognitions, and emotional distress play an important role in the development of infant sleep [23, 24]. The few studies that examined the links between infant sleep and parental sleep [25, 26], using self-reported sleep measures, found stronger links between the sleep of mothers and infants than between fathers and infants. For instance, McDaniel and Teti [25] assessed the links between infant and parental diary-based night waking, when infants were 1 and 3 months old and found that these associations were stronger for mothers than for fathers, at both assessment points. Similar findings were found for infants aged 4–5 months [26]. An even smaller number of studies, using objective measures of sleep, provide preliminary evidence that maternal and infant objective sleep measures are strongly related [11, 27]. However, it appears that there are no previous studies examining the links between fathers’ and infants’ objective sleep, neither is there research on the associations between the sleep of mothers and fathers following the birth of their child.
To the best of our knowledge, only one study examined the triadic relations between fathers’, mothers’, and children’s sleep. This study, which focused on families of school-aged children, demonstrated that children’s sleep duration and quality were associated with fluctuations in their mothers’, but not fathers’, sleep that same night [28]. Given that parents usually share a bed and infants often sleep in close physical proximity to their parents, it is likely that family members’ sleep would be intertwined. Factors that have been associated with more maternal and infant nighttime wakefulness such as parent-infant room sharing (vs. sleeping in different rooms) and breastfeeding (vs. bottle feeding) [11, 29–31], may be particularly relevant when assessing associations between family members’ sleep. Thus, the goal of this study was to examine for the first time the links between the sleep of infants, mothers, and fathers, while taking into account sleeping arrangements and feeding methods.
The present study
The present study aimed at enhancing the understanding of sleep in the family context by longitudinally assessing objective (i.e. actigraphic) and reported sleep of mothers, fathers, and infants. Assessments were conducted in participants’ homes during the third trimester of pregnancy and at 4, 8, and 12 months after delivery. Our specific aims were to (1) investigate the differences between maternal and paternal sleep at different assessment points and to assess the prevalence of insomnia symptoms in mothers and fathers, (2) assess the trajectories of both parents’ sleep from pregnancy until 12 months postpartum and to examine infant sleep trajectories from 4 to 12 months, while controlling for sleeping arrangements and feeding method, and (3) examine the links between maternal, paternal, and infant objective and reported sleep at the different assessments, controlling for sleeping arrangements and feeding method.
Our hypotheses were that (1) maternal objective and reported sleep would be more disturbed than paternal sleep throughout the different assessment points, (2) both parents’ sleep would be poorer at 4 months compared to pregnancy and would improve from 4 months to 12 months postpartum. Also, infant sleep would become more consolidated from 4 to 12 months, and (3) there would be significant triadic associations between the sleep of infants, mothers, and fathers at the different assessment points. However, the links between maternal and infant sleep would be stronger than the links between paternal and infant sleep, based on both objective and reported sleep assessment methods.
Methods
Participants
Two hundred and thirty-two married Israeli couples expecting their first (85%) or second (15%) child were recruited during pregnancy through prenatal courses and announcements on internet forums for expectant parents. Inclusion criteria included a singleton, full-term pregnancy (i.e. >37 years) and complete mastery of Hebrew. Exclusion criteria were maternal chronic health conditions, including breathing-related problems (based on self-report).
Mothers’ mean age at pregnancy was 29.77 years (SD = 3.14), and fathers’ mean age was 31.48 years (SD = 3.32). A large proportion of the sample had a bachelor’s degree or higher (90.79% of mothers and 83.41% of fathers). In about 80% of families, monthly income was at or above the mean income in Israel at the time of the study. All participants lived in either the center or southern regions of Israel.
Sociodemographic characteristics, mostly collected during the third trimester of pregnancy, are presented in Table 1.
Descriptive statistics of demographic variables
| Mothers | Fathers | Infants | ||
|---|---|---|---|---|
| Age | Age | |||
| Four months | ||||
| Mean (SD) | 29.77 (3.14) | 31.48 (3.32) | Mean (SD) | 4.33 (0.43) |
| Range | 22–43 | 21–43 | Range | 4–5.5 |
| Education level | Eight months | |||
| High-school diploma (%) | 9.21 | 16.59 | Mean (SD) | 8.60 (0.64) |
| Bachelor’s degree (%) | 50.44 | 58.99 | Range | 7.5–9.5 |
| Master’s degree (%) | 36.84 | 18.43 | Twelve months | |
| Ph.D. degree (%) | 3.51 | 5.99 | Mean (SD) | 12.71 (0.65) |
| Family income | Range | 11.5 – 13.5 | ||
| High below average income (%) | 5.70 | Gender | ||
| Below average income (%) | 14.03 | Four months | 116 females (56.04%); 91 males (43.96%) | |
| Average income (%) | 19.30 | Eight months | 100 females (56.50%); 77 males (43.50%) | |
| Above average income (%) | 53.51 | Twelve months | 93 females (60.39%); 61 males (39.61%) | |
| High above average income (%) | 7.46 | Sleeping arrangements–4m | ||
| Parent's employment (part-time or full-time) | Solitary sleeping (%) | 19.89 | ||
| Third trimester of pregnancy (%) | 92.6 | 97.2 | Room-sharing (separate beds) (%) | 77.90 |
| Four months (%) | 36.3 | 97.6 | Bed-sharing (%) | 2.21 |
| Eight months (%) | 86.6 | 97.3 | Sleeping arrangements–8m | |
| Twelve months (%) | 85.1 | 97.6 | Solitary sleeping (%) | 53.74 |
| Full or partial breastfeeding | Room sharing (separate beds) (%) | 42.18 | ||
| Four months (%) | 84.9 | Bed-sharing (%) | 4.08 | |
| Eight months (%) | 59.1 | Sleeping arrangements–12m | ||
| Twelve months (%) | 43.2 | Solitary sleeping (%) | 70.87 | |
| Room-sharing (separate beds) (%) | 22.83 | |||
| Bed-sharing (%) | 6.30 |
Procedures
The study was approved by the Helsinki Committee of Soroka Medical Center. All participants signed informed consent after receiving a full explanation of all study procedures at the pregnancy assessment and again before the 4-month assessment to confirm the participation of the infant. Participants were visited by a research assistant at each assessment point at their home, who instructed them about the study’s procedures (e.g. actigraphy use and diaries completion). Parental and infant sleep were assessed using actigraphy and sleep diaries for 7 nights, excluding the night between Friday and Saturday (weekend in Israel), which was excluded because many families in Israel change their routine and spend Friday evenings/nights outside their homes. Assessing sleep on these unusual nights might have affected the average weekly sleep scores. Thus, we conducted assessments only on days when all family members slept at home and were healthy.
Questionnaires were used to assess sociodemographic measures and feeding methods. After completing each assessment, participants received a small gift (value of about 20$) and a graphic report of their actigraphic sleep.
Measures
Actigraphy.
Actigraphy, a motility-based wristwatch-like device, has been established as a reliable and valid objective method for studying and assessing sleep–wake patterns in adults and children in their natural sleep environment [32, 33]. We used the micromotion logger sleep watch (Ambulatory Monitoring, Inc. Ardsley, NY) with a 1-min epoch interval according to the standard working mode for sleep–wake scoring. The Actigraphic Sleep Analysis program was used to score the data based on Sadeh’s validated scoring algorithm for infants [34] and adults [35]. Parents were asked to wear the actigraph on their non-dominant wrist and to attach it to their infants’ ankles 15 min before they went to sleep and to remove it 15 min after they woke up. Most fathers, mothers, and infants (~75%) had valid actigraphy data for at least five assessment nights at each study point—the minimum number of nights recommended for obtaining reliable measures [36]. However, due to technical problems (e.g. actigraph fell off in the middle of the night), some data were missing. Since fewer than 5 days have been reported before with reasonable reliability [37] and as we favored to minimize disqualification of data, we kept the actigraphic assessments of 3–4 nights after verifying that the mean scores of actigraphic measures for participants with <5 nights were not significantly different than those who were assessed for five or more nights. Thus, the minimum number of nights to be included in the analyses was three. Based on this criteria, actigraphy data were obtained for 88.4% of mothers and 89.7% of fathers at pregnancy; 92.6% of mothers, 93.0% of fathers, and 86.6% of infants at 4 months; 93.7% of mothers, 91.0% of fathers, and 85.1% of infants at 8 months; and 85.1% of mothers, 82.6% of fathers, and 69.6% of infants at 12 months. The actigraphic measures included in the present study were: (1) sleep minutes—sleep minutes from sleep onset to morning awakening, excluding wakefulness during the night, (2) sleep percent—the percentage of sleep minutes from total sleep period (from sleep onset to morning wake-up time) (3) night waking—number of night-waking lasting 5 min or longer, and (4) longest sleep period—longest continuous sleep period without waking.
Sleep diaries.
Sleep diaries are commonly used in sleep research and have been validated relative to objective sleep measures, such as polysomnography [38]. In the present study, parents were instructed to complete sleep diaries regarding their own and their infant’s sleep in parallel to the actigraphic assessment. These diaries were completed in the morning following each assessment night. Diary data were obtained for at least three nights for all parents and infants. The sleep measures included in the study were: (1) sleep minutes, (2) sleep percent—the percentage of sleep minutes from the total sleep period (from sleep onset to morning wake-up time); (3) number of night waking.
Insomnia Severity Index.
The ISI [39] is a reliable and valid questionnaire that assesses the severity of both nighttime and daytime components of insomnia. The dimensions evaluated are severity of sleep onset, sleep maintenance, early morning awakening problems, sleep dissatisfaction, interference of sleep difficulties with daytime functioning, noticeability of sleep problems by others, and distress caused by sleep difficulties. A 5-point Likert scale is used to rate each item from “0” (indicating that there is no problem) to “4” (indicating a very severe problem). The total scores range from 0 to 28, divided into four distinct clinical categories: no clinically significant insomnia (0–7); Subthreshold insomnia (8–14); moderate clinical insomnia (15–21); severe clinical insomnia (22–28) [40]. In our study, we combined the last two categories together, creating a clinical insomnia category for scores over 14. Both parents completed the ISI.
Demographic data.
During the third trimester of pregnancy, parents provided the following background information: age, education (high-school education, bachelor’s degree, master’s degree, doctoral degree, or other), household income (1–5 Likert scale ranging from 1 = far below average; 5 = far above average). Information on number of children and infant gender was collected at 4 months. At each postpartum assessment point, mothers were asked to indicate whether the infant slept in a separate room or in the parents’ room. Only a small number of parents shared a bed with their infants (N = 4 at 4 months, N = 6 at 8 months, and N = 8 at 12 months). Since there were almost no significant differences in the sleep measures (except for maternal diary sleep minutes and paternal actigraphic sleep minutes at 8 months) between bed-sharing and room-sharing (without bed-sharing) families, we combined these two groups into one group referred to as “room-sharing” families without further distinction in the analyses. Sleeping arrangement distribution across assessment points is presented in Table 1. Feeding method was assessed at each assessment point using three options: (1) exclusive breastfeeding, (2) partial breastfeeding, or (3) exclusive formula feeding. For the present study, full and partial breastfeeding were combined into one category.
Analytic Approach
Cross-sectional analyses
Paired-sample t-tests were conducted to compare maternal and paternal sleep at each assessment point. We used the Benjamini–Hochberg (B–H) correction to adjust p-values due to multiple comparisons [41, 42].
Pearson correlations were calculated to examine the associations between maternal, paternal, and infant objective and reported sleep at the different assessments. Fisher r-to-z transformations [43] were applied to examine whether the difference between these correlations is statistically significant; that is, whether the associations between maternal and infant sleep are stronger than the associations between paternal and infant sleep.
Longitudinal analyses
Due to the nested structure of our data (nights nested within phases, which themselves are nested within families), we used multilevel regression models (MLMs) to assess the trajectories of both parents’ sleep from pregnancy to 12 months postpartum, as well as infants’ sleep trajectories from 4 to 12 months. Importantly, MLMs are robust against missing data [44].
Because different assessment points were used for parents and infants (i.e. obviously, only parents were assessed during pregnancy), infant sleep growth models were analyzed separately from parental sleep growth models.
Parental sleep trajectories.
To assess the sleep trajectories of both parents, we ran a series of three-level MLMs, one for each sleep variable (i.e. diary and actigraphic sleep minutes, diary and actigraphic sleep percent, diary and actigraphic night waking, actigraphic longest sleep period, and ISI score). To account for the discontinuous change in sleep before and after birth, we used a two-slopes piecewise model. Following Hoffman [45], the first measurement postpartum (at 4 months) served as a breakpoint between slopes. To this end, a Birth variable was created as a dichotomous variable, for which observations from pregnancy were coded as 0, and observations at 4 months onward were coded as 1. Accordingly, for testing the linear slope after birth, the Time variable was coded as follows: 0–pregnancy and 4-month assessment, 1–8-month assessment, and 2–12-month assessment. For each outcome, we tested both linear and quadratic time models and used the model which showed best fit to the data (according to the following fit indices: −2LL deviance test, AIC and BIC). To account for partners’ interdependence, mothers’ and fathers’ sleep were estimated simultaneously, using the two intercepts/slopes models for dyadic nested data. In all models, breastfeeding (−0.5–no breastfeeding, +0.5–full or partial breastfeeding) and room sharing (−0.5–infant sleeps in a separate room, +0.5–infant sleeps in parents’ room) were included as level 2 covariates.
The generic models’ equations were as follows:
Level 1:
Level 2:
Level 3:
In these equations, Sleepij(m/f)k is the sleep index (e.g. sleep minutes) on day i from phase j for mother (m) or father (f) in couple k. Sleep is modeled at level 1 as a function of the mother’s and father’s sleep means at this phase (π0jmk and π0jfk, accordingly) and separate residual terms quantifying the specific-day deviation from these means (eij(m/f)k). These within-phase residuals were allowed to correlate among partners to account for partners’ interdependence at the day-level sleep.
Mother’s and father’s sleep means at each phase π0j(m/f)k were modeled at level 2 as a function of mother’s/father’s means beyond phases (β00(m/f)k), and the birth (β01(m/f)k) and time effects (β02(m/f)k,β03(m/f)k), controlling for breastfeeding and room sharing (β04(m/f)k * Breastfeedingjk, β05(m/f)k * Room-sharingjk).
Level 2 residual terms (r0j(m/f)k) quantifying the specific phase deviation for each subject. These between-phase residuals were allowed to correlate among partners to account for partners’ interdependence at the phase-level sleep.
Father’s and mother’s sleep intercepts (β00(m/f)k) were modeled at level 3 as a function of the sample’s fixed intercepts (γ00(m/f)0) and the participants’ deviation from the sample’s fixed effects (i.e. random effects: u00(m/f)k). These between-person residuals were allowed to correlate among partners to account for partners’ interdependence at the couple-level sleep. We also tried to model the other time effects (Birth, Time, and Time2) with both fixed () and random effects (). However, the final models included only random effects that significantly improved model fit (as determined by the deviance test) [45]. The two covariates (feeding method and sleeping arrangement) were modeled only as fixed effects ( and ).
Infant sleep trajectories.
To assess infant sleep trajectories, we ran a series of three-level MLMs, one for each sleep variable. The Time variable was coded as follows: 0–4-month assessment, 1–8-month assessment, and 2–12-month assessment. For each outcome, we tested both linear and quadratic time models, and again used fit indices to determine which model fit the data best.
The generic models’ equations were as follows:
Level 1:
Level 2:
Level 3:
In these equations, Sleepijk is the sleep index (e.g. sleep minutes) on day i from phase j for infant k. Sleep is modeled at level 1 as a function of the infant’s sleep means at this phase (π0jk) and separate residual term quantifying the specific-day deviation from this mean (eijk). At level 2, the infant’s sleep means (π0jk) was modeled as a function of the linear (β01k) effect of Time, breastfeeding (β02k), room sharing (β03k), plus a level 2 residual term quantifying the specific phase deviation for this infant (r0jk). At level 3, the sleep of infant k was modeled as a function of the sample’s intercepts (γ000) and the sample’s Time effects (γ010), plus the deviation of each infant from the sample’s mean. Intercepts and slopes were considered random between babies, although the final models included only random effects that significantly improved model fit.
Models were estimated using the ‘nlme’ R package [46]. Simple slopes were computed using the ‘emmeans’ R package [47]. Standardized estimated fixed effects of the models were obtained by standardizing the raw variables and reestimating the models [48].
Results
Preliminary analyses
Sample size and dropout.
At 4, 8, and 12 months, the sample included 116 female infants (56%), 100 female infants (56.5%), and 93 female infants (60.4%), respectively. Of the 232 families recruited, 21 dropped out from the study before the 4-month assessment point: 16 due to overload and five because of change in residence. Twenty-seven families dropped out before the 8-month assessment: 21 due to overload, 4 of them because of change in residence, and two as a result of the COVID-19 pandemic. Finally, 23 dropped out before the 12-month assessment: 18 due to overload, three because of change in residence, and two as a result of the COVID-19 pandemic. Four families did not participate in the 4-month assessment but returned to the study at 8 months, and three families did not participate in the 8-month assessment but returned to the study at 12 months (Figure 1).
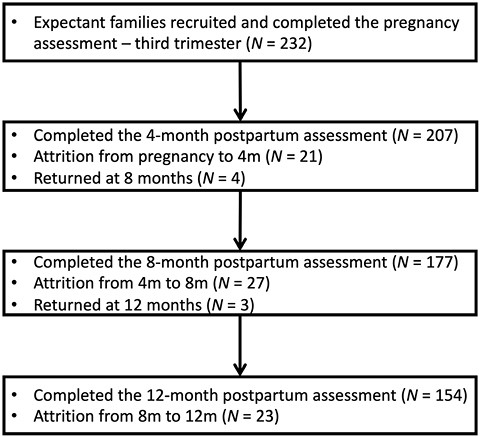
Study flow chart.
The families who withdrew from the study were compared with the participating families on sociodemographic variables (i.e. parental age and education, family income, parents’ employment status, feeding method, and sleeping arrangements). No differences were found in any of these variables.
Links between background variables and main study variables.
We examined the correlations between demographic variables (e.g. maternal and paternal age and education) and sleep measures (diary and actigraphic sleep minutes, sleep percent, night waking, as well as actigraphic longest sleep period, and the ISI score) throughout the different time points. Because no consistent pattern emerged, we did not control for these variables in subsequent analyses. We also examined whether there were differences in sleep measures between families who had one child and those who also had an older child. We found just a few sporadic and inconsistent differences—that is, there were only three differences, and each time with a different variable (i.e. paternal actigraphic sleep minutes at 4 months, maternal diary night-waking at 8 months, and paternal diary sleep percent at 12 months). Because of these few and inconsistent differences, we did not control for number of children in the main analyses.
Independent sample t-tests were conducted to examine whether there are differences in sleep measures between room-sharing and solitary-sleeping families at each assessment point. As we found consistent significant differences between solitary and room-sharing families (Supplementary Tables 1–3), we controlled for sleeping arrangements in subsequent analyses.
Independent sample t-tests were also conducted to examine differences in sleep measures between breastfeeding and non-breastfeeding families at each assessment point. These analyses demonstrated consistent differences between breastfeeding and non-breastfeeding families (Supplementary Tables 4–6) and therefore, we controlled for feeding method in subsequent analyses.
We also examined the frequencies of breastfeeding in room sharing and solitary sleeping arrangements at each assessment point. Breastfeeding was significantly more common in room-sharing families than in solitary-sleeping families at 8 months (χ2 (1) = 5.73, p = .001), and 12 months (χ2 (1) = 13.82, p < .001), but not at 4 months. At 4 months, 87.26% of the room-sharing mothers breastfed, whereas, 75% of solitary-sleeping mothers breastfed. At 8 and 12 months, about 65% of room-sharing mothers breastfed, whereas 48.72% of solitary-sleeping mothers at 8 months and 31.46% at 12 months breastfed.
Main analyses
Cross-sectional comparison of maternal and paternal sleep patterns.
Paired sample t-tests were conducted to examine differences between maternal and paternal sleep at each assessment point (Table 2).
T-tests comparing maternal and paternal sleep variables based on sleep diaries, actigraphy, and the Insomnia Severity Index
| Maternal sleep | Paternal sleep | |||||
|---|---|---|---|---|---|---|
| M | SD | M | SD | t(df) | Cohen’s d | |
| Pregnancy (n = 232) | ||||||
| Diary–sleep minutes | 414.61 | 45.94 | 405.14 | 43.69 | 2.64 (224)* | 0.18 |
| Diary–sleep percent | 94.77 | 4.86 | 98.20 | 2.54 | −10.11 (224)*** | 0.67 |
| Diary–night waking | 2.50 | 1.11 | 1.21 | 1.04 | 14.96 (225)*** | 0.99 |
| Actigraph–sleep minutes | 403.48 | 53.11 | 399.72 | 48.70 | 0.90 (202) | 0.06 |
| Actigraph–sleep percent | 91.89 | 7.49 | 95.99 | 3.77 | −8.27 (202)*** | 0.58 |
| Actigraph–night waking | 2.16 | 1.34 | 1.31 | 0.94 | 9.01 (202)*** | 0.63 |
| Actigraph–longest sleep period | 246.76 | 83.41 | 294.82 | 80.25 | −7.31 (202)*** | 0.51 |
| ISI | 10.84 | 4.84 | 6.96 | 4.65 | 8.59 (210)*** | 0.59 |
| Four months (n = 207) | ||||||
| Diary–sleep minutes | 407.47 | 51.20 | 394.28 | 48.42 | 3.03 (197)** | 0.21 |
| Diary–sleep percent | 88.64 | 6.77 | 95.96 | 4.21 | −15.32 (197)*** | 1.09 |
| Diary–night waking | 3.30 | 1.55 | 1.75 | 1.31 | 13.12 (198)*** | 0.93 |
| Actigraph–sleep minutes | 399.77 | 48.51 | 384.53 | 51.00 | 3.40 (181)** | 0.25 |
| Actigraph–sleep percent | 87.07 | 7.56 | 93.41 | 5.72 | −9.74 (181)*** | 0.72 |
| Actigraph–night waking | 2.58 | 1.11 | 1.61 | 1.09 | 9.87 (181)*** | 0.73 |
| Actigraph–longest sleep period | 203.81 | 66.33 | 254.87 | 79.60 | −7.38 (181)*** | 0.55 |
| ISI | 10.12 | 4.54 | 7.79 | 4.64 | 5.49 (167)*** | 0.42 |
| Eight months (n = 177) | ||||||
| Diary–sleep minutes | 395.55 | 49.50 | 390.25 | 49.97 | 1.224 (160) | 0.10 |
| Diary–sleep percent | 91.36 | 6.17 | 95.49 | 5.06 | −8.03 (160)*** | 0.63 |
| Diary–night waking | 2.82 | 1.40 | 1.77 | 1.16 | 8.69 (160)*** | 0.68 |
| Actigraph–sleep minutes | 392.05 | 49.66 | 380.32 | 53.48 | 2.67 (153)* | 0.21 |
| Actigraph–sleep percent | 90.12 | 6.49 | 92.89 | 5.54 | −4.78 (153)*** | 0.38 |
| Actigraph–night waking | 2.21 | 1.17 | 1.68 | 0.99 | 4.94 (153)*** | 0.40 |
| Actigraph–longest sleep period | 228.83 | 73.86 | 254.29 | 71.15 | −3.49 (153)** | 0.28 |
| ISI | 10.24 | 5.09 | 7.99 | 4.45 | 4.45 (141)*** | 0.37 |
| Twelve months (n = 154) | ||||||
| Diary–sleep minutes | 399.47 | 46.24 | 391.27 | 50.33 | 1.664 (138) | 0.14 |
| Diary–sleep percent | 93.96 | 5.11 | 96.45 | 3.93 | −5.10 (138)*** | 0.43 |
| Diary–night waking | 2.33 | 1.51 | 1.51 | 1.13 | 6.30 (138)*** | 0.53 |
| Actigraph–sleep minutes | 401.53 | 49.74 | 382.69 | 53.23 | 3.53 (121)** | 0.32 |
| Actigraph–sleep percent | 92.71 | 6.28 | 94.12 | 4.76 | −2.27 (121)* | 0.21 |
| Actigraph–night waking | 1.75 | 1.21 | 1.52 | 1.00 | 1.80 (121) | 0.16 |
| Actigraph–longest sleep period | 260.48 | 84.15 | 265.94 | 73.83 | −0.65 (121) | 0.06 |
| ISI | 8.85 | 4.84 | 7.38 | 4.62 | 2.74 (118)* | 0.25 |
Sleep minutes—true sleep time; Sleep percent—the percentage of nocturnal sleep minutes out of night duration (from sleep onset to morning awakening); Night waking—number of night waking (Actigraph—night waking lasting at least 5 min); Longest sleep period—longest continuous sleep episode during the night.
*p < .05,
**p < .005;
***p < .001. p-values were adjusted the Benjamini-Hochberg correction.
At pregnancy, significant differences between mothers-to-be and fathers-to-be were found for all sleep measures (except for actigraphic sleep minutes), with expectant mothers showing poorer sleep quality manifested in lower diary and actigraphic sleep percent, a higher number of diary and actigraphic night waking, shorter actigraphic longest sleep period, and a higher ISI score. Expectant fathers showed shorter diary sleep minutes. At 4 and 8 months, similar significant differences between mothers and fathers were found for all sleep measures, with mothers showing more impaired sleep quality than fathers, and fathers showing shorter sleep minutes. At 12 months, mothers still showed significantly poorer sleep quality than fathers as manifested in lower diary and actigraphic sleep percent, a higher number of diary night waking, and a lower ISI score. Fathers had significantly shorter actigraphic sleep minutes.
Rates of parents with clinical levels of insomnia symptoms.
We examined the frequencies of parents meeting the clinical cutoff level of insomnia based on the ISI and compared these rates between mothers and fathers throughout the different assessment points. About 50% of the mothers showed subclinical insomnia (i.e. ISI = 8–14) at the different assessment points (49.6% at pregnancy, 51.5% at 4 months, 49.4% at 8 months, and 48.6% at 12 months), whereas about 40% of the fathers showed subclinical insomnia at the different assessment points (36.3% at pregnancy, 41.2% at 4 months, 43.9% at 8 months, and 40% at 12 months). The difference between parents was statistically significant at pregnancy (χ2 (1) = 9.83, p = .001) and at 12 months (χ2 (1) = 3.97, p = .004). About 20% of mothers showed clinical levels of insomnia (i.e. ISI > 14) at the first three assessments (23% at pregnancy, 19.2% at 4 months, 20.7% at 8 months), with 12.2% presenting clinical levels at 12 months postpartum, whereas 7%–10% of the fathers presented clinical levels of insomnia at the different assessments (10.2% at pregnancy, 9.4% at 4 months, 6.8% at 8 months, and 8.8% at 12 months). The difference between parents was statistically significant at pregnancy (χ2 (1) = 12.16, p < .001), 4 months (χ2 (1) = 8.96, p = .003), and at 8 months (χ2 (1) = 13.09, p < .001), but not at 12 months (χ2 (1) = 1.69, p = .19).
Growth models: change over time in parental sleep variables.
Table 3 presents the fixed effects and standardized fixed effects of the growth MLMs estimating change over time in sleep for both parents, controlling for feeding method and sleeping arrangements. All sleep trajectories are depicted in Figure 1.
Fixed effects estimates (SE) from the growth multilevel models (MLMs) for parental sleep (controlling for feeding method and sleeping arrangements)
| Sleep minutes | Night waking | Sleep percent | Longest sleep period | ISI score | ||||||
|---|---|---|---|---|---|---|---|---|---|---|
| Est.(SE) | Std. Est. | Est.(SE) | Std. Est. | Est.(SE) | Std. Est. | Est.(SE) | Std. Est. | Est.(SE) | Std. Est. | |
| Mother | ||||||||||
| Sleep diaries | ||||||||||
| Intercept | 413.32(3.01)*** | 0.17 | 2.45(0.07)*** | 0.15 | 94.96(.32)*** | 0.07 | ||||
| Birth | −7.50(3.61)* | −0.10 | .61(.10)*** | 0.32 | −5.13(0.41)*** | −0.65 | ||||
| Time | −19.26(7.22)** | −0.25 | −0.39(0.20)* | −0.20 | 1.63(0.82)* | 0.21 | ||||
| Time2 | 8.40(3.45)* | 0.11 | 0.04(0.09) | 0.02 | 0.08(0.39) | 0.01 | ||||
| Actigraphy | ||||||||||
| Intercept | 402.26(3.18)*** | 0.12 | 2.18(.07)*** | 0.20 | 91.89(0.41)*** | −0.05 | 243.92(4.99)*** | −0.07 | ||
| Birth | 1.01(3.80) | 0.01 | .13(.09) | 0.08 | 3.44(.47)*** | −0.41 | −19.99(6.23)** | −0.19 | ||
| Time | −22.31(7.99)** | −0.30 | 0.01(.18) | 0.01 | 1.40(1.04) | 0.17 | −5.00(10.96) | −0.05 | ||
| Time2 | 10.22(3.86)** | 0.14 | −0.13(0.09) | −0.08 | 0.22(0.50) | 0.03 | 10.39(5.16)* | 0.10 | ||
| ISI | ||||||||||
| Intercept | 10.59(0.30)*** | 0.35 | ||||||||
| Birth | −0.54(.13)*** | −0.11 | ||||||||
| Time | 1.23(.62)* | 0.25 | ||||||||
| Time2 | −0.81(.30)** | −0.17 | ||||||||
| Father | ||||||||||
| Sleep diaries | ||||||||||
| Intercept | 404.99(3.01)*** | 0.06 | 1.20(0.07)*** | −0.51 | 98.22(0.20)*** | 0.48 | ||||
| Birth | −9.19(3.54)** | −0.12 | 0.46(0.07)*** | 0.24 | −2.09(0.34)*** | −0.26 | ||||
| Time | −14.11(6.74)* | −0.19 | 0.22(0.16) | 0.11 | −1.43(0.62)* | −0.18 | ||||
| Time2 | 5.66(3.24) | 0.07 | −0.13(0.07) | −0.07 | 0.80(0.30)** | 0.10 | ||||
| Actigraphy | ||||||||||
| Intercept | 399.42(3.38)*** | 0.08 | 1.31(0.07)*** | −0.35 | 96.07(0.34)*** | 0.45 | 294.86(5.87)*** | 0.41 | ||
| Birth | −11.00(3.83)*** | −0.15 | 0.14(008) | 0.09 | −1.79(0.42)*** | −0.21 | −31.50(6.54)*** | −0.29 | ||
| Time | −13.26(7.54) | −0.18 | 0.47(0.17)** | 0.30 | −3.10(0.90)*** | −0.37 | −22.95(11.21)* | −0.21 | ||
| Time2 | 4.18(3.65) | 0.06 | −0.22(0.08)** | −0.14 | 1.44(0.44)*** | 0.17 | 12.06(5.41)* | 0.11 | ||
| ISI | ||||||||||
| Intercept | 6.94(0.34)*** | −0.39 | ||||||||
| Birth | 0.90(0.09)*** | 0.18 | ||||||||
| Time | 0.98(0.53) | 0.20 | ||||||||
| Time2 | −0.44(0.26) | −0.09 | ||||||||
Birth—the transition from pregnancy to 4 months postpartum; Sleep minutes—true sleep time; Night waking—number of night waking (Actigraph – night-waking lasting at least 5 min); Sleep percent—the percentage of nocturnal sleep minutes out of night duration (from sleep onset to morning awakening); Longest sleep period—longest continuous sleep episode during the night; ISI Score—Insomnia Severity Index score.
*p < .05,
**p < .005;
***p < .001; significant effects appear in bold.
Changes from pregnancy to 4 months postpartum:
Diary sleep minutes decreased significantly in both parents (Figure 2, panel a), and actigraphic sleep minutes decreased significantly for fathers from pregnancy to 4 months postpartum (panel b). As shown in panels c–d, for actigraphic and diary sleep percent, there was a significant decrease for both parents. There was also a significant increase in diary night waking for both parents (panel e). However, no significant effect was found for actigraphic night waking for both parents (panel f). For the longest sleep period, there was a significant decrease again for both parents (panel g). As shown in panel h, the ISI score increased significantly only for fathers, while mothers demonstrated a significant decrease in their ISI score from pregnancy to 4 months.
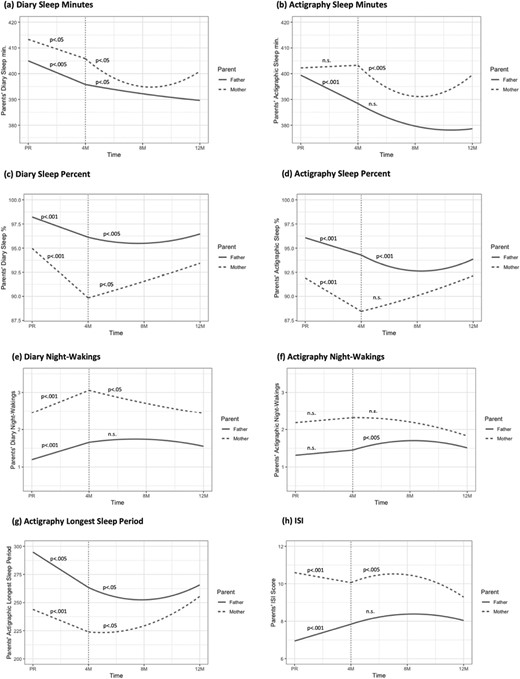
Maternal and paternal sleep trajectories from pregnancy to 12 months postpartum (controlling for feeding method and sleeping arrangements). Note. PR- pregnancy; M – months; Sleep minutes- true sleep time; Sleep percent -the percentage of nocturnal sleep minutes out of night duration (from sleep onset to morning awakening); Night wakings -number of night-wakings (Actigraph – night-wakings lasting at least 5 min); Longest sleep period -longest continuous sleep episode during the night; ISI - Insomnia Severity Index score. After birth, both linear and quadratic time models were tested: When both Linear and Quadratic effects were significant, we presented the p-value only for the quadratic effect (except for panel g – for mothers, only the Quadratic effect was significant, and not the Linear effect). When only the Linear effect was significant, we presented the p-value for that effect. n.s indicates that both Linear and Quadratic effects were not significant.
Changes from 4 months to 12 months postpartum:
For diary and actigraphic sleep minutes, there were significant Time and Time2 effects for mothers. As shown in Figure 2a–b, there was a decrease from 4 to 8 months, and an increase from 8 to 12 months. For fathers, a significant time effect was found for diary sleep minutes, indicating an overall decrease during this period (panel a), while no significant time effect was found for actigraphic sleep minutes (panel b).
For sleep percent, a significant Time effect was found for mothers, based on the sleep diaries, indicating an increase from 4 to 12 months (panel c), while no significant time effect was found for actigraphic sleep percent (panel d). For fathers, there were significant Time and Time2 effects for diaries and actigraphic sleep percent. As shown in panels c–d, there was a decrease from 4 to 8 months, and an increase from 8 to 12 months.
For the number of night waking, a significant Time effect was found for mothers based on the sleep diaries, demonstrating an overall decrease in night waking from 4 to 12 months (panel e), while no significant time effect was found for actigraphic night waking (panel f). For fathers, no significant effect was found for diary night waking (panel e), but there were significant Time and Time2 effects for actigraphic night waking. As shown in panel f, there was an increase in the number of fathers’ night waking from 4 to 8 months, and a decrease from 8 to 12 months.
For actigraphic longest sleep period, a significant Time2 effect was found for mothers, and significant Time and Time2 effects were found for fathers. As shown in panel g, there was an increase in longest sleep period from 4 to 8 months that became significantly steeper from 4 to 8 months for mothers. For fathers, there was a decrease from 4 to 8 months, and an increase from 8 to 12 months.
For the ISI score, significant Time and Time2 effect were found for mothers only. As panel h shows, there was an increase in insomnia symptoms from 4 to 8 months, and a decrease from 8 to 12 months. No significant effects were found for fathers.
Growth models: change over time in infant sleep.
Descriptive statistics of diary and actigraphic infant sleep measures are presented in Supplementary Table 7.
Table 4 presents the fixed effects of the growth MLMs estimating change over time for infants, controlling for feeding methods and sleeping arrangements.
Fixed effects estimates (SE) from the growth multilevel models (MLMs) for infant sleep (controlling for feeding method and sleeping arrangements)
| Sleep minutes | Night waking | Sleep percent | Longest sleep period | |||||
|---|---|---|---|---|---|---|---|---|
| Est.(SE) | Std. Est. | Est.(SE) | Std. Est. | Est.(SE) | Std. Est. | Est.(SE) | Std. Est. | |
| Actigraphy | ||||||||
| Intercept | 546.37(9.62)*** | 0.20 | 3.52(0.22)*** | 0.09 | 88.37(0.87)*** | −0.16 | 230.68(10.39)*** | 0.05 |
| Time | 40.00(12.19)** | 0.10 | −0.33(0.11)** | −0.15 | 1.81(0.44)*** | 0.22 | 12.64(5.24)* | 0.12 |
| Time2 | −12.26(5.93)* | −0.14 | ||||||
| Sleep diaries | ||||||||
| Intercept | 621.54(7.45)*** | 0.19 | 2.14(0.20)*** | −0.40 | 95.44(0.48)*** | 0.13 | ||
| Time | 6.72(3.11)* | 0.08 | −0.01(0.09) | −0.00 | 1.06(0.21)*** | 0.19 | ||
| Time2 | ||||||||
Sleep minutes—true sleep time; Night waking—number of night waking (Actigraph—night waking lasting at least 5 min); Sleep percent—the percentage of nocturnal sleep minutes out of night duration (from sleep onset to morning awakening); Longest sleep period—longest continuous sleep episode during the night.
*p < .05,
**p < .01,
***p < .001.
Significant Time and Time2 effects were found for diary sleep minutes, indicating an increase from 4 to 8 months, which became more moderate from 8 to 12 months. For actigraphic sleep minutes, only a significant Time effect was found, demonstrating an increase over time for this variable. Actigraphic night waking decreased over time, whereas no significant Time effect was found for diary night waking. Actigraphic and diary sleep percent increased over time, as well as actigraphic longest sleep period. Overall, these changes indicate an increase in infant sleep consolidation over time.
Associations between maternal, paternal, and infant sleep measures.
Figure 3 presents the triadic Pearson correlations between maternal, paternal, and infant sleep measures throughout the different time points, after controlling for feeding methods and sleeping arrangements.
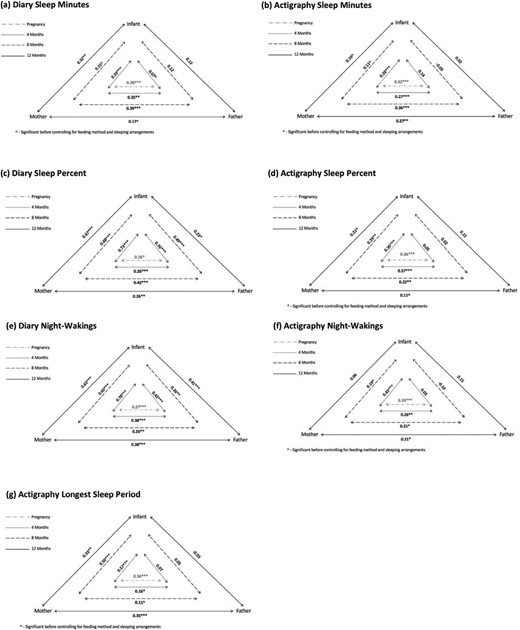
Triadic associations between maternal, paternal, and infant sleep measures (controlling for feeding method and sleeping arrangements). Note. Sleep minutes- true sleep time; Sleep percent -the percentage of nocturnal sleep minutes out of night duration (from sleep onset to morning awakening); Night wakings -number of night-wakings (Actigraph – night-wakings lasting at least 5 min); Longest sleep period -longest continuous sleep episode during the night.
Sleep diaries
Maternal and infant sleep.
Significant concomitant correlations were found between infant and maternal sleep minutes at 4 and 12 months, and between infant and maternal sleep quality measures (number of night waking and sleep percent) at all assessment points.
Paternal and infant sleep.
No significant correlations were found between infant and paternal sleep minutes. Significant correlations were found between paternal and infant number of night waking and sleep percent at all assessment points.
Maternal and paternal sleep.
Significant correlations were found between maternal and paternal sleep at all assessment points for the three sleep measures.
Actigraphy
Maternal and infant sleep.
Significant correlations between infant and maternal actigraphic sleep minutes and infant and maternal number of night waking were found only at 4 months. For sleep percent, there were significant correlations at 4 and 8 months. Maternal and infant longest sleep periods were significantly correlated at all assessment points.
Paternal and infant sleep.
No significant correlations were found between infant and paternal actigraphic sleep measures.
Maternal and paternal sleep.
Significant correlations between maternal and paternal actigraphic sleep measures were found at all assessment points, except for longest sleep period at 8 months and sleep percent at 12 months.
Comparison of the strengths of the correlations between mother-infant sleep versus father-infant sleep
We compared the strengths of the correlations between maternal and infant sleep and paternal and infant sleep (controlling for feeding method and sleeping arrangements), at each time point (see Supplementary Table 8). At 4 months, significant differences were found for all sleep measures (2.70 ≤ z ≤ 5.91; p < .01) except for actigraphic sleep minutes, indicating that the correlations between maternal and infant sleep were stronger than the correlations between paternal and infant sleep. Also at 8 months, the correlations between maternal and infant sleep measures (except for diary and actigraphic sleep minutes) were stronger than the correlations between paternal and infant sleep (2.51 ≤ z ≤ 4.52; p < .05). At 12 months, stronger correlations between maternal and infant sleep than between paternal and infant sleep were found for diary sleep minutes (z = 1.78, p < .01) and night waking (z = 4.85, p < .05) and for actigraphic longest sleep period (z = 3.14, p < .01).
Discussion
The present study expands previous work on the family context of sleep by examining, for the first time, trajectories of both mothers’ and fathers’ objective and self-reported sleep from the third trimester of pregnancy and throughout the first year postpartum. Another novel aspect of this study is the assessment of triadic associations between mothers’, fathers’, and infants’ sleep at different points during the first year of the infant’s life. The analyses were conducted while controlling for feeding methods (breastfeeding vs. formula feeding) and sleeping arrangements (room sharing vs. solitary sleeping), as these variables vary considerably between families and are associated with sleep quality.
Comparison of maternal and paternal sleep
At all assessment points (pregnancy, 4, 8, and 12 months postpartum), mothers demonstrated significantly poorer self-reported sleep quality than fathers, as manifested in lower sleep percent, higher number of night waking, and higher insomnia scores. The effect sizes for these differences were overall in the medium–high range, with somewhat lower effects at 12 months postpartum. Mothers presented also poorer actigraphic sleep quality at all assessment points, except for 12 months, where a significant difference was found only for actigraphic sleep percent. The relatively smaller differences in sleep quality between mothers and fathers at 12 months might result from the increase in infant sleep consolidation over time, as well as from a probable growth in paternal nighttime involvement as the infant grows older.
Although maternal sleep quality was consistently lower than paternal sleep quality, fathers presented shorter sleep duration than mothers. However, the effect sizes for sleep duration (i.e. sleep minutes) were in the small range (Cohen’s d around 0.20) and the differences were less consistent across assessment methods (e.g. at pregnancy, there were differences only in diary-based sleep minutes, whereas, at 8 and 12 months, only the actigraphy measure showed significant differences) than the differences in sleep quality measures. The present findings are consistent with previous studies documenting poorer sleep quality in mothers, compared to fathers, but shorter sleep duration in fathers, compared to mothers, during the end of pregnancy [2, 4] and in the postpartum period [3, 4, 19, 49, 50]. While most previous studies were based on self-reports, included no more than two assessment points, and focused on the first months postpartum, the present study expands these findings by showing consistent differences between mothers and fathers based on both actigraphy and reported measures throughout the first year of life.
We further examined whether maternal and paternal sleep differed as a function of sleeping arrangements and feeding methods. Differences were found for both parents but were more pronounced for mothers. Room sharing and breastfeeding were associated with more maternal sleep disturbances across various objective and reported sleep measures, especially at 8 and 12 months, whereas, in fathers, differences were manifested in a relatively small number of variables. Findings were similar in infants, though mainly in reported sleep measures, and not in actigraphic ones. We also found that breastfed infants were more likely to sleep in the parents’ room than formula-fed infants. Generally, these findings are consistent with previous studies examining the links between sleeping arrangements, feeding methods, and mother-infant sleep [31, 51]. Because of these differences, we controlled for sleeping arrangements and feeding methods in our subsequent analyses.
Changes in parental sleep from pregnancy and throughout the first year postpartum
During the transition from pregnancy to 4 months postpartum, both mothers and fathers showed a significant deterioration in sleep quality manifested in a significant decrease in actigraphic and diary sleep percent and a significant increase in the number of diary night waking. Both parents also presented a reduction in actigraphic longest sleep period and in diary sleep minutes. Generally, the findings are consistent with previous studies demonstrating a deterioration in maternal sleep quality from pregnancy to the postpartum [9, 52, 53] and with the few available studies showing that fathers also experience a decline in sleep quality in the postpartum period [4, 7, 54] although the magnitude of these changes seems to be smaller in fathers [7].
Interestingly, our findings evidenced a significant increase in insomnia symptoms from pregnancy to 4 months postpartum only for fathers. Although mothers had a sharp decline in the quantified measures of sleep quality from pregnancy to the 4-month assessment, this decrease was not accompanied by an increase in their insomnia symptoms, and they even showed a reduction in these symptoms. These contradictory trajectories might be explained by the possibility that mothers prepared themselves emotionally for the expected decline in their sleep quality following the need to care for their infant. If so, this expectation might have led to a better subjective experience of sleep in the postpartum, even though objectively their sleep deteriorated. Possibly, fathers were less likely to psychologically adjust themselves to the expected change in their sleep quality, which might have resulted in a more significant change in their subjective experience of sleep quality, as reflected in an exacerbation of insomnia symptoms.
Mothers and fathers presented somewhat different sleep trajectories during the postpartum period. Whereas mothers showed a linear improvement in diary sleep percent and night waking from 4 to 12 months and no change in these actigraphic measures, fathers presented a small decrease in sleep quality from 4 to 8 months followed by an improvement, as manifested by a quadratic change in diary sleep percent and in actigraphic sleep percent, night waking, and longest sleep period. This quadratic pattern might be related to a relative increase in paternal involvement in nighttime caregiving around 8 months postpartum. Mothers, however, did show a similar quadratic pattern for some other sleep measures and specifically for actigraphic and diary sleep minutes, actigraphic longest sleep period, and the level of insomnia symptoms. These measures showed a small decrease in the duration and quality of sleep from 4 to 8 months, followed by an improvement from 8 to 12 months. In contrast, fathers showed a linear reduction in diary sleep minutes from 4 to 12 months and no change in the level of insomnia symptoms.
In general, for the quantified sleep quality measures (sleep percent, number of night waking, and longest sleep period), both parents showed a deterioration from pregnancy to 4 months, and an improvement from 4 to 12 months, with some of the measures demonstrating a quadratic pattern. The improvement in parental sleep quality from 4 to 12 months postpartum is equivalent to the growth in infant sleep consolidation during this time period. Infants, in the present study, demonstrated an increase in diary and actigraphic sleep percent and longest sleep period and a decrease in the number of actigraphic night waking from 4 to 12 months. These findings are consistent with previous studies in the field [31, 51, 55]
Rates of parental insomnia symptoms
Importantly, although parental sleep quality improved on average during the first year, our findings revealed a high prevalence of insomnia symptoms in both parents at all assessment points and showed that the rate of parents experiencing at least subthreshold insomnia (as based on the clinical cutoffs of the ISI) remained quite stable from pregnancy and throughout the other assessments. For mothers, the prevalence of at least subthreshold symptoms was about 70% with some decline at 12 months (60%), and, for fathers, the rate was about 50%. Overall, the rates in mothers are higher than the rates in fathers and are quite similar to previous reports of insomnia symptoms in pregnancy and in the early postpartum [8, 10, 13, 14, 16–18] and with a few studies that examined these rates in mothers of older infants and toddlers [15, 56, 57]. Only a few studies have reported on the prevalence of sleep disturbances in fathers during the perinatal period [2, 54] and, to our knowledge, the present study was the first to examine the rates of insomnia symptoms deep into the postpartum period and also in fathers. Our findings suggest that the rates of insomnia symptoms in parents of infants throughout the first year are significantly higher than in the general population. Although the rate of insomnia symptoms varies extensively across studies, partly because of differences in assessment procedures and variations in conceptualizing insomnia, most population-based studies report that about 33% of adults have at least one major insomnia symptom (e.g. difficulty initiating or maintaining sleep) [58, 59]. Even in comparison to this definition, the rates in our sample are considerably higher. Importantly, in the general population, insomnia is about 1.4 times more prevalent in women versus men [58]. A similar ratio was found in the present sample.
Links between both parents’ sleep and infant sleep
We found significant associations between the sleep of mothers and infants, especially for diary-based measures. This is in line with previous research on this topic [11, 26, 27, 60, 61]. Much less is known about the way that paternal sleep is linked to both infant and maternal sleep, though our findings support a few earlier studies conducted in the first months postpartum that found significant associations between reported paternal sleep and infant sleep, but also demonstrated infant sleep to be more strongly related with maternal sleep than with paternal sleep [26, 49]. The present study adds to this literature by demonstrating that these differences in the strengths of the links between infant-mother sleep versus infant-father sleep persist also at later points during the first year postpartum. As mothers mostly filled in the sleep diaries, shared-method variance might explain to a certain degree why the links between infant sleep and parental sleep were stronger for mothers than for fathers. However, this cannot explain why there were significant correlations between maternal and infant actigraphic sleep, whereas the correlations between fathers’ and infants’ sleep based on actigraphy were weak and mostly nonsignificant. As maternal sleep was more disturbed and more strongly related to infant sleep in the first year, compared to paternal sleep, it seems that mothers remain primarily responsible for nocturnal infant care not only due to breastfeeding, but also because of other reasons, such as traditional perceptions and norms of women being the primary caregiver, despite an overall increase in the involvement of fathers in infant caregiving during the last decades. It could also be that mothers’ role in nighttime feeding in the first months postpartum leads them to stay more responsive to their infant’s needs during the night and perpetuates maternal involvement in other caregiving duties (e.g. soothing the infant to sleep, changing, and bottle feeding) that in reality could be managed by fathers [3, 19, 62, 63]. Mothers might also be more vigilant and present heightened physiological and emotional sensitivity to infant cues during the night [64, 65], increasing the likelihood that they would hear the infant waking up even if these night waking do not necessitate parental involvement. It could be that fathers awake mainly when the infant’s awakenings are prolonged and require intervention.
Our findings show consistent significant associations between the sleep of mothers and fathers from pregnancy and throughout the first year. The correlations were all in the mild to moderate range (0.14–0.42), with most correlations being around.30. Interestingly, these correlations are quite consistent across variables (e.g. sleep minutes, number of night waking, and sleep percent) and across methods (actigraphy versus sleep diaries). To the best of our knowledge, this was the first longitudinal study to examine the associations between maternal and paternal sleep in the postpartum period. Nevertheless, our findings are in line with a previous study that focused on families of school-aged children and found that mothers’ sleep was predicted by both their partners’ and child’s sleep, whereas fathers’ sleep was only predicted by their partners’ sleep [28], and with former studies conducted on partners (most without children) demonstrating interdependence between couple’s sleep [66–68]. The infant’s sleep-wake patterns can explain some of the concordances in parental sleep when both parents are awakened by the infant, but, at the same time, can also reduce the concordance when only one parent (usually the mother) wakes up and cares for the infant at night. Whereas the strength of the links between the sleep of infants and parents seems to decrease across infant development possibly because of the increase in infant nocturnal self-soothing capacities [11], the stability of the links between the sleep of both parents suggests that other factors, besides awakenings caused by the infant, are probably responsible for these links. These may include factors that have been proposed before as influencing the links between partners' sleep, including health problems, relationship quality, attachment security, and emotional distress [69].
Study limitations
Several limitations of this study should be noted. First, generalizability of the results is hindered by the fact that our sample was relatively homogeneous, as it included mostly first-born, typically developing infants, with most families representing the middle-upper socioeconomic status in Israel. In addition, the only assessment point during pregnancy was the last trimester. Additional research is needed to examine the trajectories of parental sleep throughout pregnancy. Furthermore, a substantial number of families dropped out of the study, and some families could not complete the last assessment because of the COVID-19 pandemic. Therefore, full analyses, including the 12-month assessment were available only for 66% of the families. Finally, we did not assess factors that may influence the links between parental and infant sleep, such as physiological sleep disorders, attachment security, and parental emotional distress.
Conclusions and clinical implications
Sleep has traditionally been examined separately in infants and parents, and there has been limited recognition of how sleep intertwines between family members. The present findings provide support for the importance of considering the family context of sleep, by demonstrating similarities and differences in the changes sleep undergoes in mothers and fathers from pregnancy and throughout the first year postpartum, and by showing how sleep is interrelated between infants, mothers, and fathers. We used both objective and self-reported sleep measures to encompass the multi-faceted phenomena of sleep-wake patterns and found that maternal sleep quality, in comparison to paternal sleep, is more strongly affected following the arrival of the infant and more strongly associated with infant sleep, but that fathers are significantly affected, as well. Future studies should explore the implications of consistent familial sleep disturbances on family functioning. Additional research is also needed to understand the implications of sleep concordance between mothers and fathers for couple and family functioning. Another important direction for future work is the effort to increase awareness of the importance of considering the sleep of both parents in clinical interventions for infant insomnia. Pediatric sleep interventions tend to focus on modifying parental behaviors in the infant’s sleep context to promote infant sleep consolidation. Our findings suggest that as part of these interventions, not only parental behavior, but mothers’ and fathers’ sleep, as well, should be carefully considered as a factor that may influence the capacity of parents to cope with their infant’s sleep.
Funding
This study was supported by a grant from the Israel Science Foundation (Grant number 345/15). This was not an industry-supported study.
Acknowledgments
The authors wish to thank all participating families and all the students that helped with data collection.
Disclosure Statement
None declared.
Data Availability
The data underlying this article will be shared on reasonable request to the corresponding author.


Comments