


Abstract
The circadian system orchestrates sleep timing and structure and is altered with increasing age. Sleep propensity, and particularly REM sleep is under strong circadian control and has been suggested to play an important role in brain plasticity. In this exploratory study, we assessed whether surface-based brain morphometry indices are associated with circadian sleep regulation and whether this link changes with age. Twenty-nine healthy older (55–82 years; 16 men) and 28 young participants (20–32 years; 13 men) underwent both structural magnetic resonance imaging and a 40-h multiple nap protocol to extract sleep parameters over day and night time. Cortical thickness and gyrification indices were estimated from T1-weighted images acquired during a classical waking day. We observed that REM sleep was significantly modulated over the 24-h cycle in both age groups, with older adults exhibiting an overall reduction in REM sleep modulation compared to young individuals. Interestingly, when taking into account the observed overall age-related reduction in REM sleep throughout the circadian cycle, higher day–night differences in REM sleep were associated with increased cortical gyrification in the right inferior frontal and paracentral regions in older adults. Our results suggest that a more distinctive allocation of REM sleep over the 24-h cycle is associated with regional cortical gyrification in aging, and thereby point towards a protective role of circadian REM sleep regulation for age-related changes in brain organization.

Recent studies suggest an association between sleep and brain aging. Altered circadian sleep propensity has been suggested to contribute to typically observed age-related changes in sleep. Here we explored the association between circadian sleep modulation and MRI-derived indices of cortical thickness and gyrification in healthy young and older participants. Our findings suggest that displaying a high circadian modulation of REM sleep is associated with preserved cortical gyrification in healthy older adults.
Introduction
The circadian clock represents an internal cell-based time-keeping system that generates nearly 24-h rhythms in a wide array of physiological and behavioral rhythms including body temperature, hormone release, cognitive functioning, and the sleep–wake cycle [1]. With respect to the latter, the central circadian clock, located in the suprachiasmatic nuclei (SCN), has been shown to provide temporal organization to the sleep–wake cycle through adaptive arousal mechanisms that oppose the wake-dependent rise of homeostatic sleep pressure levels [2].
With increasing age, the sleep–wake cycle undergoes profound changes. Classically, healthy older people go to bed and wake up earlier [3–5], sleep less and show increased sleep fragmentation [6, 7]. Notably, an overall age-related reduction in sleep need and a concomitant amplitude reduction of circadian (sleep)–wake propensity have been suggested to underlie typically observed age-related changes in sleep [8]. While a circadian modulation of sleep has been observed in both young and older individuals, its amplitude was suggested to be reduced in older adults [9], concomitant with an overall age-related reduction of sleep duration and sleep consolidation at all circadian phases [10]. Regarding sleep structure, aging is associated with a steep reduction in slow-wave sleep, and a comparatively smaller reduction in rapid eye movement (REM) sleep [6, 11], along with an increased occurrence of night-time awakenings and arousals in humans [12]. Altered sleep quality and duration have further been associated with gray matter atrophy and reduced cortical thickness during aging [13, 14]. In addition, increased fragmentation of circadian activity rhythms have been related to medial temporal lobe atrophy [15] in older individuals. However, evidence remains scarce regarding the link between circadian sleep regulation and age-related changes in brain structure.
Besides its role in sleep timing, the circadian system also regulates sleep structural aspects [16]. The inability to sleep during the so-called “wake maintenance zone” is indicative of the strength of the circadian wake-promoting signal, contributing to wake state stabilization at the end of the classical waking day [17]. REM sleep shows a clear circadian modulation peaking in the late biological night to early morning hours, indicative of a circadian sleep-facilitating window [16]. Compared to the other sleep stages, REM sleep is under the strongest circadian control [16, 18–21]. Previous studies reported that older adults exhibit higher sleep propensity during the wake maintenance zone and a reduced circadian modulation of REM sleep compared to young individuals [7–9, 22].
In this exploratory analysis, we sought to determine the impact of age on circadian sleep regulation and its association with cortical gray matter integrity by combining a 40-h multiple nap protocol under electrophysiological monitoring and structural brain imaging in a group of healthy young and older individuals We hypothesized that, similarly to previously reported associations between night-time sleep characteristics and brain structural indices [13, 23, 24], displaying a robust circadian sleep regulation in older adults stands as a protective marker for brain structural integrity. The modulation of both overall sleep efficiency as well as REM sleep over the circadian cycle were extracted as indices of circadian sleep–wake regulation. It was previously reported that older individuals exhibited higher sleep propensity during the wake maintenance zone and a reduced circadian modulation of REM sleep [9, 22]. To assess brain macro-structure, cortical thickness and gyrification were used as two complementary measures of cortical organization [25, 26], sensitive to the aging process [25–30].
Methods
Participants
Twenty-eight young (20–32 years; 13 men) and 29 older individuals (55–82 years; 16 men) were included in the analyses. They were recruited at two different research centers (28 young participants and 11 older participants at the Centre for Chronobiology of the University of Basel; 18 older participants at the GIGA-CRC in Vivo Imaging of the University of Liège) with identical exclusion criteria: current or past neurological, psychiatric, and sleep disorders, smoking, medication [except oral contraceptives and participants with stable treatment (for > 6 months) for hypertension and/or hypothyroidism] or drug consumption, shift work and trans-meridian travel 3 months before study participation. A night of polysomnography was carried out to screen for sleep disorders (Apnea–Hypopnea Index [AHI] < 15/h, Periodic Limb Movement [PLMS] index < 15/h), and to habituate the participants to sleep in laboratory conditions with electrodes before study participation. Young women who did not use contraceptives were tested during the luteal phase of their menstrual cycle. None of the participants indicated moderate or severe depression (Beck Depression Inventory [BDI-II] < 19) [31] or severe anxiety (Beck Anxiety Inventory [BAI] < 30) [32]. Clinical symptoms of cognitive impairment were assessed by the Mini-Mental State Examination [MMSE score > 26] [33] and the Mattis Dementia Rating scale [MDR score > 130] [34] in the older group. The local ethics committee of the respective study centers (Ethikkommission Beider Basel, EKBB, Switzerland; Ethics committee of the University Hospital and the Faculty of Psychology, Logopedics, and Educational Sciences at the University of Liège, Belgium) approved the study, and procedures were conformed to the standards of the Declaration of Helsinki. All participants provided written informed consent before participation and received financial compensation for study participation.
Experimental protocol
The experimental protocol is depicted in Figure 1. Data on nap sleep obtained in young adults have been partly published [35–39].
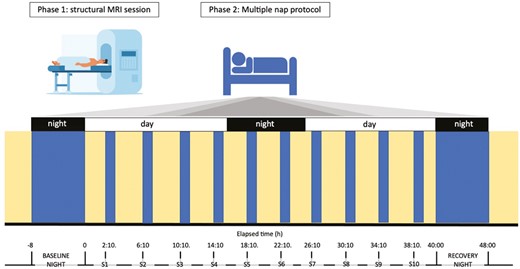
Schematic representation of the experimental protocol. Participants underwent a structural MRI session, where T1-weighted images were obtained (Phase 1). On a separate visit, they underwent a 40-h multiple nap protocol (Phase 2). The in-lab protocol started with an 8-h baseline night, monitored by polysomnography. Thereafter, participants underwent a 40-h multiple nap constant routine (CR) protocol, encompassing 10 short sleep-wake cycles, each consisting of 160 min of wakefulness (yellow) alternating with 80 min of sleep opportunities (blue). The protocol was followed by 8 h of sleep opportunity (recovery night). Light levels (<5 lux during wakefulness and 0 lux during sleep), temperature (~19°C), caloric intake and body posture (semi-recumbent position during scheduled wakefulness and recumbent during sleep opportunities) were controlled. The timing of nap sessions (S1–S10) was aligned with the individual’s scheduled wake-up time from the baseline night (elapsed time expressed in hours).
Before entering the laboratory, participants were asked to abstain from alcohol and caffeine and to keep a fixed and individually adapted sleep-wake schedule (8 h of sleep opportunity with a maximal deviation of 30 min) for 7 days to ensure sufficient sleep and stable circadian entrainment to the selected regime. Sleep schedules (i.e. sleep and wake-up times from baseline night and subsequent nap timing) were individually adapted to the participants’ preferred sleep–wake times, centered on an 8-h sleep opportunity. The alignment of protocol timing to individually scheduled wake-up times, rather than absolute clock time, has the advantage to allow for inter-subject comparisons across nap sessions, considering both time since awake and “circadian time”. Compliance with the schedule during the week preceding laboratory entrance was verified by actigraphic recordings. After a baseline night, participants underwent a 40-h multiple nap protocol encompassing 10 short sleep-wake cycles, of 80 min of sleep opportunity (i.e. a nap) alternating with 160 min of wakefulness. The first cycle started 130 min after the scheduled wake-up time from the baseline night. The duration of wakefulness in the last cycle was restricted to 40 min such that the recovery night started at habitual sleep time. Such an in-lab protocol has already been used to assess sleep propensity levels at different circadian phases (e.g. [40]), and the impact of age on this modulation [9]. The experiment was conducted under controlled conditions according to light input (<8 lux during scheduled wakefulness; <1 lux during scheduled sleep opportunities), isocaloric food intake (standardized meals every 4 h), and body posture (semi-recumbent position during scheduled wakefulness and recumbent during naps). Participants were not allowed to stand up, except for regularly scheduled bathroom visits, and they did not have any indications of time of day. Social interaction was restricted to communications with study helpers.
EEG data acquisition and analysis
During the multiple nap protocol, sleep was measured using 7 electroencephalographic (EEG) channels (Fz, C3, Cz, C4, Pz, Oz, O2), as well as two bipolar electrooculograms, and two bipolar submental electromyograms. Signals were recorded using V-Amp digital sleep recorders (Brain Products GmbH, Germany) with sintered MRI-compatible Ag/AgCl ring electrodes with a 15 kΩ resistor (EasyCap GmbH, Germany), and N7000 amplifiers (EMBLA, Natus Medical Incorporated, Planegg, Germany) with classical Ag/AgCl ring electrodes in Basel and Liège, respectively. The sampling rate was set at 500 Hz and signals were filtered online by applying a notch filter (50 Hz).
Out of the 550 sleep episodes (10 for each participant: sessions S1–S10), 4 recordings were not available (3 in the young and 1 in the older group) due to technical issues. Sleep stages were automatically scored in 30-s epochs by using the ASEEGA sleep scoring algorithm (ASEEGA, PHYSIP, Paris, France, see also Supplementary material) according to the American Academy of Sleep Medicine criteria (AASM [41]). The latter has been previously compared against visual scoring for night-time sleep in young [42, 43] and older individuals [44], as well as in the context of sleep disorders [45]. Within the specific context of nap sleep, concordance between automatic, and consensual visual scoring between the two experts was 85.5% (Conger’s kappa coefficient = 0.79, see Supplementary material for further information), and was thus comparable to the one reported for the inter-expert agreement for night sleep. During each nap opportunity, sleep efficiency (SE) and REM sleep percentage over total sleep time (REM%) were extracted (see Figure S1 for SE and REM% across nap sessions for each individual). Average time courses of other sleep variables [sleep latency (SL), sleep stage 1 (N1%), sleep stage 2 (N2%), and sleep stage 3 (N3%), non-REM% (N1, N2, N3), and W%], are also reported.
MRI acquisition and processing
MRI scans were obtained using a 3 T scanner with a 12-channel head coil in Basel (MAGNETOM Verio, Siemens Healthcare) and with a 64-channel head coil (MAGNETOM Prisma, Siemens) in Liège. In Basel, 3D MDEFT (modified driven equilibrium Fourier transform) T1-weighted sequences were acquired with the following parameters: repetition time (TR) = 2000 ms, echo time (TE) = 3.37 ms, flip angle = 8°, field of view (FoV) = 25.6 cm, matrix size = 256 × 256 × 176, voxel size = 1 × 1 × 1 mm3. In Liège, 3D MRPAGE (magnetization-prepared rapid gradient echo) T1-weighted images were acquired with the following parameters: TR = 1900 ms, TE = 2.19 ms, flip angle = 9°, FoV = 25.6 cm, matrix size = 256 × 240 × 224, voxel size = 1 × 1 × 1 mm3.
Surface-based morphometry (SBM) analyses were conducted using the Computational Anatomy Toolbox (CAT12.8.1, r1980 [46]) (http://dbm.neuro.uni-jena.de/cat/) that provides a fully automated method to estimate cortical thickness and the central surface of hemispheres based on the projection-based thickness (PBT) method [47]. All images underwent automated segmentation of gray matter, white matter, and cerebrospinal fluid, affine registration to the Montreal neurological institute (MNI) template space, and subsequently, a nonlinear deformation. In CAT12, a fully automated method allows cortical thickness to be measured and the central surface to be reconstructed in a single step. The program uses tissue segmentation to estimate the white matter distance and projects the local maxima (which is equal to the cortical thickness) to other gray matter voxels using a neighbor relationship provided by the white matter distance. This projection-based thickness method also includes partial volume correction, sulcal blurring, and sulcal asymmetries without sulcus reconstruction. The generated images were smoothed using a Gaussian kernel with a full-width-half-maximum (FWHM) of 20 mm for cortical thickness and 25 mm for gyrification index, respectively. The gyrification index was measured as a ratio of the external brain surface with the outer surface excluding the sulci. Gyrification index calculation was based on absolute mean curvature [48]. Square root-transformed sulcus depth was based on the Euclidean distance between the central surface and its convex hull. Transformation with a square root function was used to render the data more normally distributed. Mean values of cortical thickness and gyrification index were extracted for 70 cortical areas (35 per hemisphere) defined by the Desikan Killiany atlas [49].
Statistical analysis
Statistical analyses were performed using the python package Pingouin (v0.5.1 [50]) and statsmodel (v0.13.2 [51]) implemented in python v3.7. Mixed model of variances were first used to compare sleep parameters across naps (within-subjects factor) and between groups (between-subjects factor), including subject as a random factor. Separate models were performed for each sleep parameter (N1%, N2%, N3%, non-REM%, REM%, W%, SE, and SL). False Discovery Rate (FDR)-corrected p-values accounting for the number of computed models are reported in Supplementary material (8 models; see Table S1). If the interaction term between age group and nap session reached significance, post hoc pairwise t-tests were performed to compare sleep parameters between groups for each nap opportunity. p-values were corrected for multiple comparisons, using the Benjamini/Hochberg FDR correction (alpha set at 0.05).
In order to summarize the individual’s daily modulation of SE and REM% over day and night, we further computed difference scores between naps scheduled during night-time and naps scheduled during the evening surrounding the so-called wake maintenance zone. These parameters (SENight–Day and REM%Night–Day) were compared between groups using an ordinary least squares model (OLS), including sex, average SE, and REM% over all nap opportunities as covariates to account for potential differences in overall sleep and REM sleep generation throughout the circadian cycle. Three participants did not sleep during both naps surrounding the wake maintenance zone (2 young and 1 older adult) and were thus excluded from the group comparison of REM%Night–Day and its association with brain metrics.
To test the association between sleep parameters and gray matter indices (cortical thickness and gyrification), analyses of variance were performed over 70 cortical regions by using the Region of Interest Analysis module implemented in CAT12. Sleep parameters of interest (SENight–Day and REM%Night–Day) were entered as continuous predictors. Group (young/older) and scanning environment (Basel vs Liège) were added as categorical factors, and sex, mean SE, and REM% over all naps were added as covariates in the statistical model. Separate models were computed for cortical thickness and gyrification, respectively. F-statistics were first computed to test for any linear effects of the respective sleep parameters of interest (SENight–Day or REM%Night–Day). FDR correction was applied to account for the multiple cortical regions tested. When the F-statistics reached significance for a given region of interest, the mean cortical metric of this region estimated using CAT12, was extracted. Generalized least square models were performed to test interaction effects between the sleep parameter of interest (SENight–Day or REM%Night–Day) and the age group, including sex, average SE, and REM% over all nap opportunities as well as the scanning environment as covariates. A distinct model was calculated for each cortical region. FDR-corrected p-values accounting for the number of computed models (2) are reported.
Finally, we conducted an exploratory follow-up analysis by splitting the group of older participants in two groups according to the sleep parameter of interest (>75th percentile and < 25th percentile). Generalized least square models were used to compare cortical metrics of these groups with those obtained in young individuals, with sex included as a covariate. Separate models were computed for each cortical region. p-values were corrected for multiple comparison (FDR correction) according for the number of computed models (2).
Results
Nap sleep parameters
Sleep measures derived from nap opportunities over the protocol are summarized in Table 1. Overall, older participants showed significantly lower sleep efficiency [SE: (F(1, 49) = 5.045, p = .029, ηp2 = .093], reduced REM sleep [REM%: (F(1, 20) = 13.283 p = .002, ηp2 = .399], but increased N2 sleep and wakefulness [N2%: (F(1, 20) = 12.066, p = .002, ηp2 = .376]; W%: [F(1, 49) = 6.09, p = .017, ηp2 = .111], compared to young adults during the nap protocol. A main effect of nap session was observed for most of the sleep parameters, including REM% [F(9, 180) = 4.804, p < .001, ηp2 = .194] and SE [F(9, 441) = 43.215, p < .001, ηp2 = .424, Figure 2A, see Supplementary Table S1 for uncorrected and FDR-corrected p-values].
Sleep timing for the baseline night and sleep stage variables averaged across naps, according to age group
| Young group | Older group | P-value | |
|---|---|---|---|
| Mean ± std | Mean ± std | ||
| Baseline night | |||
| Scheduled bedtime (h:mm) | 23:56 ± 54 | 23:20 ± 61 | .033 |
| Scheduled wake-up time (h:mm) | 7:56 ± 55 | 7:20 ± 62 | .033 |
| Naps opportunities | |||
| SE (TST as a % of time in bed) | 61% ± 32% | 52% ± 28% | .029 |
| N1 (%TST) | 18% ± 6% | 16% ± 6% | ns |
| N2 (%TST) | 45% ± 7% | 61% ± 6% | .002 |
| N3 (%TST) | 19% ± 1% | 15% ± 5% | ns |
| REM (%TST) | 18% ± 10% | 7% ± 7% | .002 |
| W | 37% ± 32% | 47% ± 28% | .017 |
| SL (min) | 18.28 ± 16.64 | 19.18 ± 15.56 | ns |
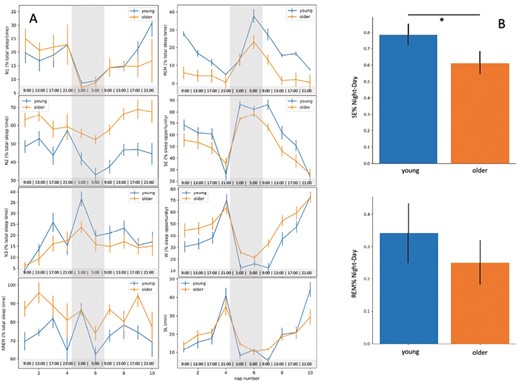
(A) From the upper left to bottom right panel, time course of N1, N2, N3, NREM, REM (% of total sleep time), sleep efficiency, wake (SE, W, expressed as % of sleep opportunity) and sleep latency (SL) across the nap opportunities over the 40-h protocol (S1–S10), according to age group. The gray part represents the biological night for each participant. The hours in the bottom line represent the schedule of a participant going to bed at 23:00 and waking up at 7:00. (B) Day–night difference in SE and REM% for the young and the aged group.
We further observed a significant nap session*group interaction for SE (F(9, 441) = 1.985, p = .039, ηp2 = .039], with young participants sleeping significantly more during naps 5 (night-time, 18 h after scheduled wake-up time) and 7 (early morning, 26 h after scheduled wake-up time) (pFDRcorr = .013 and pFDRcorr = .014, Figure 2A), compared to the older group; however, this interaction was no more significant after FDR correction (see Supplementary Table S1).
In the same vain, older individuals exhibited lower night-day modulation of SE compared to young adults [SENight–Day: F(3, 51) = 3.060, p = .005, R-squared = 0.153, Figure 2B]. No signification nap session*group was observed for REM% [F(9, 180) = 1.985, p = .442, ηp2 = .049] neither was the main effect of group significant for REM%Night–Day [F(3, 48) = 1.630, p = .742, R-squared = 0.092, Figure 2].
Association between age, sleep parameters and cortical thickness
As expected, cortical thickness was significantly reduced in a large number of cortical regions in older participants, compared to young adults (pFDRcorr < .05, Supplementary Figure S3 and Table S1). No significant associations were observed with any of the sleep parameters (SENight–Day, REM%Night–Day; pFDRcorr > .05).
Association between age, sleep parameters and cortical gyrification
Older participants exhibited significantly lower cortical gyrification in regions covering the bilateral precentral, postcentral, paracentral, caudal middle frontal, and supramarginal gyrus, the right pars opercularis, the right superior parietal and frontal gyrus and the right rostral middle frontal gyrus, as well as the left cuneus (pFDRcorr < .05, Figure 3, Table 2). In addition, a higher cortical gyrification was observed in the right medial-orbitofrontal cortex and the cingulate gyrus in older individuals compared to young participants (pFDRcorr < .05, Figure 3, Table 2). REM%Night–Day was significantly associated with cortical gyrification in the left paracentral (F = 12.24, Z = 3.80, pFDRcorr = .005) and in the right inferior frontal region (pars opecularis, F = 7.81, Z = 3.00, pFDRcorr = .049, Figure 4A). Notably, a significant interaction was observed between age group and REM%Night–Day, with REM%Night–Day being positively related to cortical gyrification in the older group only [left paracentral lobule: F(8,43) = 6.34, pFDRcorr = .002, R-squared = 0.541; right pars opercularis: F(8,43) = 3.962, pFDRcorr = .010, R-squared = 0.424, Figure 4B]. Finally, in these regions, the gyrification index was negatively associated with cortical thickness in both groups [left paracentral lobule: F(5, 46) = 3.268, p = .013, R-squared = 0.263; right pars opercularis of the inferior frontal gyrus: F(5, 46) = 4.951, p = .005, R-squared = 0.350]. No significant associations were observed for SENight–Day (p > .05).
List of cortical regions displaying statistically significant differences in cortical gyrification between the young and older group
| P-value | Contrast | T-value | Ze-value | aparc_DK40 |
|---|---|---|---|---|
| Left hemisphere (p < .05, FDR-corrected) | ||||
| .000004 | Y > 0 | 6.458578 | 5.314103 | Postcentral |
| .005123 | Y > 0 | 3.734226 | 3.437752 | Paracentral |
| .014166 | Y > 0 | 3.025151 | 2.853165 | Caudal Middle Frontal |
| .017239 | Y > 0 | 2.918640 | 2.761925 | Cuneus |
| .019473 | Y > 0 | 2.819521 | 2.676234 | Supramarginal |
| .019473 | Y > 0 | 2.812977 | 2.670550 | Precentral |
| Right hemisphere (p < .05, FDR-corrected) | ||||
| .000494 | Y > 0 | 4.734647 | 4.193497 | Precentral |
| .000859 | Y > 0 | 4.428539 | 3.970826 | Postcentral |
| .005123 | Y > 0 | 3.668325 | 3.385122 | Superior Parietal |
| .005492 | Y > 0 | 3.581627 | 3.315348 | Supramarginal |
| .007493 | Y > 0 | 3.419364 | 3.183130 | Superior Frontal |
| .010455 | Y > 0 | 3.253071 | 3.045439 | Pars Opercularis |
| .014166 | Y > 0 | 3.093408 | 2.911174 | Caudal Middle Frontal |
| .014166 | Y > 0 | 3.026828 | 2.854595 | Paracentral |
| .046924 | Y > 0 | 2.432726 | 2.334841 | Rostral Middle Frontal |
| .007879 | O > Y | −4.064465 | −3.696177 | Medial Orbitofrontal |
| .037059 | O > Y | −3.296502 | −3.081612 | Isthmus Cingulate |
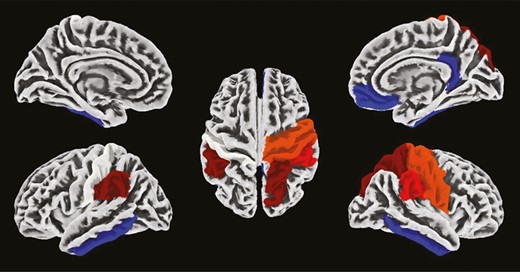
Difference in cortical gyrification between young and older individuals. Hot colors represent brain regions showing higher gyrification in the young group than in the older group. Cold colors represent brain regions showing lower gyrification in the young group than in the older group. Cortical parcellation was obtained with the Desikan Kiliany atlas, and results are overlaid on an MNI template.
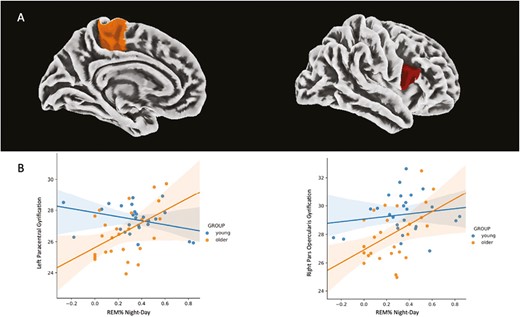
(A) Association between REM%Night–Day and cortical gyrification. Cortical parcellation was obtained with the Desikan Kiliany atlas and results are overlayed on an MNI template. (B) Linear regression lines and 95% confidence intervals of the association between REM%Night–Day and cortical gyrification according to the age group (left paracentral lobule: pFDRcorr = .002, R-squared = 0.541; right pars opercularis: pFDRcorr = .010, R-squared = 0.424).
As a follow-up analysis, we further compared the group of older individuals, split with respect to REM%Night–Day (>75th percentile and < 25th percentile), to the young group. No significant difference in cortical gyrification between young and older adults with high REM%Night–Day (>75th percentile) was observed (p > .05). However, older adults with low REM%Night–Day (<25th percentile) presented significantly reduced cortical gyrification compared to the young and the high REM%Night–Day (>75th percentile) older groups in the left paracentral lobule [F(3,36) = 2.818, pFDRcorr = .016 for older < 25th percentile vs young, pFDRcorr = .016 for older < 25th percentile vs older > 75th percentile, R-squared = 0.190; Figure 5] and the right inferior frontal region [pars opercularis, F(3,36) = 4.321, pFDRcorr = .016 for older < 25th percentile vs young, pFDRcorr = .012 for older < 25th percentile vs older > 75th percentile, R-squared = 0.265; Figure 5].
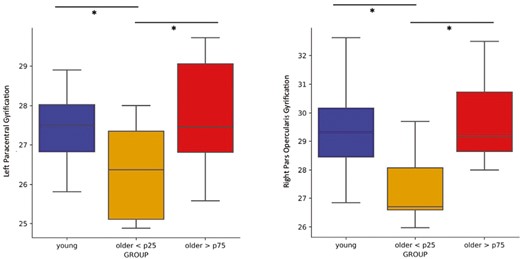
Comparison of cortical gyrification of the left paracentral (on the left) and right pars opercularis (on the right) regions between young individuals and older adults with high (>75th percentile) and low (<25th percentile) REM sleep modulation (REM%Night–Day), respectively. The young and the older > 75th percentile groups exhibited significantly higher gyrification in both areas compared to the older < 25th percentile group. No statistical difference between the young and the older > 75th percentile groups was observed.
Discussion
The circadian system regulates the timing and consolidation of the sleep–wake cycle through adaptive arousal mechanisms that oppose the wake-dependent rise of homeostatic sleep pressure levels [2], thereby contributing to consolidating sleep and wakefulness periods over the 24-h cycle. Within this context and considering the increasing literature indicating an association between sleep and brain aging [13], we aimed at assessing whether age-related changes in circadian sleep regulation are associated with age-related changes in brain macro-structural integrity. We observed that reduced circadian REM sleep modulation was related to reduced cortical gyrification of the paracentral and the inferior frontal region in older individuals.
Our findings suggest that displaying a high circadian modulation of REM sleep is associated with preserved cortical gyrification in healthy older adults.
The current exploratory study focused on two macro-structural aspects of cortical organization: cortical thickness and gyrification. Both indices appear sensitive to the aging process [30, 52–54] and reflect complementary estimates of neuronal organization [55, 56]. Cortical thickness has been suggested to reflect neuronal density in the cortical columnar organization [57] while cortical gyrification has been linked to neo-cortical folding, a milestone of mammalian brain evolution that has been associated with brain size, complexity and associated cognitive function [28, 58–60]. In accordance with previous literature reports [52], we observed that, compared to young adults, older individuals exhibited lower cortical thickness over a widespread set of cortical brain regions. Furthermore, age has been linked to changes in regional folding patterns (e.g. [25, 26, 29]), and to a global decrease in cortical gyrification [25, 26, 29, 30, 53]. In a study including > 4000 individuals aged between 46 and 98 years, Lamballais [30] reported that increasing age is related to lower gyrification in parietal, frontal, temporal and occipital regions, and higher gyrification in the medial prefrontal cortex [30], a pattern comparable to the one observed in our study. Region-specific age-related modulation of cortical gyrification has been suggested to reflect differences in the trajectories of gray and white matter atrophy. Gray matter atrophy is characterized by both a reduction of cortical thickness and cortical surface area leading to more shallow sulci and thus reduced cortical gyrification. On the other hand, when the rate of white matter atrophy starts to exceed the rate of gray matter atrophy, increased cortical gyrification is observed [30]. The age-gyrification association has been shown to deviate in its shape in the medial prefrontal gyrus compared to other regions, thereby suggesting a global and local dependence of gyrification on age [53].
In our study, we corroborated an overall age-related reduction of sleep and REM sleep modulation over the circadian cycle [9]. The daily modulation of REM sleep (REM%Night–Day) may have special relevance, not only over (1) a general reduction in sleep propensity (sleep efficiency: SE) but also over (2) a general reduction of 24-h modulation of sleep propensity (SENight–Day) and over (3) a general reduction of REM sleep (REM%) in aging. Our main sleep variables of interest, SENight–Day and REM%Night–Day, may provide complementary information about circadian sleep regulation. Indeed, sleep propensity and REM sleep have been shown under circadian modulation [16]. REM sleep reveals a remarkably narrow peak [16], with a steep increase close to habitual wake-up time under entrained conditions, as similarly observed in our study. The circadian modulation of wake propensity (i.e. the mirror of SE) does not appear however to steeply rise at classical wake-up time (e.g. [16]), but gradually becomes stronger with maximal wake promotion (or minimal sleep propensity) during the end of the classical waking day, a time window also defined as wake maintenance zone. In the context of circadian sleep regulation, SENight–Day may therefore represent an indicator of arousal regulation at the end of the classical waking day, whereas REM%Night–Day may reflect arousal regulation at the end of the classical sleep period. While the underlying neuronal substate of circadian REM sleep modulation remains to be determined, the SCN has been shown to promote REM sleep at specific times of the day [16, 61]. In addition, the circadian REM sleep modulation has been suggested to involve wake-promoting regions receiving indirect inputs from the SCN including the lateral hypothalamus and the locus coeruleus [61, 62].
Finally, our results suggest a rather circumscribed association between regional cortical gyrification in the paracentral lobule and the pars opercularis of the inferior frontal region and REM sleep modulation in older individuals. While the functional relevance of altered REM regulation over the circadian cycle in aging remains to be assessed, REM sleep during classical night-time sleep has been suggested to play a role in brain plasticity [60, 63] and shown to be among the strongest sleep-related predictors of cognitive decline [64–67] and performance accuracy over the lifespan [11, 68]. The activation of the pars opercularis has been linked to higher-order cognitive processes, including motor inhibition [69], which has been observed to be age-sensitive [70]. In the same vein, the paracentral lobule has been shown to be functionally connected to frontal and parietal regions into a parietal-(pre)motor system, and more specifically into a somatosensory and (pre)motor cortex subsystem implicated in motor functioning which is affected during aging [71]. In addition, increased metabolism and reduced cortical thickness of the paracentral lobule have previously been associated with REM sleep behavior disorder [72, 73]. A global gyrification reduction has been reported in the pars opercularis of the inferior frontal gyrus and in the paracentral lobule during middle and late adulthood [30], and this reduction was similarly observed in our sample. The follow-up analysis revealed that age-dependent reduction in gyrification was no longer significant when comparing the young participants and the older individuals with the highest REM sleep modulation, suggesting therefore that a more distinct allocation of REM sleep over the circadian cycle may reflect a marker of a preserved cortical organization in older individuals.
Limitations and Perspectives
The present exploratory study comes with some limitations. First, while the multiple nap protocol appears suitable for multi-center comparison due to the controlled laboratory conditions and the use of the same algorithm for sleep stage scoring, processing MRI images coming from different scanning environments may be critical. However, this factor was accounted for in the statistical design and classically reported age-related changes in gyrification and cortical thickness could be reproduced. Secondly, considering age-related differences in circadian phase and phase angle of entrainment, future studies would benefit from aligning the data with respect to the circadian phase using, for example, dim light melatonin onset (DLMO) as a reference marker. Then, recent reports have critically pointed out the challenge of replicating associations between inter-individual differences in brain structure or function and complex, mainly cognitive or mental health phenotypes (e.g. [74]), an argumentation that can also, at least partially, be generalized to the sleep domain [75]. However, the in-depth characterization of our participants with respect to the daily modulation of sleep over a controlled laboratory protocol makes the assessed sleep phenotype potentially more reproducible within a single subject, compared to field studies or single sleep recordings. Thus, while large-scale studies are needed to robustly discover associations, in-lab studies under controlled and unmasking conditions with extensively phenotyped individuals, thoroughly screened for potential comorbidities remain critical to understand the underlying mechanisms of such association. Finally, while the aim of the current work was to explore the association between circadian REM sleep modulation and age-related changes at the brain structural level, future studies with a larger sample size should explore whether age-related changes in brain structural measures contribute to the synchronization of the EEG signal and its spectral composition in a more state-dependent manner over different circadian phases.
Conclusion
Age-related changes in sleep can be partly attributed to changes in the circadian timing system. This might be particularly true for REM sleep, considering that it is under strong circadian control. Here, we not only confirmed age-related changes in REM sleep expression over the circadian cycle but also observed a significant association between the latter and regional gray matter organization. Our findings generally point toward a protective role of circadian REM sleep modulation for preserved cortical gyrification and go in line with previous findings suggesting REM sleep regulation as a determinant factor for brain function over lifespan [65, 76–78]. Future studies should focus on the association between sleep regulation, its micro- and macro-structure, and functional brain integrity markers. Within this perspective, an integrative approach covering the circadian and homeostatic regulation of sleep, but also the combined assessment of gray and white matter characteristics, as well as their functional connections, would help to further disentangle the mechanisms underlying the association between sleep and brain aging.
Supplementary material
Supplementary material is available at SLEEP online.
FundingThis study was supported by the European Research Council (ERC, ERCStG-COGNAP) under the European Union’s Horizon 2020 research and innovation programme (grant agreement #757763). This study was also supported by the Fonds de la Recherche Scientifique—FNRS (grant agreement #T.0220.20) and the Swiss National Foundation (grant agreement #310030_130689), the L. & Th. La Roche-Stiftung, and the Niklaus und Bertha Burckhardt-Bürgin-Stiftung. C. S. and G. V. are research associates and M.De., M.Do. and S.D. received PhD grants of the Fonds de la Recherche Scientifique—FNRS, Belgium, C.R. is supported by the the Gertrud Thalmann funds of the Psychiatric University Clincis of Basel, Switzerland. CC is a Research professor funded by the Swiss National Foundation.
Disclosure statements
This was not an industry-supported study. The local ethics committee of the respective study centers (Ethikkommission Beider Basel, EKBB, Switzerland; Ethics committee of the University Hospital and the Faculty of Psychology, Logopedics and Educational Sciences at the University of Liège, Belgium) approved the study, and procedures conformed to the standards of the Declaration of Helsinki. All participants provided written informed consent before participation and received financial compensation for study participation.
Financial Disclosure: The authors of this work declare that there are no financial conflicts of interest related to this study. While CB is the founder and CEO of PHYSIP SA, no compensation was given to Physip for this research, and Physip did not provide any funding for this research.
Non-Financial Disclosure: The authors of this work declare that there are no non-financial conflicts of interest related to this study.
References
Author notes
Equal contribution.


Comments