


Abstract
Reductions in hippocampal volume (HV) have been associated with both prolonged exposure to stress and psychotic illness. This study sought to determine whether higher levels of neighborhood poverty would be associated with reduced HV among individuals at clinical high-risk for psychosis (CHR-P), and whether social engagement would moderate this association. This cross-sectional study included a sample of participants (N = 174, age-range = 12–33 years, 35.1% female) recruited for the second phase of the North American Prodrome Longitudinal Study. Generalized linear mixed models tested the association between neighborhood poverty and bilateral HV, as well as the moderating role of social engagement on this association. Higher levels of neighborhood poverty were associated with reduced left (β = −0.180, P = .016) and right HV (β = −0.185, P = .016). Social engagement significantly moderated the relation between neighborhood poverty and bilateral HV. In participants with lower levels of social engagement (n = 77), neighborhood poverty was associated with reduced left (β = −0.266, P = .006) and right HV (β = −0.316, P = .002). Among participants with higher levels of social engagement (n = 97), neighborhood poverty was not significantly associated with left (β = −0.010, P = .932) or right HV (β = 0.087, P = .473). In this study, social engagement moderated the inverse relation between neighborhood poverty and HV. These findings demonstrate the importance of including broader environmental influences and indices of social engagement when conceptualizing adversity and potential interventions for individuals at CHR-P.
Introduction
Prospective studies have demonstrated that children and adolescents from disadvantaged backgrounds are more likely to experience serious mental illnesses, including schizophrenia and other psychotic disorders.1 Diathesis-stress models have dominated theorizing about the etiology of psychotic illnesses, with recent models assuming that a confluence of brain vulnerabilities, stress, and genetic variation contributes to psychosis onset.2 Psychotic disorders are associated with reductions in the volume of several brain regions.3–5 Meta-analysis indicate that hippocampal volume (HV) reductions are the most pronounced brain morphometric abnormality in individuals with psychosis relative to healthy individuals.6 The hippocampus is a key region in theories of the pathophysiology of psychotic disorders, as well as other mental illnesses (eg, depression) and neurologic diseases (eg, Alzheimer’s), and is critically important to cognitive function.7,8
Studies of monozygotic twin pairs discordant for psychosis have found significantly reduced HV in the affected compared to nonaffected co-twin, which suggests that HV is particularly vulnerable to environmental influence.6,9–11 Indeed, non-human animal models have demonstrated dendritic atrophy in the hippocampus following prolonged exposure to stress.12 Moreover, investigations of genetic influence on regional brain volumes have revealed lower heritability estimates for HV than the volumes of other brain regions (eg, 40% and 88% heritability for hippocampal and cerebellar volumes, respectively),13–15 indicating that the hippocampus is more sensitive to environmental influence than other brain regions. In a large community sample, polygenic risk scores for schizophrenia (PRS-SCZ) were predictive of cortical volume, but not HV, after controlling for environmental risk factors.16
The hippocampus has a protracted developmental course, is rich in glucocorticoid receptors (eg, cortisol in humans), and maintains a prominent role in glucocorticoid negative feedback throughout development, which provides an extended period of hippocampal vulnerability to environmental insults.17,18 In both healthy and clinical samples, stressors associated with low socioeconomic status (SES) and poverty have been linked to structural and functional changes in the brain,19 particularly reductions in HV and impaired cognitive task performance, especially learning and memory.19–25 A recent study demonstrated that the strength of the positive relation between SES and HV increases in magnitude with age in children and young adults, but this effect was not observed in other brain regions.26 These findings are consistent with the protracted development of the hippocampus, and rodent models have demonstrated that environmental enrichment is associated with increases in HV.27 Thus, elucidating key risk and protective factors germane to hippocampal morphology has implications for treatment and intervention. While much of the research on associations between SES and brain structure has centered on household SES, little is known about the unique associations of broader neighborhood environmental factors with brain morphology.
Research suggests that neighborhood environmental factors may be important determinants of neurodevelopment. For example, residents of affluent neighborhoods may sustain neighborhood social organization that promotes community attachment and establishment and reinforcement of positive norms.28,29 Social disorganization theory posits that neighborhoods in which residents interact positively—by forming social ties and engaging in collective behavior that establishes norms, reciprocity, trust, and collective action—contribute to a safe, healthy, and positive social environment.30 Thus, collective neighborhood SES may have downstream effects on the social environment for children and adolescents, above and beyond their household SES,31 which may impact neurodevelopment and subsequent mental health outcomes.
Neighborhood characteristics, including socioeconomic deprivation, are associated with a higher prevalence and incidence of psychosis and psychotic-like experiences, even after accounting for genetic risk measured by family history of psychosis and PRS-SCZ.32–36 This relationship may be due in part to social stressors related to socioeconomic deprivation, such as sparse neighborhood resources or redlining-related practices. Neighborhood deprivation has been linked with reductions in total and right HV among healthy children and adults.37,38 Conversely, positive family and school environments may buffer against brain morphological changes associated with neighborhood disadvantage.39–41
Taken together, research suggests that social engagement with peers and the community may serve as a moderator and buffer against the deleterious effects of neighborhood poverty on HV. To the best of our knowledge, no published studies have examined the moderating role of social engagement on the association between neighborhood poverty and HV. Furthermore, while both low SES and reductions in HV have repeatedly been associated with psychotic illness,8 the relation of neighborhood poverty and HV in individuals at clinical high-risk for psychosis (CHR-P) has not been examined. It remains unknown how neighborhood poverty and individual social engagement interact in determining HV among individuals at CHR-P. We hypothesized that higher levels of neighborhood poverty would be associated with reduced HV with differential effects for right versus left hemisphere due to findings reported in the literature.37 We also anticipated a significant interaction between neighborhood poverty and social engagement, such that the inverse relation between neighborhood poverty and HV would be lower in magnitude among individuals with higher levels of social engagement compared to those with lower levels of social engagement.
Methods and Materials
Participants
Data were collected at the baseline visit of the second phase of the North American Prodrome Longitudinal Study (NAPLS2), a multi-site consortium that recruited help-seeking adolescents and young adults at CHR-P. Individuals at CHR-P met the Criteria of Prodromal Syndromes (COPS), which is based on the Structured Interview for Psychosis Risk Syndromes (SIPS).42 The aims, recruitment methods, and inclusion criteria have been described elsewhere.43,44 Participants included in the present sample are those whose addresses at baseline were available for geo-coding, who had stable living arrangements, and whose structural magnetic resonance imaging (MRI) data passed quality assurance metrics. Participants’ addresses were only accessible from the Emory University, Yale University, University of California Los Angeles, University of North Carolina, and Zucker Hillside Hospital sites. The study protocol and consent forms were reviewed and approved by the Institutional Review Boards at all participating sites, and all procedures complied with the ethical standards of relevant local and national committees.
Instruments
Sociodemographic and clinical variables were obtained from self-report and interview-based measures at the time of baseline assessment and included age, sex, race/ethnicity, family history of mental illnesses, childhood poverty, parental education level, life event stress, social engagement, and address.45,46
The SIPS was administered by experienced clinicians and graduate-level trainees who had undergone the SIPS Certification Training. The Family Interview for Genetic Studies was used to obtain family history of mental illnesses, which included depression, bipolar disorder, psychosis, or schizophrenia among first- or second-degree family members.47 Childhood poverty was determined by the ratio of household income to needs, which was computed by dividing reported family of origin income by the 2014 US Census poverty line for a family of that size.48 Parental education level was a continuous measure computed as the average z-score for the highest education level attained by the parents. Life event stress was assessed using the Life Events Scale (LES),45,49 modified to exclude life events of lesser relevance to CHR-P youth (eg, getting divorced).45 Participants indicated whether they had ever experienced each stressor and the level of distress caused by each endorsed event (scored on a 7-point scale where 1 = no stress and 7 = caused me to panic). The LES is comprised of both desirable and undesirable events. For social engagement, we used the total count of 5 items from the subscale of LES as these items were categorized as desirable social activities and were used in prior studies to measure social engagement.50,51 Desirable events include: (1) increased involvement in church or synagogue, club, neighborhood, or other organization; (2) took a vacation; (3) took up a new hobby, sport, craft, or recreational activity; (4) acquired a pet; and (5) made new friends.
Neighborhood Poverty
Neighborhood poverty was indexed according to the 2010 American Community Survey 5-year estimates. Addresses collected at baseline from November 2008 to March 2013 were linked to census tracts, and these census tracts were then linked to census tract-level poverty, defined as the percentage of individuals in a census tract whose income in the past 12 months was below the federal poverty level. There were 167 unique census tracts across the five sites.
Imaging Data Acquisition and Processing
Structural MRI was performed at all sites. Relevant to the present sample, four sites (Emory University; University of California, Los Angeles; University of North Carolina; and Yale University) used Siemens scanners, and one site (Zucker Hillside Hospital) used the GE scanner. All scanners had 3 Tesla magnetic field strength. Siemens sites all used 12-channel head coils and the GE site used an 8-channel head coil. Sequence parameters were optimized for each scanners’ manufacturer, software version, and coil configuration according to the ADNI protocol.52 Scans were all acquired in the sagittal plane with a 1 × 1 mm in-plane resolution and 1.2 mm slice thickness. Siemens scanners used an MPRAGE sequence with a 256 (axial) × 240 (sagittal) × 176 (coronal) mm field of view, TR/TE/TI ¼ 2300/2.91/900 ms, and a 9-degree flip angle, whereas GE scanners used an IR-SPGR sequence with a 26 cm field of view, TR/TE/TI ¼ 7.0/minimum full/400, and an 8-degree flip angle.53
Automated surface-based cortical reconstruction, cortical parcellation, and subcortical segmentation were performed using the Freesurfer software suite version 5.3.54,55 HV measures were extracted using a gyral and sulcal pattern-based Desikan atlas with 34 parcels in each hemisphere.56 HV measures were adjusted for study site, MRI manufacturer (GE versus Siemens), and estimated intracranial volume (ICV), consistent with prior work demonstrating that HV is highly correlated with ICV.53,57 Measures of HV were reliable across MRI scanners used in this study.53
Data Analysis
We first calculated the bivariate correlations among neighborhood poverty, sociodemographic characteristics, and bilateral HV. Multilevel generalized linear mixed modeling (GLMM) was used to test the association between neighborhood poverty and bilateral HV. Individuals were clustered within neighborhoods. The model was adjusted by including potential confounders including age, sex, race/ethnicity, family history of mental illnesses, childhood poverty, parental education, and life event stress. Unique census tract was treated as a random factor because individuals were clustered in neighborhoods. To test for the potential moderating roles of age, sex, and social engagement on the relationship between neighborhood poverty and HV, each potential moderator and their respective interaction terms were entered as fixed factors. The association between neighborhood poverty and HV was tested using Bonferroni correction for multiple comparisons (2-sided α = 0.025 for primary outcomes). The IBM SPSS 24.0.0 statistical software package was used for all analyses.
Results
Sample Characteristics
This study included 174 participants at CHR-P. Demographic characteristics of the sample are summarized in table 1. A comparison of these characteristics between participants included in this study and those not included due to absence of addresses for geo-coding are shown in Supplementary Table 1. Bivariate correlations among predictor variables (ie, neighborhood poverty, age, race/ethnicity, childhood poverty, and social engagement) and bilateral HV are presented in table 2.
Sociodemographic Characteristics of the Study Sample, n = 174
| n (%) | |
|---|---|
| Age | |
| 12.0 to 16.0 | 63 (36.2) |
| 16.1 to 20.0 | 65 (37.4) |
| 20.1 to 33.0 | 46 (26.4) |
| Sex | |
| Male | 113 (64.9) |
| Female | 61 (35.1) |
| Race | |
| White (European) | 97 (55.7) |
| Black (eg, African American, African Caribbean) | 36 (20.7) |
| Interracial | 17 (9.8) |
| Central/ South American | 10 (5.7) |
| South Asian (eg, East Indian, Pakistani, Sri Lankan) | 5 (2.9) |
| East Asian (eg, Chinese, Japanese, Korean) | 4 (2.3) |
| Southeast Asian (eg, Cambodian, Indonesian, Vietnamese) | 2 (1.1) |
| First Nations (eg, North American Indian, Métis, Inuit) | 1 (0.6) |
| West/Central Asia and Middle East (eg, Egyptian, Lebanese, United Arab Emirates, Afghanistan, Iranian) | 1 (0.6) |
| Native Hawaiian or Pacific Islander | 1 (0.6) |
| Hispanic ethnicity | |
| Yes | 41 (23.6) |
| No | 133 (76.4) |
| Family history of mental illnesses | |
| Yes | 77 (44.3) |
| No | 97 (55.7) |
| Childhood poverty | |
| Yes | 30 (17.2) |
| No | 144 (82.8) |
| Paternal education level (n = 164) | |
| Completed high school | 138 (84.1) |
| Did not complete high school | 26 (15.9) |
| Maternal education level (n = 171) | |
| Completed high school | 151 (88.3) |
| Did not complete high school | 20 (11.7) |
| Life event stress | |
| 0 to 50 | 67 (38.5) |
| 51 to 100 | 58 (33.3) |
| 101 to 655 | 49 (28.2) |
| Neighborhood poverty | |
| 0 to 5.0 | 74 (42.5) |
| 5.1 to 10.0 | 38 (21.8) |
| 10.1 to 73.0 | 62 (35.6) |
| Social engagement | |
| 0 | 1 (0.6) |
| 1 | 18 (10.3) |
| 2 | 17 (9.8) |
| 3 | 41 (23.6) |
| 4 | 62 (35.6) |
| 5 | 35 (20.1) |
Correlations Among Sociodemographic Characteristics and Hippocampal Volumes
| Age | Sex | White non-Hispanic race/ethnicity | Family history of mental illnesses | Childhood poverty | Parental education level index | Life events stress | Social engagement | Neighborhood poverty | Left hippocampal volume | |
|---|---|---|---|---|---|---|---|---|---|---|
| Sex | −0.029 | |||||||||
| White non-Hispanic race/ethnicity | −0.058 | −0.092 | ||||||||
| Family history of mental illnesses | −0.084 | 0.049 | .161* | |||||||
| Childhood poverty | 0.132 | 0.015 | −0.049 | −0.07 | ||||||
| Parental education level index | −0.004 | 0.062 | 0.003 | 0.031 | −0.113 | |||||
| Life events stress | .394** | 0.119 | 0.046 | −0.009 | .211** | 0.017 | ||||
| Social engagement | 0.058 | .208** | 0.08 | 0.031 | −0.026 | 0.101 | .185* | |||
| Neighborhood poverty | 0.149 | 0.041 | −0.264** | −0.005 | .243** | −0.189* | −0.066 | −0.177* | ||
| Left hippocampal volume | −0.091 | −0.471** | 0.118 | 0.051 | 0.009 | 0.067 | −0.142 | 0.089 | −0.191* | |
| Right hippocampal volume | 0.022 | −0.408** | 0.113 | 0.034 | 0.039 | 0.088 | −0.125 | 0.115 | −0.174* | .819** |
*Correlation is significant at P < .05.
** = Correlation is significant at P < .01.
Note: Pearson’s correlation was used between continuous variables, Cramer’s V was used between categorical variable (eg, sex, race/ethnicity, and family history of mental illnesses), and point-biserial correlation was used between continuous and categorical variables. Neighborhood poverty was defined as the percentage of individuals in a census tract whose income in the past 12 months was below the federal poverty level.
Main Effect of Neighborhood Poverty on Left and Right Hippocampal Volumes
In the main analysis that excluded moderation effects, neighborhood poverty was associated with reduced left HV (unadjusted β = −0.191; 95% CI = −0.339 to −0.043; P = .011), even after adjusting for other sociodemographic characteristics (adjusted β = −0.180; 95% CI = −0.327 to −0.034; P = .016). LES was also inversely associated with left HV (unadjusted β = −0.261; 95% CI = −0.386 to −0.135; P ≤ .001). In the main analysis that included right HV as the outcome variable, neighborhood poverty was associated with reduced right HV (unadjusted β = −0.174; 95% CI = −0.322 to −0.026; P = .022), even after adjusting for other sociodemographic characteristics (adjusted β = −0.185; 95% CI = −0.335 to −0.035; P = 0.016) (table 3).
Generalized Linear Mixed Univariate and Multivariate Models Predicting Hippocampal Volumes of Both Hemispheres
| Univariate LHV | Model A LHV | Univariate RHV | Model B RHV | |||||||||
|---|---|---|---|---|---|---|---|---|---|---|---|---|
| β | 95% CI | P | β | 95% CI | P | β | 95% CI | P | β | 95% CI | P | |
| Age | −0.090 | −0.240 to 0.059 | 0.235 | −0.028 | −0.173 to 0.117 | 0.701 | 0.022 | −0.128 to 0.173 | 0.773 | 0.091 | −0.060 to 0.242 | 0.235 |
| Sex | −0.471 | −0.604 to −0.338 | <0.001 | −0.455 | −0.589 to −0.321 | <0.001 | −0.408 | -0.545 to -0.270 | <0.001 | −0.386 | −0.524 to −0.248 | <0.001 |
| White non-Hispanic race/ethnicity | 0.119 | −0.030 to 0.269 | 0.117 | 0.027 | −0.111 to 0.165 | 0.700 | 0.113 | −0.037 to 0.262 | 0.139 | 0.037 | −0.106 to 0.180 | 0.608 |
| Family history of mental illnesses | 0.052 | −0.099 to 0.202 | 0.497 | 0.075 | −0.059 to 0.208 | 0.270 | 0.034 | −0.116 to 0.185 | 0.653 | 0.058 | −0.079 to 0.196 | 0.404 |
| Childhood poverty | 0.003 | −0.147 to 0.154 | 0.963 | 0.094 | −0.045 to 0.233 | 0.185 | 0.039 | −0.112 to 0.189 | 0.614 | 0.127 | −0.017 to 0.271 | 0.084 |
| Parental education | 0.067 | −0.084 to 0.217 | 0.384 | 0.071 | −0.063 to 0.205 | 0.300 | 0.088 | −0.062 to 0.238 | 0.249 | 0.092 | −0.046 to 0.230 | 0.190 |
| Life event stress | −0.261 | −0.386 to −0.135 | <0.001 | −0.129 | −0.276 to 0.018 | 0.084 | −0.126 | −0.276 to 0.023 | 0.097 | −0.157 | −0.311 to −0.003 | 0.045 |
| Neighborhood poverty | −0.191 | −0.339 to −0.043 | 0.011 | −0.180 | −0.327 to −0.034 | 0.016 | −0.174 | −0.322 to −0.026 | 0.022 | −0.185 | −0.335 to −0.035 | 0.016 |
All models used generalized linear mixed models with census tracts as the random intercept.
Univariate LHV tested associations between individual predictor variables and left hippocampal volume.
Model A LHV tested the multivariable associations between all variables shown and left hippocampal volume.
Univariate RHV tested associations between individual predictor variables and right hippocampal volume.
Model B RHV tested the multivariable associations between all variables shown and right hippocampal volume.
All significant associations (P < .025) are shown in bold.
Testing Age, Sex, and Social Engagement as Potential Moderators of the Relationships Between Neighborhood Poverty and HVs
The interaction terms age-by-neighborhood poverty as well as sex-by-neighborhood poverty were not significantly associated with bilateral HV (Supplementary Tables S2 and S3). The interaction term social engagement-by-neighborhood poverty was significantly associated with left (unadjusted β = 0.217; 95% CI = 0.058 to 0.375; P = .008) and right HV (unadjusted β = 0.262; 95% CI = 0.104 to 0.419; P = .001) even after adjusting for covariates (adjusted β = 0.170; 95% CI = 0.031 to 0.309; P = .017; and adjusted β = 0.210; 95% CI = 0.067 to 0.352; P = 0.004, respectively) (Supplementary Table S4).
Neighborhood Poverty and HVs Stratified by Social Engagement
To unpack the significant interactions observed, we stratified the sample into subgroups of participants whose total social engagement score was below (n = 77) or at and above (n = 97) three, the median total social engagement (table 4). Among those with lower social engagement (≤3), neighborhood poverty was inversely associated with left (adjusted β = −0.266; 95% CI = −0.452 to −0.081; P = .006) and right HV (adjusted β = −0.316; 95% CI = −0.517 to −0.116; P = .002). However, among those with greater social engagement (>3), neighborhood poverty was not associated with left (adjusted β = −0.010; 95% CI = −0.248 to 0.227; P = .932) or right HV (adjusted β = 0.087; 95% CI = −0.154 to 0.329; P = .473). Best-fit lines of the associations between neighborhood poverty and HVs for each subgroup are shown in figure 1.
Neighborhood Poverty and Hippocampal Volumes Stratified by Social Engagement
| Model C LHV (n = 77) | Model D LHV (n = 97) | Model E RHV (n = 77) | Model F RHV (n = 97) | |||||||||
|---|---|---|---|---|---|---|---|---|---|---|---|---|
| β | 95% CI | P | β | 95% CI | P | β | 95% CI | P | β | 95% CI | P | |
| Age | 0.014 | −0.193 to 0.222 | 0.891 | −0.022 | −0.194 to 0.151 | 0.805 | 0.097 | −0.116 to 0.309 | 0.367 | 0.068 | −0.144 to 0.280 | 0.526 |
| Sex | −0.523 | −0.741 to −0.305 | <0.001 | −0.368 | −0.532 to −0.203 | <0.001 | −0.448 | −0.673 to −0.224 | <0.001 | −0.348 | −0.533 to −0.162 | <0.001 |
| White non-Hispanic race/ethnicity | −0.005 | −0.043 to 0.032 | 0.786 | 0.089 | −0.080 to 0.257 | 0.300 | −0.030 | −0.245 to 0.185 | 0.782 | 0.118 | −0.084 to 0.320 | 0.250 |
| Family history of mental illnesses | 0.035 | −0.164 to 0.235 | 0.726 | 0.128 | −0.040 to 0.295 | 0.133 | 0.100 | −0.104 to 0.305 | 0.331 | 0.002 | −0.186 to 0.190 | 0.981 |
| Childhood poverty | 0.198 | −0.005 to 0.400 | 0.056 | 0.048 | −0.157 to 0.254 | 0.641 | 0.172 | −0.035 to 0.379 | 0.101 | 0.092 | −0.118 to 0.301 | 0.388 |
| Parental education | 0.093 | −0.110 to 0.296 | 0.366 | 0.023 | −0.150 to 0.195 | 0.793 | 0.118 | −0.095 to 0.331 | 0.273 | 0.032 | −0.159 to 0.222 | 0.740 |
| Life event stress | −0.292 | −0.533 to −0.051 | 0.018 | −0.044 | −0.237 to 0.149 | 0.654 | −0.249 | −0.499 to 0 | 0.050 | −0.114 | −0.315 to 0.086 | 0.260 |
| Neighborhood poverty | −0.266 | −0.452 to −0.081 | 0.006 | −0.010 | −0.248 to 0.227 | 0.932 | −0.316 | −0.517 to −0.116 | 0.002 | 0.087 | −0.154 to 0.329 | 0.473 |
All models used generalized linear mixed multivariate models with census tracts as the random intercept.
Model C LHV tested the associations between all variables shown and left hippocampal volume among individuals with lower social engagement (n = 77).
Model D LHV tested the associations between all variables shown and left hippocampal volume among individuals with higher social engagement (n = 97).
Model E RHV tested the associations between all variables shown and right hippocampal volume among individuals with lower social engagement (n = 77).
Model F RHV tested the associations between all variables shown and right hippocampal volume among individuals with higher social engagement (n = 97).
All significant associations (P < .025) are shown in bold.
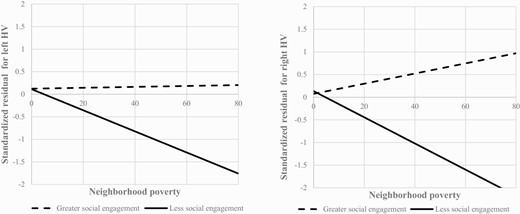
Best-fit lines for the association between neighborhood poverty and left and right HVs based on levels of social engagement.Note: Neighborhood poverty was defined as the percentage of individuals in a census tract whose income in the past 12 months was below the federal poverty level. Standardized residuals for both left and right HVs were adjusted for age, sex, race/ethnicity, family history of mental illnesses, childhood poverty, parental education, life event stress, study site, MRI manufacturer (GE versus Siemens), and intracranial volume.
Discussion
Our findings suggest that neighborhood poverty was significantly inversely associated with bilateral HV among individuals at CHR-P. This association was observed after adjusting for potential confounders, suggesting that neighborhood structural factors may be associated with brain morphological changes implicated in the pathophysiology of psychotic disorders.
Our findings build upon prior work demonstrating the inverse relationship between poverty and HV.25,37 While Taylor et al. demonstrated the association between area-level deprivation and HV in the right hemisphere, our study showed the relationship between neighborhood poverty and HV to be significant bilaterally. The differences may be due to a complex mix of genetic and environmental factors as well as the timing of exposure to environmental stressors. Evidence from animal models and human studies suggests that early-life environmental stressors appear to have a greater impact on brain morphometry in the right hemisphere.58 Participants in the prior study37 were younger, so the early-life stressor of living in a poor neighborhood could have had a greater impact on right HV. In contrast, participants in our study were older and may have experienced chronic stressors later in their lives, which may have impacted HV bilaterally.
In our study, we also found that females have smaller hippocampal volumes compared to males. Prior findings on sex differences in hippocampal volume have been inconsistent, reporting on both smaller and larger total hippocampal volumes in males59 versus females60,61 as well as no differences.62 This inconsistency may be due to the heterogeneity in clinical characteristics across samples, techniques used for hippocampal segmentation in studies of subregions, and/or the use of different methods to adjust for brain size across studies.63,64
Overall, our results suggest that above and beyond individual-level characteristics associated with reductions in HV—including a family history of mental illnesses65 and socioeconomic status25—structural environmental factors relevant to neighborhood poverty (eg, community resources) may be associated with brain morphology. Indeed, neighborhood disadvantage has been found to be associated with increased allostatic load (ie, a quantified index of multiple stress indicators) even after adjusting for life event stressors.66 Reductions in HV associated with stressful exposures putatively involve the hypothalamic-pituitary-adrenal (HPA) axis, regulated in part by negative feedback via glucocorticoid receptors in the hippocampus and other brain regions.67 Under conditions of mild or acute stress, normal activation of the HPA axis promotes allostatic processes in the brain.68 However, if stressors become chronic or repeated, adverse effects on brain structure may be observed.69,70 Within this framework, the long-term effect of unfavorable neighborhood characteristics, including area-level poverty, constitutes a chronic exposure to stress.
Interestingly, we also found social engagement to be a moderator of the association between neighborhood poverty and HV. Among those engaged with fewer social activities, there was an inverse relationship between neighborhood poverty and bilateral HV. However, among those with higher levels of social engagement, there was no relationship between neighborhood poverty and bilateral HV. This cross-sectional study cannot identify the causal directionality of the relationship between social engagement and HV. It is possible that social engagement buffers against the adverse impact of neighborhood poverty on HV or that greater HV may promote social engagement. Longitudinal work in this area is warranted.
Prior studies have shown that psychosocial resources and supports mitigate the deleterious effect of poverty and other stressors on HV. In animal models of associations between stress and brain morphology, exposure to social interaction with members of the same species buffers stress-induced changes in the hippocampus, including reductions in HV.71,72 Evidence from several studies suggests that the corticosterone response to stress is attenuated by social interactions via an oxytocin-dependent mechanism.73–76 The buffering effect of social interactions on stress-induced physiological changes has also been shown in humans and further attributed to the informational, instrumental, or emotional support gained by social interaction and engagement.77,78 Moreover, self-esteem, which is positively linked to social relationships, reduces the strength of the inverse relationship between poverty and HV.79 It is possible that greater social engagement may also buffer against chronic stressors associated with neighborhood poverty via increased self-esteem, which may have implications for intervention development (eg, increased feelings of self-efficacy).
In future studies, it would be important to ascertain whether the events used to evaluate social engagement in our study are attributable to subjective qualities (eg, the social skills of the individual allow them to meet new friends) and/or the environment (eg, a better social structure of the local community may provide more opportunities for the individual to make new friends). Clinical parameters that measure adaptive skills or social functioning (eg, premorbid adjustment scale and the Global Functioning: Social Scale) as well as neighborhood-level social characteristics could be used to further investigate these findings.
It is also possible that social engagement acts as a proxy for some other variable that exerts protective effects on brain morphology. For example, social engagement could be linked to greater access to other psychosocial resources, less perceived discrimination, or better social adjustment. As such, it will be important to examine the roles of these variables to deepen our understanding of the mechanism underlying associations between neighborhood-level characteristics, social engagement, and brain morphology. In addition, it will be important to understand the mediators of this relationship and identify the aspects of neighborhood deprivation that have the most detrimental impacts on neurodevelopment.
This study has several limitations. Although items used to measure social engagement have been used in prior studies to capture desirable social life events, these life events might be confounded by SES as opposed to capturing social engagement. However, it seems unlikely that social engagement is confounded by SES in the analyses presented here because we controlled for both childhood poverty and parental education. Second, because residential addresses were available from only five sites and from CHR-P participants, the sample size was limited and we were unable to test whether the relationship between neighborhood poverty and HV differed by CHR-P versus healthy control status and whether HV may mediate the relationship between neighborhood poverty and psychosis, depression, and clinical severity. Third, this is a cross-sectional study of a dynamic phenomenon (ie, hippocampal plasticity) which precludes firm conclusions about causality. Fourth, given evidence that HV is associated with both genetic and environmental variables,80,81 elucidating the respective contributions of such variables to HV is an important area for future research. As noted above, however, recent findings indicate that PRS-SCZ are not significantly predictive of HV after environmental risk factors are controlled.16 Fifth, this sample included help-seeking individuals at CHR-P, so participants included in the present study may not be representative of individuals at CHR-P in general. Finally, neighborhood poverty was indexed only based on the participants’ addresses at baseline assessment. As such, it is not known how long participants had lived at these addresses, whether these addresses truly reflect participants’ childhood environments, and whether any residential instability and/or social mobility had occurred.
Conclusion
This study provides novel evidence for the role of neighborhood poverty on HV among individuals at CHR-P and that social engagement moderates this association such that among those with high levels of social engagement, there was no association between neighborhood poverty and HV, but among those with lower levels of social engagement, there was an inverse relationship between neighborhood poverty and HV. These results suggest that neighborhood poverty may be important to brain maturation among some more than others. It is possible that social engagement may mitigate the deleterious effects of neighborhood poverty on brain morphology, which may inform interventions offered to individuals from disadvantaged neighborhoods. If replication of the relationships between neighborhood poverty, HV, and social engagement is established in other populations in longitudinal studies, then targeted interventions at the community level and increased social engagement may potentially play a major role in disease prevention among youth at CHR-P.
Funding
This work was supported in part by the National Institute of Mental Health (NIMH) grants (R25-MH101079 [to B.S.K.], U01 MH081902 [to T.Y.C.], P50 MH0 66286 [to C.E.B.], U01 MH081857 [to B.A.C.], U01 MH82022 [to S.W.W.], U01 MH066134 [to J.A.], U01 MH081944 [to K.S.C.], R01 U01 MH066069 [to D.O.P.], R01 MH076989 [to D.H.M.], and U01 MH081988 [to E.F.W.]).
Conflict of Interest Statement
T.Y.C. has served as a consultant for Boehringer-Ingelheim Pharmaceuticals and Lundbeck A/S. D.H.M. has served as a consultant for Aptinyx, Boehringer-Ingelheim Pharmaceuticals, Cadent Therapeutics, and Greenwich Biosciences. D.O.P. has served as a consultant for Sunovion and Alkermes, has received research support from Boehringer-Ingelheim, and has received royalties from American Psychiatric Association Publishing. S.W.W. has received investigator-initiated research support from Pfizer and sponsor-initiated research support from Auspex and Teva; he has served as a consultant for Biomedisyn (unpaid), Boehringer-Ingelheim, and Merck and as an unpaid consultant to DSM-5; he has been granted a patent for a method of treating prodromal schizophrenia with glycine; and he has received royalties from Oxford University Press. The other authors report no financial relationships with commercial interests.
