


Abstract
To examine the association between baseline alterations in grey matter volume (GMV) and clinical and functional outcomes in people at clinical high risk (CHR) for psychosis.
265 CHR individuals and 92 healthy controls were recruited as part of a prospective multi-center study. After a baseline assessment using magnetic resonance imaging (MRI), participants were followed for at least two years to determine clinical and functional outcomes, including transition to psychosis (according to the Comprehensive Assessment of an At Risk Mental State, CAARMS), level of functioning (according to the Global Assessment of Functioning), and symptomatic remission (according to the CAARMS). GMV was measured in selected cortical and subcortical regions of interest (ROI) based on previous studies (ie orbitofrontal gyrus, cingulate gyrus, gyrus rectus, inferior temporal gyrus, parahippocampal gyrus, striatum, and hippocampus). Using voxel-based morphometry, we analysed the relationship between GMV and clinical and functional outcomes.
Within the CHR sample, a poor functional outcome (GAF < 65) was associated with relatively lower GMV in the right striatum at baseline (P < .047 after Family Wise Error correction). There were no significant associations between baseline GMV and either subsequent remission or transition to psychosis.
In CHR individuals, lower striatal GMV was associated with a poor level of overall functioning at follow-up. This finding was not related to effects of antipsychotic or antidepressant medication. The failure to replicate previous associations between GMV and later psychosis onset, despite studying a relatively large sample, is consistent with the findings of recent large-scale multi-center studies.
Introduction
A key research goal in studies of people at Clinical High Risk (CHR) for psychosis is to identify measures that could help to predict clinical and functional outcomes in this population. Grey matter volume (GMV) at presentation, as assessed using Magnetic Resonance Imaging (MRI), was the first biological metric to be assessed in this population, and over the last 20 years, several studies have investigated the relationship between baseline GMV and clinical outcomes in CHR samples.1–7 Early studies involved relatively small samples and focused on later transition to psychosis as the sole outcome measure.7–9 More recently, multi-center studies included larger samples and expanded outcomes to include remission from the CHR state and level of functioning at follow up.10–13 Despite this body of work, findings have been inconsistent, and the extent to which MRI measurements of GMV differ between CHR individuals with distinct clinical outcomes is still unclear.
Although a number of early studies reported that reductions in regional GMV at baseline were associated with the subsequent onset of psychosis, the topographical location of the findings varied. For example, GMV studies comparing CHR who transitioned to those who did not, reported lower volume of the left parahippocampal gyrus,1 the left anterior cingulate cortex (ACC),6 and the bilateral insula,4 while other studies did not identify significant associations,2,3 and some found increases in hippocampal volume.5 Similarly, among more recent larger scale studies, while some have described a relationship between lower regional GMV at presentation and later transition,1 others have not.14
Relatively few MRI studies have examined associations between baseline GMV and other clinically meaningful outcomes in CHR cohorts, such as level of functioning at follow up or remission from the CHR state. A poor functional outcome has been linked to reduced frontal, limbic, and cerebellar,15 frontal, cingulate, and temporal,13 and striatal GMV at baseline.16 Nonremission from the CHR state has been associated with reduced GMV in frontal, cingulate and temporal cortex,13,15 and in orbitofrontal cortex and the pallidum.17 A longitudinal study found that nonremission was related to a greater decline in CA1 volume, a hippocampal subfield, which was further associated with increasing symptom severity over time.18 However, McIntosh and colleagues19 found no differences in brain structure (either at baseline or over time) between those CHR individuals who were still experiencing symptoms at follow-up and those who were not. This latter study involved relatives who were at genetic risk for developing schizophrenia, and it is possible that GMV differences observed in other studies might have been driven by different underlying psychopathological mechanisms.
In order to clarify the relationship between GMV in CHR individuals and adverse outcomes, we used MRI to assess a large sample of people at CHR, who were followed up clinically for at least two years to determine outcomes defined in terms of transition to psychosis, level of functioning, and remission from the CHR state. Participants were assessed at nine international sites using the same acquisition sequence (Alzheimer’s Disease Neuroimaging Initiative [ADNI] sequence).20,21 We adopted a Region of Interest approach (ROIs) to investigate whether GMV of CHR individuals was associated with transition to psychosis (transition vs nontransition, CHR-T vs CHR-NT), level of functioning (good vs poor functioning, CHR-PF vs CHR-GF), and symptomatic remission (remission vs nonremission, CHR-R vs CHR-NR). Based on findings from the studies discussed above,1,13,15-18 we hypothesized that transition to psychosis, poor functioning, and nonremission would be associated to decreased GMV within our selected ROIs. Based on mostly inconsistent findings for these outcomes, in each case, we tested the null hypothesis that GMV at baseline would not be related to each outcome at follow up. Most of the selected ROIs were based on prior studies on our outcomes of interest, however, as (1) imaging correlates of functional outcome and symptom remission are relatively new areas of research and (2) the current sample size did not allow for a full agnostic approach, we decided to also explore brain regions in which volumetric differences have been observed between CHR and healthy controls (HC). The final list of ROIs comprised the following: orbitofrontal gyrus, cingulate gyrus, gyrus rectus, inferior temporal gyrus, parahippocampal gyrus, striatum, and hippocampus.1,15,16,18,22,23 For completeness, we are also reporting GMV differences between the CHR-T and CHR-NT, CHR-PF and CHR-GF, and CHR-NR and CHR-R subgroups at the whole brain level and GMV differences between the CHR and HC subgroups within the selected ROIs.
Methods
Sample
From July 2010 to August 2015, 234 CHR individuals and 92 HC aged 18–35 years were scanned at nine centers using 3-Tesla MRI scanners and the same ADNI-2 T1 protocol20,21 (Amsterdam, the Netherlands; Basel, Switzerland; Cologne, Germany; Copenhagen, Denmark; London, United Kingdom; Melbourne, Australia; Paris, France; The Hague, the Netherlands; Vienna, Austria) as part of the EU-GEI High Risk Study20 (see Table S1). The London site included an additional 31 CHR individuals recruited as part of another study and scanned with the same scanner and sequence. Participants recruited in Amsterdam and The Hague were scanned at the same center in Amsterdam, thus they were merged and considered as one site. The final sample comprised 265 individuals at CHR. To reduce variability introduced by small samples, we only included sites that contributed neuroimaging data for at least five CHR participants. Scanner information, details of the image acquisition sequence at each site, and information on included CHR individuals at each site for each analysis are reported in Supplemental Tables S1 and S2.
Exclusion criteria for all participants were past or present diagnosis of neurological disorders according to DSM-IV criteria,24 estimated IQ lower than 60, or any MRI contraindication such as presence of metal implants, pacemakers, or pregnancy. In addition, CHR were excluded if they had a past or present diagnosis of psychotic disorder. HC were excluded if they were meeting CHR criteria, or if they had personal or familiar history of a psychiatric disorder according to DSM-IV criteria.24
Ethical approval for the study was obtained separately at each individual site and informed written consent was obtained from all the participants at the single centers. The study was conducted in accordance with the Declaration of Helsinki.
Clinical Assessment
CHR individuals were defined and assessed using the Comprehensive Assessment of At Risk Mental State (CAARMS25). CHR individuals were included if they were meeting at least one of the following criteria: (1) Attenuated Psychotic Symptoms (APS), subthreshold frequency, and/or subthreshold intensity; (2) Brief Limited Intermittent Psychotic Symptoms (ie positive psychotic symptoms at psychotic intensity and frequency which last for less than 7 days and resolved spontaneously); (3) positive family history for psychosis or schizotypal personality disorder plus chronic low functioning (<50) or a marked decline (ie 30% drop) in psychosocial functioning over the past 12 months (Genetic Risk and Deterioration Syndrome: GRD) as assessed with the SOFAS.26 At baseline, all participants were assessed by trained raters using the CAARMS,25 the Global Assessment of Functioning (GAF27), and the SOFAS.26 Raters were trained in the use of the CAARMS and GAF prior to the study and completed online training videos every 12 months from study onset to assess interrater reliability (see Supplemental Methods, Table S3). When assessing CAARMS and GAF at follow-up, the timeframe considered was the time since the last follow-up. Data on baseline demographic characteristics such as age, sex, and ethnicity were obtained from the Medical Research Council Sociodemographic Schedule.28 The presence of psychosis and other Axis I comorbidities was assessed using the SCID-I.29 An estimate of the IQ was measured using the shortened version of the Wechsler Adult Intelligence Scale.30,31
Participants were invited for face-to-face follow-up assessments at 6 months, 1 year, and 2 years after baseline. Where face-to-face meetings were not possible, participants were followed up for 2 years using available clinical records, and this follow-up was extended when additional clinical data was available. Transition to psychosis was determined using the CAARMS25 and the SCID-I,29 with the clinical diagnosis of a psychotic disorder confirmed by the participant’s clinical team. Level of functioning was assessed using the GAF scale.27 Remission from the CHR state was defined as when an individual no longer met CAARMS inclusion criteria at the last follow-up assessment available.
Data Analysis
Demographic and Clinical Data. Demographic and clinical data were analyzed using SPSS, version 25.0 (IBM Corp.). Group differences were investigated using t-test for continuous variables and χ 2 test for categorical variables.
MRI Preprocessing. Voxel Based Morphometry (VBM) as implemented in the Statistical Parametric Mapping software (SPM12; http://www.fil.ion.ucl.ac.uk/spm) was employed to investigate GMV differences between groups. First, all Sstructural images were visually checked for artifacts, and poor-quality images were excluded. Assessment of image quality resulted in the exclusion of three participants (one with large congenital cyst, one with distortion from brace, one with movement artefact). Second, T1 images were preprocessed with a unified segmentation procedure32 implemented in SPM12. All images were segmented into grey matter (GM), white matter (WM), and cerebrospinal fluid (CSF) partitions. Subsequently, a fast diffeomorphic image registration algorithm (DARTEL) was used to warp the GM partitions into a new study-specific reference space with an isotropic spatial resolution of 1.5 mm3.33–35 The warped grey partitions were then affine transformed into the Montreal Neuroanatomical Imaging (MNI) space. An additional “modulation” step36 was used to scale the grey matter probability values by the Jacobian determinants of the deformations to ensure that the total amount of grey matter in each voxel was conserved after the registration. As a final step, the grey matter probability values were smoothed using an 8 mm full-width at half-maximum (FWHM) Gaussian kernel. Proportional scaling of the total intracranial volume was used to identify regionally specific changes that were not confounded by global differences.
ROI Analysis
An ROI approach was used to investigate group differences in a priori brain areas in which volumetric abnormalities have been identified in previous studies on remission, functional outcomes, and comparisons of CHR individuals and HC. These comprised sets of bilateral cortical and subcortical regions which were examined in two anatomical masks. The first mask included the following cortical regions: orbitofrontal gyrus, cingulate gyrus, gyrus rectus, inferior temporal, and parahippocampal cortex.1,22,23 The second included the following subcortical regions: the hippocampus and the striatum (ie caudate, pallidum, putamen).15,16,18 The masks were created using the WFU Pickatlas toolbox implemented in SPM12. As these regions of interest covered a large portion of the brain, which would require a very conservative correction for multiple comparisons, we decided to use each mask individually, and then as a merged single mask.
A small volume correction for ROI analyses was applied. Within the masks, statistical inferences were made using a threshold of P < .05 after Family-Wise Error (FWE) correction for multiple comparisons. In all analyses, scanning site, age, and sex were modeled as covariates of no interest. Ethnicity was added as a covariate of no interest in the comparison between HC and CHR as there was a significant difference between groups. Results at P < .001 uncorrected are not reported in the main text but are available in the supplemental material.
Clinical and Functional Outcomes at Follow-up
In order to examine MRI correlates of transition to psychosis, functional outcome, and clinical remission we performed three full factorial analyses of co-variance (ANCOVA). In the first ANCOVA, CHR individuals who had transitioned to psychosis during follow-up (CHR-T) were compared to CHR individuals who did not transition to psychosis (CHR-NT). In the second ANCOVA we compared CHR individuals with a relatively good or poor level of functioning at the last available follow-up assessment for that participant. Following previous studies in CHR samples,37–40 a GAF score of 65 or more at follow-up was used as the threshold for a good functional outcome (CHR-GF), with a score below 65 defined as poor (CHR-PF). A third ANCOVA compared CHR individuals who still met CAARMS criteria at the last available follow-up (nonremission, CHR-NR) with CHR individuals who did not (remission, CHR-R). ROI analyses were then applied to the results of these ANCOVAs.
For completeness, we reported GMV differences between the CHR-T and CHR-NT, CHR-PF and CHR-GF, and CHR-NR and CHR-R subgroups at the whole brain level, in the Supplementary Materials (3. Supplemental results). GMV differences between CHR and HC within the selected ROIs are also reported in the Supplementary Materials (3. Supplemental results). In all analyses, scanning site, age, and sex were modeled as covariates of no interest.
In order to exclude that significant results were confounded by the use of antipsychotic or antidepressant medication or substance use (ie cannabis) we run two additional analyses. Firstly, as the number of participants taking antipsychotic medication was relatively low (N = 28), we rerun all the analyses removing these participants. Secondly, as the number of participants taking antidepressants or using cannabis was relatively high (N = 81 and N = 90), we modeled these as covariates of no interest. Results are reported in Supplementary Materials.
Results
Demographic and Clinical Data
Of the 262 CHR individuals studied at baseline (after excluding 3 participants due to poor quality of images), 234 (89.3%) were antipsychotic medication-naïve, 28 (10.7%) were taking antipsychotic medication and 81 (30.9%) were taking antidepressants. During the follow up period, 51 participants (19%) transitioned to psychosis (CHR-T), and 211 (81%) did not (CHR-NT). The mean time from baseline to transition in those individuals who transitioned to psychosis was 360.1 (SD = 409.9 days). Of the 164 CHR individuals for whom GAF data was available at the latest possible follow-up (mean time: 11.92 months [SD = 6.66 months], 63 had a good functional outcome (38%, CHR-GF, mean score at follow-up: 73.23 [SD = 7.44], mean time: 13.50 months [SD = 7.33 months]) and 101 had a poor outcome (62%, CHR-PF, mean score at follow-up: 52.02 [SD = 9.69], mean time: 10.96 months [SD = 6.06 months]). Information on remission was available for 133 individuals, of which 57 were in remission (43%, CHR-R) at follow up and 76 still met CHR criteria (57%, CHR-NR). The characteristics of these subgroups are shown in table 1. There were no significant differences between the CHR-PF and CHR-GF, CHR-NR and CHR-R, and the CHR-T and CHR-NT subgroups or between CHR individuals and HC in age, sex, or handedness. However, the CHR-PF subgroup had a significantly lower baseline GAF score than the CHR-GF subgroup (P = .01). In addition, compared to HC, CHR individuals completed significantly fewer years of education (P < .001), and differed in terms of ethnicity (P < .001; see table 2). Finally, significantly more CHR-NT individuals (n = 15) were taking antipsychotic medication at baseline compared to CHR-T individuals (n = 13, P < .001).
Baseline Demographic and Clinical Characteristics of Participants
| CHR-NT (n = 211) | CHR-T (n = 51) | P Value | CHR-GF (n = 63) | CHR-PF (n = 101) | P Value | CHR-R (n = 57) | CHR-NR (n = 76) | P Value | |
|---|---|---|---|---|---|---|---|---|---|
| Sex, N | |||||||||
| Male | 109 | 29 | .50 | 29 | 55 | .29 | 30 | 37 | .65 |
| Female | 102 | 22 | 34 | 46 | 27 | 39 | |||
| Age in years, mean (SD) | 22.7 (4.8) | 22.3 (4.0) | .60 | 22.4 (4.1) | 23.2 (5.1) | .31 | 23.0 (4.1) | 23.4 (5.5) | .64 |
| Education in years, mean (SD) | 14.6 (2.9) | 14.0 (3.0) | .30 | 15.1 (2.7) | 14.7 (3.2) | .44 | 15.5 (2.7) | 14.8 (3.0) | .18 |
| Ethnicity | |||||||||
| Caucasian | 154 | 37 | .73 | 50 | 70 | .55 | 38 | 54 | .34 |
| Black | 20 | 7 | 5 | 15 | 10 | 7 | |||
| Asian | 3 | 1 | 1 | 2 | 0 | 2 | |||
| Others | 34 | 6 | 8 | 14 | 9 | 13 | |||
| Handedness | |||||||||
| Right | 127 | 32 | .42 | 42 | 68 | .06 | 42 | 54 | .52 |
| Left | 20 | 3 | 9 | 5 | 6 | 11 | |||
| Baseline GAF score, mean (SD) | 54.7 (9.9) | 52.7 (9.1) | .31 | 56.6 (10.3) | 52.8 (9.1) | .01 | 55.2 (9.1) | 54.8 (9.5) | .81 |
| Antipsychotic medication, N | |||||||||
| Yes | 15 | 13 | <.001 | 3 | 11 | .17 | 5 | 5 | .64 |
| No | 196 | 38 | 60 | 90 | 52 | 71 | |||
| Antidepressant medication, N | |||||||||
| Yes | 68 | 13 | .35 | 22 | 30 | .49 | 23 | 22 | .17 |
| No | 143 | 38 | 41 | 71 | 34 | 54 | |||
| Cannabis, N Yes | 74 | 16 | .89 | 22 | 32 | .88 | 23 | 14 | .06 |
| No | 128 | 29 | 42 | 74 | 35 | 39 | |||
| Days to transition, mean (SD) | — | 360.1 (409.9) | NA | — | — | — | — | — | — |
Note: CHR, clinical high risk; CHR-GF, clinical high risk with good overall functioning (GAF ≥ 65); CHR-NR, clinical high risk non-remission; CHR-NT, clinical high risk non-transition; CHR-PF, clinical high risk with poor overall functioning (GAF < 65); CHR-R, clinical high risk remission; CHR-T, clinical high risk transition; GAF, Global Assessment of Functioning Scale (range: 0–100), the lower the score the more impaired overall functioning; NA, not available; SD, standard deviation.
Significant differences are highlighted in bold.
Baseline Demographic and Clinical Characteristics of the Whole CHR Sample and Healthy Controls
| Healthy Control Group (n = 92) | CHR Group (n = 262) | P Value | |
|---|---|---|---|
| Sex, N | |||
| Male | 47 | 138 | .0.83 |
| Female | 45 | 124 | |
| Age in years, mean (SD) | 23.7 (4.2) | 22.6 (4.8) | .09 |
| Education in years, mean (SD) | 16.0 (2.9) | 14.6 (2.9) | <.001 |
| Ethnicity | |||
| Caucasian | 65 | 191 | <.001 |
| Black | 10 | 27 | |
| Asian | 11 | 4 | |
| Others | 6 | 40 | |
| Antipsychotic medication, N | |||
| Yes | 0 | 28 | NA |
| No | 92 | 234 | |
| Antidepressant medication, N | |||
| Yes | 0 | 81 | NA |
| No | 92 | 181 | |
| Cannabis use, N | |||
| Yes | 25 | 90 | .96 |
| No | 43 | 157 | |
| Handedness | |||
| Right | 66 | 159 | .28 |
| Left | 6 | 23 |
Note: CHR, clinical high risk; NA, not available; SD, standard deviation.
Significant differences are highlighted in bold.
MRI Results
GMV and Transition to Psychosis. The ROI analyses found no significant differences between the CHR-T (n = 51) and CHR-NT (n = 211) subgroups (P < .05, FWE-corrected threshold). Results did not change after removing CHR participants on antipsychotic medication or adjusting for antidepressant medication use or cannabis use. Differences evident at a threshold of P < .001 uncorrected are reported in the supplementary results. No differences were found at the whole brain level.
GMV and Functional Outcome. Subcortical mask: compared to the CHR-GF subgroup (n = 63), the CHR-PF subgroup (n = 101) had less GMV in the right striatum (Montreal Neurological Institute [MNI] coordinates x = 6, y = 20, z = −3, z score = 3.79, k = 186, P = .047 FWE-corrected threshold; see figure 1). After excluding individuals that were taking antipsychotic medication (CHR-GF = 3; CHR-PF = 11), the significant effect in the right striatum remained unchanged (MNI coordinates x = 6, y = 20, z = −3, z score = 3.84, k = 246, P = .040 FWE-corrected). Antidepressant medication and cannabis use did not influence the finding in the right striatum.
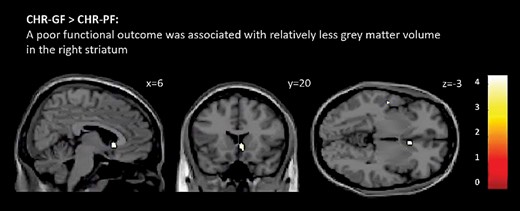
Differences between clinical high risk individuals with poor overall functioning (CHR-PF) and those with good overall functioning (CHR-GF). The CHR-PF group had less grey matter volume than did CHR-GF in the right striatum (P < .05 FWE-corrected). Effects are displayed at P < .001 uncorrected for illustration purposes. T-values are indicated by color bars (for color figure refer to online version).
Cortical and merged masks: no significant GMV differences were found (P < .05, FWE-corrected threshold). No differences were found at the whole brain level.
GMV and Remission From the CHR State. The ROI analyses showed no significant differences between the CHR-NR (n = 76) and CHR-R subgroups (n = 57) (P < .05, FWE-corrected threshold). Findings remained unchanged after removing CHR individuals on antipsychotics or adjusting for antidepressant or cannabis use. No differences were found at the whole brain level.
Discussion
The main finding from the present study was that a smaller right striatal GMV at baseline was associated with a relatively poor functional outcome in CHR individuals. However, we did not find evidence that alterations in GMV at baseline were linked to either later onset of psychosis or to remission from the CHR state.
An association between altered striatal volume and functional outcome in people at high risk for psychosis is consistent with data from previous studies. De Wit and colleagues16 found that lower baseline subcortical volumes predicted long-term level of functioning in CHR individuals. Eggins and colleagues41 reported that young people presenting with depressive, manic, and psychotic symptoms had reduced caudate volume relative to healthy controls, and that this was correlated with impaired functioning. A recent multi-center MRI study in 116 CHR individuals also found an association between GMV at baseline and functional outcome.10 However, the relationship found in this study, was with cortical rather than the striatal volume, and was specific to the level of social, as opposed to overall functioning. Finally, studies using other neuroimaging modalities in CHR individuals have previously linked a poor functional outcome to increased prefrontal and striatal activation, to lower thalamic glutamate levels,40 and to altered interactions between hippocampal resting activity and striatal dopamine synthesis capacity.38
Level of functioning is increasingly used as an outcome measure in studies of CHR individuals, as it is clinically meaningful and complements other outcomes such as transition to psychosis and remission, which primarily depend on measurements of symptom severity.42,43 In particular, some individuals who, from a symptomatic perspective, may be categorized as having a relatively good outcome can still have a very low level of overall functioning, which translates into a high level of clinical need.12 However, because it has only been employed as an outcome measure relatively recently, its biological basis in CHR individuals is still poorly understood.
A number of previous MRI studies have reported associations between later transition to psychosis and altered GMV in cortical brain regions, thalamus, hippocampus, and basal ganglia,1,4–7,44–46 while other studies have not found a significant relationship.2,3,37,47 Early MRI studies in CHR groups involved relatively small samples, and the number of individuals in the subgroup that developed psychosis was even smaller. More recent studies have been able to examine larger samples by recruiting from multiple sites. However, the findings have again been inconsistent. One previous multi-center study utilizing a relatively large sample was conducted by Mechelli and colleagues.1 The study assessed n = 182 CHR individuals and reported an association between later transition and reduced parahippocampal volume. Participants were scanned at five sites, with each using a different protocol, and all but one acquiring data at 1.5T which might have led to different findings compared to those reported here. However, more recently, Cannon and colleagues,14 in a study of n = 274 individuals, found no relationship between MRI measures at baseline and later transition. These data were collected at eight sites, all using the same ADNI protocol at 3T.21 It is possible that different acquisitions sequences and scanner manufacturers might have led to different results.48 It is also possible that differences in participant recruitment and hence clinical characteristics of an already very heterogenous population might have led to different results.48 Only a few MRI studies have investigated a relation between GMV and nonremission from the CHR state, showing reduced volumes in frontal, cingulate, temporal cortex,13 in the orbitofrontal cortex, pallidum,17 and CA1,18 while another study, consistent with our present findings, found no significant association.19
In the present study, because the total number of participants was relatively large, and the numbers in the respective outcome subgroups were medium size (ranging 37–192), the absence of significant associations with transition and remission seems unlikely to simply be due to a lack of power. Nevertheless, although our participants all met the same inclusion and exclusion criteria, the CHR state is an intrinsically heterogeneous category.49 While all participants were assessed at presentation, individuals may contact clinical services at different stages of the CHR state. In an effort to reduce and control the heterogeneity within the CHR state, some recent studies modified the standard inclusion criteria, such that samples are enriched for individuals with a particularly high risk of transition.48,50 Because some of the sites in the present study contributed a relatively small number of individuals, we could not model site as factor, but controlled for site variability by increasing the number of covariates of no interest. The latter approach might have reduced the chance of detecting small yet significant effects.
Strengths and Limitations
A methodological strength of the present study is that all sites acquired MRI data using the same ADNI-2 protocol,21 which was specifically designed for multi-center studies. Nevertheless, variability can still arise through the use of scanners that differ in manufacturer, model, and age.51,52 This can be assessed by scanning a group of the same “travelling” volunteers at each site,52,53 with post-hoc calibration methods used to attenuate these effects.48 However, this was not possible in the present study.
A further strength is that we minimized the potentially confounding impact of site differences by restricting the analysis to those sites that had contributed imaging data from at least five CHR individuals. Although this led to the exclusion of one site in the functional (5 individuals excluded) and one site in the remission analyses (2 individuals excluded) (see Supplementary Materials), this approach is likely to have increased the power to detect true statistical effects, and by including a moderate number of covariates have reduced the risk of Type II errors.54–56
During the follow up period, as is typical for CHR individuals, participants received needs-based clinical care involving case management, but in most cases (89.3%) not any active treatment (such as antipsychotic medication). While its content may have varied between sites and individuals, a recent network meta-analysis suggests that there is no evidence that this form of clinical contact significantly alters long term clinical outcomes.57
This study has also a number of limitations. Firstly, GAF was used to measure functioning. While GAF is still widely used in research settings, it has been criticized for its lack of reliability58 and limited ability to meaningfully assess all areas of functioning (as opposed to eg the WHODAS59). To improve reliability within and across EUGEI sites, regular interrater reliability exercises, including key measures such as the CAARMS and the GAF, were carried out before60 and throughout the duration of the study. The GAF reliability score in the final year of the study was 0.83, indicating good reliability (see Table S3). Secondly, in the present study we subdivided groups using GAF scores of >65 and <65 as thresholds following the approach used in previous studies in CHR samples.37,38,40,61 While we acknowledge that GAF could be analyzed as a continuous variable, an advantage of using the cut-off is that it facilitates comparison of our data with those from with other studies that used the same approach. Thirdly, while longitudinal analyses would be helpful to elucidate the trajectories of our outcomes of interest, the high number of missing outcome data at different follow-up time points did not allow for these analyses to be carried out. Missing data, and consequently reduced sample sizes, are particularly problematic when conducting imaging analyses which require modest to large samples. Finally, while multi-center recruitment is necessary to ascertain large samples, this also increases the possible confounding effects of site differences in MRI acquisition and clinical ratings. However, we minimized the latter by using the same scanning protocol,21 and conducting regular interrater reliability exercises both before60 and throughout the duration of the study.
Conclusion
Our findings suggest that in people at CHR for psychosis, relatively reduced right striatal volume is associated with a poor functional outcome. The absence of associations with either symptomatic remission or transition to psychosis, despite a relatively large sample size, raises the possibility that other neuroimaging measures62–65 or peripheral blood markers,66,67 might be better predictors of outcomes in CHR individuals, particularly when these are integrated in multi-modal models.68 We plan to investigate this in further studies in the EU-GEI sample.
Acknowledgments
We would like to thank all participants who took part in the study.
Funding
The European Network of National Schizophrenia Networks Studying Gene-Environment Interactions (EU-GEI) Project is funded by grant agreement HEALTH-F2-2010-241909 (Project EU-GEI) from the European Community Seventh Framework Programme. Additional support was provided by a Medical Research Council Fellowship to M.K. (grant MR/J008915/1). G.M. is supported by a Sir Henry Dale Fellowship, jointly funded by the Wellcome Trust and the Royal Society (202397/Z/16/Z). C.P. was supported by a National Health and Medical Research Council (NHMRC) Senior Principal Research Fellowship (1105825), NHMRC L3 Investigator Grant (1196508). B.N. was supported by an NHMRC Senior Research Fellowship (1137687) and a University of Melbourne Dame Kate Campbell Fellowship. The Melbourne site was supported by NHMRC-EU Grant (ID: 567215). N.B.V. was supported by Ministerio de Ciencia, Innovación e Universidades (PSI2017-87512-C2-1-R).
Conflict of Interest
None.
Appendix
*EU-GEI High Risk Study Group Author
Philip McGuire1,3
Lucia R. Valmaggia20
Maria Calem1
Mathilde Antoniades1
Sara Pisani1
Gemma Modinos1
Lieuwe de Haan17
Mark van der Gaag18,19
Eva Velthorst17
Tamar C. Kraan17
Daniella S. van Dam17
Nadine Burger17
Barnaby Nelson7,8
Patrick McGorry7,8
G Paul Amminger7,8
Christos Pantelis6
Athena Politis7
Joanne Goodall7
Anita Riecher-Rössler9
Stefan Borgwardt9
Erich Studerus9
Rodrigo Bressan23
Ary Gadelha23
Elisa Brietzke23
Graccielle Asevedo23
Elson Asevedo23
Andre Zugman23
Neus Barrantes-Vidal10
Tecelli Domínguez-Martínez10
Anna Racciopi10
Thomas R. Kwapil10
Manel Monsonet10
Lídia Hinojosa10
Mathilde Kazes11
Claire Daban11
Julie Bourgin11
Olivier Gay11
Célia Mam-Lam-Fook11
Marie-Odile Krebs11
Dorte Nordholm12
Lasse Randers12
Kristine Krakauer12
Louise Glenthøj12
Birte Glenthøj12,13
Merete Nordentoft12
Stephan Ruhrmann14
Dominika Gebhard14
Julia Arnhold14
Joachim Klosterkötter14
Gabriele Sachs15
Iris Lasser15
Bernadette Winklbaur15
Harald Aschauer15
Philippe A Delespaul16
Bart P. Rutten16
Jim van Os1,16
23LiNC - Lab Interdisciplinar Neurociências Clínicas, Depto Psiquiatria, Escola Paulista de Medicina, Universidade Federal de São Paulo – UNIFESP.
References
Author notes
These authors equally contributed to this work.
