


Abstract
Euro-area sovereign bond and interbank interest rate spreads spiked in the 2007–2009 Global Financial Crisis and the subsequent European Debt Crisis, substantially elevating financing costs. I use a model-free measure of market liquidity to precisely identify the relative contribution of credit versus liquidity to spreads in these episodes. In the Financial Crisis, liquidity is paramount, accounting for 36% of trough-to-peak widening, after controlling for credit. However, default risk becomes relatively more important to sovereign spreads in the Debt Crisis. Aggregate bond liquidity explains a substantial portion of interbank spreads throughout the sample.
1. Introduction
The 2007–2009 Global Financial Crisis and the European Debt Crisis were marked by extraordinary interest rate spread widening and heightened volatility in asset prices, contributing to a broad tightening of financial conditions. One example is the increase in Euro-area government bond spreads, which rose by more than an order of magnitude in the Financial Crisis, to levels not seen since the introduction of the common currency in 1999. In the money market, spreads between unsecured interbank borrowing rates (EURIBOR) and overnight-indexed swap (OIS) rates of comparable maturities also rose by more than an order of magnitude in the Financial Crisis; EURIBOR-OIS spreads reached their widest levels since the inception of the OIS market, and peaked to an all-time high in October 2008. Spreads generally narrowed in 2010, before widening again in the subsequent Sovereign Debt Crisis. Despite the enormity of these interest rate movements, there has been a lack of consensus on the dominant driver. One hurdle to identification is the difficulty in precisely capturing the risk components in prices. This article documents a model-free measure of Euro-area market liquidity, constructed directly from asset prices. The measure is used to parse these historic movements, and to compare and contrast the spread widening drivers in the two crisis periods. The results show that aggregate market liquidity is an important contributor to euro-area sovereign debt and money market spreads over the entire sample period. However, the importance of liquidity relative to default risk differs by country and over time in a way that is consistent with important credit and liquidity events in asset markets during the Financial and Debt Crises (e.g., the Greek government’s debt restructuring and the central banks’ extraordinary liquidity provision).
In the sovereign bond market, an equal-weighted average across countries and maturities attributes 36% of the trough-to-peak spread widening over the Financial Crisis to deteriorating sovereign bond market liquidity and 22% to heightened default risk (consistent with the finding of Bao, Pan, and Wang, 2011, in the corporate bond market over this period). In contrast, during the subsequent Debt Crisis, default risk becomes a relatively larger driver of average sovereign spread widening. Interbank spreads show a strong role for aggregate bond market liquidity, over and above the effects of interbank credit and liquidity throughout the sample period.
Beyond the expected path of future short-horizon interest rates, it is difficult to empirically determine what drives sovereign bond yields or interbank rates, especially at times of market stress. Two possible influences that are explored in this article are credit, reflecting compensation for heightened default risk (McAndrews, Sarkar, and Wang, 2008; Taylor and Williams, 2009; Beber, Brandt, and Kavajecz, 2009; Afonso, Kovner, and Schoar, 2011; Filipović and Trolle, 2013), and market liquidity, reflecting trading conditions in asset markets (Michaud and Upper, 2008; Acharya and Skeie, 2011). The years after 2007 are an ideal period to study the liquidity and credit components of sovereign and interbank spreads because they were so variable both over time and in the cross section. In contrast, before 2007, these spreads were roughly constant near zero, making identification almost impossible.
Understanding the default and liquidity components in interest rates is important for portfolio allocation and policy decisions. Investors with the longest horizons should prefer to hold higher yielding assets if the elevated yields represent compensation for deteriorating market conditions, but not necessarily if they represent a greater risk of loss due to default. Amihud and Mendelson (1986) and Longstaff (2009) both propose models with different types of investors, in which the longer-horizon investors receive a premium for holding less liquid assets. From the perspective of policymakers, efforts to improve market functioning could help to dampen the effects of poor asset market liquidity on yields, mitigating the knock-on effects of higher financing costs. For example, an exchange of more-liquid for less-liquid bonds (such as in the Federal Reserve’s securities lending facility) could reduce liquidity premia. On the other hand, if higher yields are largely attributable to a credit shock, then this argues for addressing solvency.
This article first documents the tremendous deterioration in euro-area market liquidity during the Global Financial Crisis and the Sovereign Debt Crisis, using the yield differential between two duration-matched bonds with an identical credit guarantee to construct a measure of euro-area market liquidity. This yield spread identifies any deviation in an asset’s price from its hold-to-maturity value, fully capturing market liquidity effects impounded in prices. Specifically, the yield of a German federal government bond is compared to that of its less-liquid agency counterpart, KfW (Kreditanstalt für Wiederaufbau). The German federal government bond systematically commands a premium across maturity points over the sample period. I refer to this yield differential as the K-spread. While this article is the first to construct the K-spread, comparing two types of government-guaranteed securities goes back to Longstaff (2004), who explained the yield differential between Refcorp (Resolution Funding Corporation) and U.S. Treasury bonds as a measure of Treasury market liquidity. In this article, the K-spread is used to identify the contribution of aggregate market liquidity to the unprecedented widening of various interest rate spreads across euro-area countries.
Prior to the Global Financial Crisis, the K-spread typically remained below 10 basis points. During the Crisis, the spread became unusually wide and volatile. At the 5-year maturity, it spiked as high as 90 basis points in December 2008. The spread also widened sharply in the more recent Sovereign Debt Crisis, but remained below its Financial Crisis peak. The K-spread is a model-free identification of euro-area market liquidity—it does not rely on a single interpretation of liquidity frictions. It is also tradable in that an investor can form a portfolio comprised of a long KfW bond position and a corresponding short German federal bond position. This position earns the “liquidity spread” and hedges against credit fluctuations.
This article uses the K-spread and other measures to parse euro-area sovereign bond and interbank interest rate spreads into liquidity and credit components over the Global Financial Crisis and the European Debt crisis. Researchers have proposed theoretical models in which liquidity can have an important effect on bond yields, especially during a crisis (Manganelli and Wolswijk, 2009; Favero, Pagano, and von Thadden, 2010; Acharya and Skeie, 2011). Separately, there is evidence of a common factor driving liquidity premia across markets (Chordia, Sarkar, and Subrahmanyam, 2005; Brunnermeier and Pedersen, 2009). In the decomposition of euro-area sovereign yields spreads, the single K-spread’s identification of liquidity relies on commonality across the different member countries’ sovereign bond markets. The results show a strong and significant influence of aggregate market liquidity on sovereign spreads that is robust to controlling for country-specific default risk. The common liquidity component in spreads also explains more variation than is explained by several extant country-specific liquidity measures jointly. The finding that liquidity is an important driver of bond spreads during the Financial Crisis is familiar in the corporate bond literature (e.g., Bao, Pan, and Wang, 2011; Bongaerts, de Jong, and Driessen, 2017). This article highlights the importance of a single liquidity factor for sovereign bond and interbank spreads during crises.
Brunnermeier and Pedersen (2009) and Bolton, Santos, and Scheinkman (2011), model the relationship between aggregate market liquidity and idiosyncratic funding liquidity to explain market features seen in the early stages of the Financial Crisis. To consider a possible link between aggregate bond market liquidity and money markets, I use the K-spread to decompose unsecured interbank rates, assuming proportionality in bond and funding market liquidity. In order to measure credit and liquidity specific to the interbank market, I obtain a novel dataset of high-frequency interbank transactions. I find that the K-spread, constructed in the sovereign bond market, explains a substantial share of interbank spreads beyond what is captured by the interbank measures of credit and liquidity. Both sovereign and interbank spreads are affected by a common liquidity factor. One possible explanation is the close link between the liquidity of sovereign bonds used as collateral in funding markets and the funding rates themselves.1
The plan for the remainder of the article is as follows. Section 2 introduces the data including the liquidity measure’s construction. Section 3 parses the euro-area sovereign bond yield spreads into liquidity and credit components. Section 4 identifies these two effects in interbank interest rate spreads. Section 5 concludes with the article’s contributions and implications.
2. Data
The sample period for this article is January 1, 2007 through December 31, 2014. This captures the nascent Financial Crisis in the summer of 2007, the height of asset price volatility following Lehman Brothers’ bankruptcy, the broad reversal in asset prices in the spring and summer of 2009, and the subsequent return to extreme price volatility during the European Debt Crisis. This section describes the euro-area sovereign debt and EURIBOR-OIS spreads, and discusses the construction of the various measures of liquidity and credit used in this article.
2.1 Sovereign Bond Yield Spreads
Starting with the sovereign bond market, the data sample includes 77 country-maturity pairs: the government debt securities for 11 euro-area member countries (Austria, Belgium, Finland, France, Germany, Greece, Ireland, Italy, the Netherlands, Portugal, and Spain) at seven specific maturity points (1, 2, 3, 4, 5, 7, and 10 years).2 To precisely compare these yields, I estimate a smoothed zero-coupon yield curve, for each maturity m, each country c, and each day t, by applying the six-parameter model of Svensson (1994) to the prices of all euro-denominated nominal coupon sovereign debt securities. Bond prices are obtained from Bloomberg.3
The European Central Bank (ECB) is responsible for setting a single monetary policy for the euro-area member countries, giving euro-area interest rates a common term structure. Correlations of euro-area sovereign bond yield levels rose around the time of the 1999 monetary union—see Ehrmann et al. (2011)—largely reflecting the common component in rates influenced by the stance of euro-area monetary policy. To difference out this common term structure, I take German bonds as a benchmark.4 Then, I consider the spread of other countries’ sovereign bond yields relative to those of Germany.5
Figure 1 illustrates the movements in sovereign bond yield levels (Panel A) and yield spreads (Panel B), respectively, for the countries in the sample. At the start of the Global Financial Crisis, yield levels mostly declined, but yield spreads widened sharply across countries. After narrowing modestly toward the end of 2009, these spreads widened substantially more during the European Debt Crisis that followed. Higher yields meant that the cost of rolling over existing sovereign debt rose, even in the absence of net new debt issuance. Table 1 gives summary statistics at the 2-, 5-, and 10-year maturities for each country in the sample. Most of the country-maturity yield spreads show a standard deviation over the sample that exceeds the magnitude of the sample-average spread. The onset of this unusual bond market volatility sparked substantial debate; did wider spreads mean that investors were demanding extra compensation amid heightened default likelihood or that market participants were facing increased difficulty in executing transactions?
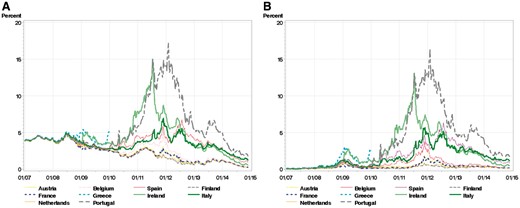
Euro-area government bond market. (A): Country yields, 5-year maturity; (B): Yield spreads (country yields minus German yield), 5-year maturity. This figure shows sovereign bond yield levels (A), and yield spreads relative to Germany (B), for each of the euro-area countries in the sample, at the 5-year maturity. These are based on zero-coupon yields, formed from smoothed curves fitted to all coupon securities, estimated separately for each country, on each day. The sample period is January 1, 2007 through December 31, 2014, except for Greece, which ends on January 1, 2010. The data are shown at the weekly frequency.
Sovereign bond market summary statistics
| Panel A: Country yield spreads and credit and liquidity measures (deviations from Germany) | ||||||||||||||||
|---|---|---|---|---|---|---|---|---|---|---|---|---|---|---|---|---|
| Yield spread | CDS spread | Bid-Ask | Daily Volume | Trade Size | Order Flow | BW Index | Quanto CDS | |||||||||
| (Basis points) | (Basis points) | (Basis points) | (€ million) | (€ million) | (€ million) | (Ratio) | (Basis points) | |||||||||
| Mean | St Dev | Mean | St Dev | Mean | St Dev | Mean | St Dev | Mean | St Dev | Mean | St Dev | Mean | St Dev | Mean | St Dev | |
2-Year Maturity | ||||||||||||||||
| Austria | 19.90 | 23.22 | 19.75 | 26.48 | 0.68 | 1.15 | −20.59 | 63.80 | 0.53 | 4.14 | −8.11 | 297.85 | −0.03 | 0.55 | 6.15 | 9.39 |
| Belgium | 42.34 | 55.45 | 34.79 | 47.88 | 0.44 | 1.18 | −1.26 | 70.57 | 0.80 | 4.17 | −26.09 | 375.34 | −0.18 | 0.52 | 13.58 | 14.89 |
| Spain | 126.35 | 125.22 | 103.54 | 102.17 | 0.58 | 1.24 | −3.83 | 73.31 | −0.17 | 4.54 | −3.98 | 299.49 | −0.05 | 0.75 | 39.43 | 28.23 |
| Finland | 8.17 | 8.68 | 1.39 | 7.21 | 0.08 | 1.20 | −18.91 | 66.07 | 0.06 | 4.27 | −32.95 | 298.35 | 0.00 | 0.58 | −3.28 | 5.79 |
| France | 15.23 | 17.50 | 13.94 | 19.01 | 0.39 | 0.79 | 17.46 | 81.93 | 0.48 | 4.38 | −20.28 | 304.52 | −0.11 | 0.49 | 9.48 | 10.88 |
| Greece | 190.24 | 283.90 | 172.01 | 274.50 | 0.48 | 1.10 | −27.32 | 78.56 | −1.54 | 3.83 | −1.61 | 267.50 | −0.03 | 0.41 | 0.00 | 0.00 |
| Ireland | 204.15 | 280.03 | 215.88 | 283.72 | 0.51 | 1.33 | −24.50 | 63.64 | −1.73 | 4.62 | 44.38 | 261.58 | −0.07 | 0.90 | 27.81 | 23.68 |
| Italy | 123.32 | 121.86 | 102.27 | 106.98 | −0.25 | 0.80 | 310.74 | 240.20 | −2.14 | 3.72 | −15.32 | 331.84 | −0.27 | 0.46 | 26.06 | 17.44 |
| Netherlands | 3.67 | 9.44 | 7.31 | 11.14 | −0.36 | 0.92 | 13.75 | 140.79 | 1.77 | 4.96 | 18.51 | 611.72 | −0.23 | 0.48 | 1.47 | 6.26 |
| Portugal | 333.40 | 427.42 | 320.38 | 445.58 | −0.05 | 1.18 | −7.41 | 71.20 | −0.83 | 4.42 | −20.06 | 364.76 | −0.32 | 0.49 | 37.02 | 31.41 |
5-Year Maturity | ||||||||||||||||
| Austria | 38.19 | 31.76 | 26.56 | 29.79 | 4.81 | 3.70 | −1.78 | 42.35 | 1.78 | 3.94 | −20.63 | 248.16 | 0.08 | 1.43 | 6.14 | 7.11 |
| Belgium | 64.75 | 61.64 | 45.31 | 48.77 | 3.91 | 2.73 | 40.52 | 79.53 | 2.28 | 3.19 | −37.97 | 306.02 | −0.35 | 1.13 | 17.41 | 11.11 |
| Spain | 163.40 | 146.86 | 120.80 | 102.05 | 4.06 | 3.47 | 38.82 | 89.30 | 0.89 | 3.56 | 9.88 | 272.61 | −0.04 | 1.56 | 38.48 | 21.37 |
| Finland | 22.36 | 16.24 | 1.09 | 8.54 | 3.37 | 3.00 | 10.54 | 58.09 | 2.48 | 3.40 | −57.68 | 336.68 | −0.18 | 1.10 | −11.47 | 13.39 |
| France | 32.75 | 30.34 | 22.50 | 22.27 | 3.83 | 2.24 | 40.69 | 84.59 | 1.55 | 3.26 | −6.90 | 245.16 | −0.20 | 1.10 | 15.83 | 11.12 |
| Greece | 197.08 | 263.49 | 161.67 | 224.82 | 2.70 | 2.97 | 4.00 | 50.21 | −0.24 | 2.98 | 10.60 | 185.95 | −0.15 | 1.23 | 0.00 | 0.00 |
| Ireland | 244.75 | 249.38 | 200.15 | 219.85 | 5.39 | 3.86 | −9.33 | 35.34 | −0.44 | 3.59 | −9.44 | 219.18 | 0.55 | 3.48 | 24.03 | 16.05 |
| Italy | 154.79 | 134.29 | 124.46 | 104.64 | 2.56 | 2.65 | 239.20 | 283.73 | −0.70 | 2.72 | −5.07 | 320.85 | −0.45 | 1.03 | 25.83 | 13.71 |
| Netherlands | 27.22 | 17.90 | 9.00 | 11.29 | 1.31 | 2.57 | 71.42 | 273.14 | 3.38 | 3.93 | 78.52 | 846.50 | −0.50 | 0.97 | 0.22 | 8.00 |
| Portugal | 363.40 | 390.42 | 293.36 | 331.60 | 5.25 | 3.69 | 14.76 | 71.52 | 0.53 | 3.20 | −2.96 | 283.63 | −0.45 | 1.00 | 26.56 | 17.55 |
10-Year Maturity | ||||||||||||||||
| Austria | 38.76 | 29.82 | 26.45 | 28.47 | 8.68 | 5.78 | −6.43 | 44.58 | 1.22 | 3.37 | 12.40 | 265.12 | 0.85 | 2.96 | 6.10 | 7.91 |
| Belgium | 68.03 | 54.95 | 45.20 | 42.30 | 5.66 | 6.73 | 24.95 | 78.87 | 2.54 | 3.15 | 11.68 | 392.37 | −0.20 | 2.74 | 17.46 | 8.66 |
| Spain | 170.82 | 144.29 | 118.14 | 89.47 | 8.29 | 6.30 | 5.98 | 65.88 | 0.49 | 3.47 | −9.14 | 279.64 | 1.76 | 4.74 | 34.07 | 19.41 |
| Finland | 22.54 | 15.19 | −0.02 | 9.72 | 3.82 | 6.65 | 16.61 | 59.60 | 3.40 | 3.00 | −113.39 | 410.31 | −0.66 | 2.26 | −16.50 | 15.28 |
| France | 40.27 | 32.88 | 26.29 | 22.95 | 7.37 | 6.86 | 15.87 | 85.65 | 1.06 | 3.70 | 11.20 | 288.61 | 0.48 | 2.87 | 16.93 | 10.61 |
| Greece | 172.38 | 213.25 | 149.62 | 191.31 | 9.79 | 7.37 | −12.07 | 55.17 | −1.10 | 2.89 | 7.09 | 260.92 | 1.39 | 2.70 | 0.00 | 0.00 |
| Ireland | 241.83 | 205.13 | 177.90 | 172.73 | 8.24 | 5.68 | −13.95 | 40.75 | −0.25 | 3.59 | 0.40 | 243.19 | 1.10 | 5.19 | 18.45 | 16.21 |
| Italy | 164.73 | 128.88 | 124.96 | 93.77 | 6.46 | 6.17 | 120.20 | 202.58 | −1.41 | 2.74 | −12.75 | 308.20 | 0.51 | 2.90 | 21.29 | 14.62 |
| Netherlands | 20.77 | 12.17 | 8.94 | 11.59 | 5.39 | 8.51 | 47.18 | 271.52 | 1.83 | 4.76 | 139.04 | 1261.1 | 0.09 | 2.83 | −0.03 | 10.47 |
| Portugal | 325.68 | 314.68 | 257.96 | 258.16 | 6.31 | 6.69 | 7.47 | 64.65 | −0.04 | 2.74 | −28.48 | 323.31 | 0.04 | 2.41 | 257.96 | 258.16 |
Continued
| Panel B: K-Spread and German microstructure liquidity measure statistics and correlation | |||||||
|---|---|---|---|---|---|---|---|
| K-Spread | Correlation with K-Spread | ||||||
| (Basis points) | (Basis points) | ||||||
| Mean | St Dev | Bid-Ask | Daily Volume | Trade Size | Order Flow | BW Index | |
| 2-Year Maturity | 26.02 | 20.43 | 0.50 | −0.13 | −0.05 | 0.06 | 0.15 |
| 5-Year Maturity | 35.80 | 19.73 | 0.75 | −0.18 | −0.04 | −0.06 | 0.36 |
| 10-Year Maturity | 30.35 | 16.14 | 0.33 | −0.17 | −0.30 | 0.14 | 0.23 |
| Panel C: Liquidity and credit measure correlation | ||||||||
|---|---|---|---|---|---|---|---|---|
| K-Spread | Sovereign CDS | Bid-Ask | Daily Volume | Trade Size | Order Flow | BW Index | Quanto CDS | |
2-Year Maturity | ||||||||
| K-Spread | 1.00 | |||||||
| Sovereign CDS | 0.20 | 1.00 | ||||||
| Bid-ask | −0.19 | −0.09 | 1.00 | |||||
| Daily volume | −0.02 | −0.02 | −0.14 | 1.00 | ||||
| Trade size | 0.07 | −0.21 | −0.04 | 0.03 | 1.00 | |||
| Order flow | 0.00 | −0.02 | −0.02 | 0.14 | 0.11 | 1.00 | ||
| BW index | −0.12 | −0.17 | 0.26 | −0.16 | −0.33 | −0.02 | 1.00 | |
| Quanto CDS | 0.38 | 0.68 | −0.08 | 0.03 | −0.12 | −0.02 | −0.12 | 1.00 |
5- Year Maturity | ||||||||
| K-Spread | 1.00 | |||||||
| Sovereign CDS | 0.27 | 1.00 | ||||||
| Bid-ask | −0.15 | 0.17 | 1.00 | |||||
| Daily volume | −0.04 | −0.04 | −0.13 | 1.00 | ||||
| Trade size | −0.01 | −0.25 | −0.12 | 0.14 | 1.00 | |||
| Order flow | 0.04 | 0.00 | −0.03 | 0.36 | 0.14 | 1.00 | ||
| BW index | −0.19 | −0.15 | 0.27 | −0.14 | −0.36 | −0.03 | 1.00 | |
| Quanto CDS | 0.24 | 0.57 | 0.06 | −0.01 | −0.26 | 0.03 | −0.05 | 1.00 |
10-Year Maturity | ||||||||
| K-Spread | 1.00 | |||||||
| Sovereign CDS | 0.33 | 1.00 | ||||||
| Bid-ask | 0.20 | 0.01 | 1.00 | |||||
| Daily volume | −0.04 | −0.05 | −0.18 | 1.00 | ||||
| Trade size | 0.14 | −0.12 | −0.09 | 0.22 | 1.00 | |||
| Order flow | −0.02 | −0.02 | −0.01 | 0.52 | 0.17 | 1.00 | ||
| BW index | −0.07 | −0.04 | 0.33 | −0.16 | −0.38 | −0.02 | 1.00 | |
| Quanto CDS | 0.24 | 0.48 | 0.09 | −0.06 | −0.22 | −0.02 | 0.10 | 1.00 |
This table reports summary statistics for euro-area sovereign bonds, at the 2-, 5-, and 10-year maturities. Panel A reports the mean and standard deviation for sovereign zero-coupon bond yield spreads, CDS spreads, Quanto CDS and microstructure liquidity measures for 10 euro-area countries. Each measure is expressed as the country indicator’s deviation from the German indicator. Panel B reports the K-spread’s mean, standard deviation and its correlation with the microstructure liquidity indicators for Germany. Panel C reports correlations among the K-spread liquidity measure and the other sovereign bond market liquidity and credit indicators that are reported in Panel A. The correlations are run separately for each maturity, using all country data. The K-spread is formed as the KfW agency bond yield minus the German federal government bond yield. The CDS spread is each country’s sovereign debt premium minus German sovereign debt premium. The Quanto CDS measure is each country’s Quanto CDS spread minus the German Quanto CDS spread. The market microstructure liquidity measures are formed using sovereign bond transaction data from the MTS trading platform, as the country measure minus the German measure. All statistics are formed from daily frequency data. The sample period is from January 1, 2007 to December 31, 2014, except that the Greek data ends on January 1, 2010, and the Quanto CDS variable starts on January 1, 2010 for all countries.
2.2 Interbank Interest Rate Spreads
In the money market, I consider euro interbank borrowing rates (EURIBOR). EURIBOR is the reference rate at which large euro-area banks borrow some notional amount of euro currency, uncollateralized, for a specified term.6 EURIBOR contains a common risk-free term structure and risk components. To remove the common component, I consider the spreads of EURIBOR relative to the euro overnight-index swap (OIS) rate, which I take as a proxy for the risk-free rate. An OIS is a money market derivative, with a payoff determined by the future path of overnight interest rates plus a pure term premium. There is no payment required at inception of the contract. For any maturity of OIS contract, the fixed rate reflects a sequence of refreshed overnight bank credits. For these and other reasons,7 default and liquidity premia in OIS rates are negligible (Brunnermeier, 2009; Packer and Baba, 2009), allowing for the EURIBOR-OIS spread to be interpreted as interbank risk premia.
I consider the 1-, 3-, 6-, and 12-month maturity EURIBOR-OIS interest rate spreads, which are the EURIBOR maturities commonly referenced in financial contracts. Panel A of Figure 2 shows a steep decline in the level of EURIBOR rates of roughly 450 basis points across the different maturities over the sample period. This drop was largely driven by the ECB’s crisis-driven monetary policy easing, and thus a lower risk-free rate. During 2008 and 2009, the ECB cut its policy repo rate from 4.25% to 1%. However, Panel B shows a sharp rise in the spread between EURIBOR and OIS rates, first in August 2007, and then most dramatically following Lehman’s Brothers’ bankruptcy in September 2008. In contrast to the all-time high levels that sovereign debt spreads reached during the European Debt Crisis (Figure 1, Panel B), money market spreads peaked during the Global Financial Crisis (Figure 2, Panel B) with the 3- and 6-month EURIBOR-OIS spreads exceeding 150 and 240 basis points, respectively, in the fall of 2008. The unusually steep rise in interbank rates received considerable attention in the press and from policymakers. Higher EURIBOR-OIS spreads worked directly counter to the effect of lower ECB policy rates. Wider spreads mean less accommodative financial conditions ceteris paribus, since many private lending rates are tied to term interbank rates; swap rates, forward rates, interest rate futures, and many mortgage rates in the euro area reference EURIBOR.
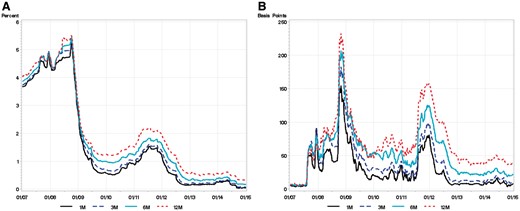
Euro-area money market. This figure shows euro-area interbank money market rate levels (A) and spreads (B) for the 1-, 3-, 6- and 12-month maturities. (A) shows the level of the EURIBOR; (B) shows the EURIBOR-OIS interest rate spread, defined as the EURIBOR minus the comparable-maturity OIS rate. The sample period is January 1, 2007 through December 31, 2014. The data are shown at the weekly frequency.
2.3 The K-Spread Measure of Market Liquidity
Market liquidity is the premium demanded for buying or selling a large quantity of an asset, such as a sovereign bond, with immediacy.8 Measuring this empirically is challenging. To identify the liquidity component of euro-area interest rate spreads, I construct a measure of market liquidity that compares the yields of German government bonds with German agency bonds, at specific maturities. German government bonds are highly liquid euro-area securities, backed by the full faith and credit of the German federal government. Their less-liquid counterparts are bonds issued by the German federal government-owned development bank, KfW, which was founded in 1948 to facilitate post-war reconstruction. A key feature of the KfW agency bonds, which safeguards the liquidity measure against any credit effects, is that the German federal government has an explicit iron-clad guarantee—written into the German constitution—for all of KfW’s current and future obligations, equally and without any difference in priority relative to the federal government bond issues. Credit and asset characteristics are entirely controlled for in the measure’s construction.
Panel A of Figure 3 plots the K-spread at the 5-year maturity. The spread remains positive over the sample, reflecting the relative ease with which the federal government debt is traded as compared to the agency debt. The liquidity yield differential rises to a local peak of 47 basis points early in the sample period, around the collapse of Bear Stearns in March 2008, and then it reaches a global peak of 90 basis points later that year following Lehman Brothers’ bankruptcy. The K-spread widened again during the Sovereign Debt Crisis, not quite reaching the same magnitude as in the Financial Crisis, but remaining elevated for a protracted period. Since the K-spread is constructed from observed bond prices, identification is not limited to any single model of liquidity frictions (e.g., asymmetric information). The K-spread’s evolution reflects all information impounded in bond yields, including forward-looking future liquidity conditions, a potentially large dimension of liquidity not captured by market microstructure or transaction-based measures that are typically used to measure market liquidity.
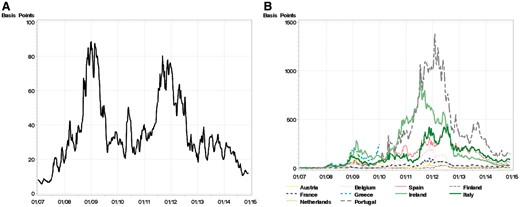
K-liquidity spread and country cds spreads. This figure shows a time series of the 5-year maturity K-spread liquidity measure (A) and the 5-year maturity sovereign CDS spread credit measure (B). The K-spread is constructed as the KfW yield minus the comparable-maturity German federal government yield (both zero-coupon yields, formed from smoothed curves fitted to all coupon securities, estimated separately for each day). The Credit Default Swap (CDS) spreads for the sovereign debt of each of the euro-area countries in the sample are relative to that of Germany. The sample period is January 1, 2007 through December 31, 2014, except for Greece, which ends on January 1, 2010. The data are shown at the weekly frequency.
There are some institutional differences between KfW and German federal government bonds that could contribute to their liquidity differential. Although they share the same creditworthiness, KfW and German federal government bonds are not fungible, even in the absence of any difference in characteristics. For instance, there is an active futures market for German 2-, 5- and 10-year federal government bonds, but the comparable-maturity KfW securities cannot be delivered into these futures contracts.9 Federal government bond issuance is also larger and trading volume is higher than for KfW securities.10 Moreover, euro repo funding rates are consistently slightly higher for KfW collateral than for German federal government collateral, reflecting the relative attractiveness of the federal government securities as collateral in funding markets.11 The financing rate differential could be both a cause and a consequence of their greater liquidity (Brunnermeier and Pedersen, 2009; Gorton and Metrick, 2012).
2.4 Market Microstructure Liquidity Measures
In order to compare the proposed K-spread liquidity measure with traditional liquidity measures, and to allow for market-specific liquidity effects, I obtain detailed data on interbank borrowing and sovereign bond transactions. With these data, I construct a set of five microstructure liquidity measures, separately for the sovereign bond market and the interbank market. The measures are: trade size, trading volume, bid-ask spread, order flow, and the bid-ask spread scaled by trading volume (the liquidity index of Bollen and Whaley, 1998), each of which is expressed as a daily average value.
The sovereign bond transactions come from MTS, a large electronic European bond trading platform.12 To allow for the independent variation of each country’s liquidity at various horizons, I construct a separate microstructure measure for each of the 77 country-maturity pairs. Table 1 reports the country-level summary statistics. The measures are expressed relative to their maturity-matched German counterparts, in parallel with the construction of the yield spreads. For instance, the positive sign on Italian bond trading volume at each maturity point means that a greater quantity of Italian debt is traded each day as compared to German debt, on average over the sample. At the 2-year maturity, the daily average transaction volume in Italian bonds (€311 million in excess of German bonds) is higher than that of any other country’s bonds in the sample. However, the average Italian trade sizes are the smallest of any country; the relatively high Italian trading volume is achieved through a high frequency of small trades.
Interbank borrowing transactions, data which are notoriously opaque and difficult to access, are sourced directly from e-MID, a large electronic euro-area interbank trading platform.13 Euro interbank borrowing is concentrated at the very shortest maturities.14 Because of sparse observations at longer horizons, the interbank microstructure measures are formed with overnight transactions. Table 2 summarizes statistics for the interbank measures. The sample-average interbank bid-ask spread is only 5.1 basis points, shown in Panel B. Transaction volume averages €6.7 billion each day, with an average trade size of €27.3 million over the sample.
Interbank money market summary statistics
| Panel A: Interest rates and spreads | ||||||
|---|---|---|---|---|---|---|
| EURIBOR (Percentage points) | OIS (Percentage points) | EURIBOR-OIS (Basis points) | ||||
| Mean | St Dev | Mean | St Dev | Mean | St Dev | |
| 1-Month Maturity | 1.56 | 1.68 | 1.28 | 1.56 | 28.23 | 27.70 |
| 3-Month Maturity | 1.67 | 1.70 | 1.28 | 1.57 | 38.97 | 33.80 |
| 6-Month Maturity | 1.84 | 1.66 | 1.30 | 1.58 | 53.79 | 37.29 |
| 12-Month Maturity | 2.05 | 1.61 | 1.36 | 1.58 | 68.74 | 41.26 |
| Panel B: Liquidity and credit measures | ||||||||
|---|---|---|---|---|---|---|---|---|
| K-Spread (Basis points) | Bank-Tiering (Basis points) | Bank CDS (Basis points) | Bid-Ask (Basis points) | Daily Volume (€ billion) | Trade Size (€ billion) | Order Flow (€ billion) | BW Index (Ratio) | |
| Mean | 15.52 | 8.55 | 158.47 | 5.13 | 6.66 | 27.26 | −0.42 | 1.17 |
| Standard deviation | 20.09 | 12.60 | 146.64 | 6.34 | 6.61 | 12.56 | 0.29 | 1.36 |
Correlation | ||||||||
| K-Spread | 1.00 | |||||||
| Bank-tiering | 0.53 | 1.00 | ||||||
| Bank CDS | 0.16 | 0.37 | 1.00 | |||||
| Bid-ask | 0.61 | 0.81 | 0.27 | 1.00 | ||||
| Daily volume | 0.09 | −0.09 | −0.46 | 0.01 | 1.00 | |||
| Trade size | 0.08 | −0.10 | −0.32 | −0.04 | 0.85 | 1.00 | ||
| Order flow | −0.35 | −0.18 | 0.23 | −0.27 | −0.41 | −0.16 | 1.00 | |
| BW index | 0.37 | 0.72 | 0.44 | 0.81 | −0.29 | −0.30 | −0.12 | 1.00 |
This table reports summary statistics for euro-area interbank money markets. Panel A gives the mean and standard deviation of the EURIBOR, the OIS rate and the EURIBOR-OIS interest rate spread at 1-, 3-, 6-, and 12-month maturities. Panel B reports the mean and standard deviation for the 1-year maturity K-spread liquidity measure, the overnight bank-tiering credit measure, the overnight interbank market microstructure liquidity measures and the one-year EURIBOR-member bank average CDS premia. Correlations among these indicators are also reported. The K-spread is formed as the KfW agency bond yield minus the same maturity German federal government bond yield. The bank-tiering credit measure is formed as the average unsecured interbank borrowing rate paid by the highest risk quintile of banks minus that of the lowest risk quintile (described in the Appendix) on each day, using transaction data on overnight interbank borrowing from the e-MID electronic interbank trading platform. The market microstructure liquidity measures are also formed as daily averages, using the overnight interbank data from e-MID. The bank CDS measure is the simple average of the EURIBOR panel banks’ one-year CDS premia on each day. The sample period is from January 1, 2007 to December 31, 2014.
2.5 Credit Risk Measures
To identify the credit component in interest rates, I form a new short-horizon measure of interbank credit risk that uses the daily tiering of bank credit that is priced into their borrowing rates, motivated by the default horizon mismatch of credit default swaps (CDS) with interbank spreads (discussed in the next paragraph). The measure is formed by taking the daily difference in the actual borrowing rates of banks with differing creditworthiness. It is constructed with the entire universe of overnight transactions on the e-MID trading platform. The use of this measure assumes that the dispersion and level of credit risk are proportional. This proportionality has been employed by several researchers to explain events in the Financial Crisis. For example, Heider, Hoerova, and Holthausen (2015) model this relationship specifically in interbank markets. Gorton and Ordoñez (2014) use variation in the cross-section of stock returns as a proxy for the level of perceived collateral value. The Appendix describes the proposed bank-tiering measure in detail.
In the sovereign bond market, I consider CDS spreads for each country and maturity in the sample. In the interbank market, I consider the CDS premia for each EURIBOR survey-member bank, as an alternative credit measure to bank-tiering.15 I treat these measures as directly observable credit metrics. The sovereign bond credit measure is defined as the deviation of each country’s CDS spread from the benchmark German CDS spread, on each day for each maturity point, denoted . Measuring interbank credit risk with bank CDS faces the challenge that the EURIBOR-OIS spreads reflect short-horizon risk, while CDS contracts are concentrated at the 5-year maturity. Very short- (or long-) maturity CDS contracts are less likely to be precise measures of default risk, (Pan and Singleton, 2008). To approach the short horizon of the interbank spreads, I use the 1-year CDS premia. Then, I average the CDS premia over the member banks on each day, as in the calculation of EURIBOR.16 All CDS data are obtained from Markit.
Panel B of Figure 3 shows the large rise in sovereign CDS spreads that peaks in the Sovereign Debt Crisis, similar to the sovereign bond spreads shown in Panel B of Figure 1. The interbank credit measures in Figure 4 also both peak in the Debt Crisis. Consistent with the different risk horizons impounded in these measures, the spikes in the bank-tiering measure tend to be steeper and shorter-lived (Panel A) than those of the 1-year bank CDS measure (Panel B).

Money market credit measures. This figure plots the time series of euro-area interbank credit measures. The overnight bank-tiering credit measure (A) is formed as the difference in the average unsecured interbank borrowing rates paid by the banks in the highest and lowest risk quintiles (described in the Appendix) on each day. The bank CDS measure (B) is the simple daily average of the EURIBOR panel banks’ one-year CDS premia. The sample period is January 1, 2007 through December 31, 2014. The data are shown at the weekly frequency.
2.6 Redenomination Risk
Quanto CDS are defined as the spread of a dollar-denominated CDS contract minus the spread of a euro-denominated CDS contract on the same issuer, giving the price of foreign exchange swaps embedded in CDS. To measure redenomination risk in this article, I take each country’s sovereign quanto CDS minus the German sovereign quanto CDS, following De Santis (2015). Panel A of Table 1 shows that the measure is positive for nearly all maturities and countries, consistent with the idea of a premium for protection against risk embedded in the euro currency. Finland and the Netherlands are the exceptions, the two countries with the smallest average CDS spreads. The correlation between quanto CDS and sovereign CDS spreads is 0.68, showing a relatively strong and positive relationship between redenomination and default risk. It makes sense that a higher likelihood of sovereign default increases the likelihood of departure from the currency union.
3. Credit versus Liquidity in Euro-Area Sovereign Bond Spreads
The results of equation (3) are shown in Table 3 at the 2-, 5-, and 10-year maturities. Results are broken out into three samples: the entire sample (Panel A); the period up to the end of 2009, corresponding to the Global Financial Crisis (Panel B); and the period starting in 2010, corresponding to the European Debt crisis (Panel C).17 The full sample results in Panel A show that the pricing of market liquidity conditions is pervasive in euro-area sovereign yields. The coefficient estimates on the K-spread are highly significant and positive for all maturities and countries except Portugal, even controlling for credit. The regression R-squared values from the full-sample estimation show that credit and liquidity jointly explain 44% of the variation in sovereign spreads, averaged over all countries and maturities.
Credit versus liquidity in the sovereign bond market
| Dependent variable: Sovereign yield spread changescmt | |||||||||
|---|---|---|---|---|---|---|---|---|---|
| Regressions onto K-Spread Changesmt and CDS Spread Changescmt | |||||||||
| Panel A: Full sample period (January 1, 2007 to December 31, 2014) | |||||||||
| Austria | Belgium | Finland | France | Ireland | Italy | Netherlands | Portugal | Spain | |
2-Year Maturity | |||||||||
| K-Spread2 | 0.41*** | 0.59*** | 0.29*** | 0.29*** | 1.19*** | 1.10*** | 0.24*** | 1.10*** | 0.71*** |
| (0.07) | (0.13) | (0.04) | (0.06) | (0.43) | (0.21) | (0.05) | (0.56) | (0.19) | |
| CDS Spreadc2 | 0.16*** | 0.67*** | 0.09** | 0.28*** | 1.13*** | 0.66*** | 0.14*** | 0.80*** | 0.81*** |
| (0.03) | (0.04) | (0.04) | (0.03) | (0.04) | (0.03) | (0.04) | (0.03) | (0.03) | |
| R2-adjusted (%) | 0.21 | 0.46 | 0.13 | 0.25 | 0.63 | 0.52 | 0.11 | 0.56 | 0.61 |
5-Year Maturity | |||||||||
| K-Spread5 | 0.61*** | 0.71*** | 0.40*** | 0.57*** | 0.55** | 1.04*** | 0.38*** | 0.55 | 0.65*** |
| (0.06) | (0.09) | (0.04) | (0.06) | (0.25) | (0.16) | (0.04) | (0.34) | (0.14) | |
| CDS Spreadc5 | 0.28*** | 0.76*** | 0.20*** | 0.42*** | 0.91*** | 0.72*** | 0.28*** | 0.93*** | 0.86*** |
| (0.03) | (0.03) | (0.05) | (0.04) | (0.03) | (0.03) | (0.04) | (0.03) | (0.03) | |
| R2-adjusted (%) | 0.40 | 0.63 | 0.19 | 0.42 | 0.66 | 0.61 | 0.32 | 0.66 | 0.70 |
10-Year Maturity | |||||||||
| K-Spread10 | 0.59*** | 0.55*** | 0.30*** | 0.53*** | 0.45** | 0.87*** | 0.25*** | 0.43 | 0.67*** |
| (0.06) | (0.09) | (0.04) | (0.07) | (0.22) | (0.14) | (0.03) | (0.29) | (0.13) | |
| CDS Spreadc10 | 0.27*** | 0.56*** | 0.14*** | 0.35*** | 0.55*** | 0.60*** | 0.18*** | 0.63*** | 0.68*** |
| (0.02) | (0.03) | (0.03) | (0.03) | (0.03) | (0.03) | (0.03) | (0.03) | (0.03) | |
| R2-adjusted (%) | 0.42 | 0.52 | 0.14 | 0.34 | 0.54 | 0.62 | 0.25 | 0.57 | 0.65 |
Continued
| Panel B: Global financial crisis subsample (January 1, 2007 to December 31, 2009) | ||||||||||
|---|---|---|---|---|---|---|---|---|---|---|
| Austria | Belgium | Finland | France | Greece | Ireland | Italy | Netherlands | Portugal | Spain | |
2-Year Maturity | ||||||||||
| K-Spread2 | 0.25*** | 0.38*** | 0.20*** | 0.19*** | 0.78*** | 0.69*** | 0.71*** | 0.27*** | 0.47*** | 0.36*** |
| (0.07) | (0.06) | (0.05) | (0.03) | (0.19) | (0.19) | (0.08) | (0.06) | (0.09) | (0.06) | |
| CDS Spreadc2 | 0.11*** | 0.10*** | 0.07 | 0.01 | 0.63*** | 0.36*** | 0.22*** | 0.05 | 0.23*** | 0.16*** |
| (0.02) | (0.03) | (0.05) | (0.04) | (0.06) | (0.05) | (0.04) | (0.05) | (0.04) | (0.03) | |
| R2-adjusted (%) | 0.25 | 0.27 | 0.11 | 0.16 | 0.52 | 0.30 | 0.46 | 0.12 | 0.23 | 0.32 |
5-Year Maturity | ||||||||||
| K-Spread5 | 0.45*** | 0.46*** | 0.34*** | 0.36*** | 1.16*** | 0.53*** | 0.90*** | 0.39*** | 0.69*** | 0.40*** |
| (0.07) | (0.05) | (0.06) | (0.05) | (0.17) | (0.16) | (0.08) | (0.06) | (0.10) | (0.07) | |
| CDS Spreadc5 | 0.23*** | 0.57*** | 0.39*** | −0.22 | 0.76*** | 0.33*** | 0.35*** | 0.44*** | 0.34*** | 0.35*** |
| (0.03) | (0.06) | (0.11) | (0.14) | (0.05) | (0.04) | (0.05) | (0.06) | (0.07) | (0.05) | |
| R2-adjusted (%) | 0.47 | 0.62 | 0.18 | 0.30 | 0.59 | 0.36 | 0.59 | 0.43 | 0.36 | 0.40 |
10-Year Maturity | ||||||||||
| K-Spread10 | 0.44*** | 0.29*** | 0.34*** | 0.22*** | 0.80*** | 0.24 | 0.59*** | 0.20*** | 0.56*** | 0.28*** |
| (0.07) | (0.08) | (0.05) | (0.05) | (0.18) | (0.20) | (0.12) | (0.06) | (0.12) | (0.09) | |
| CDS Spreadc10 | 0.24*** | 0.44*** | 0.10 | 0.29*** | 0.58*** | 0.32*** | 0.44*** | 0.15*** | 0.43*** | 0.40*** |
| (0.02) | (0.05) | (0.08) | (0.07) | (0.05) | (0.05) | (0.04) | (0.03) | (0.06) | (0.05) | |
| R2-adjusted (%) | 0.52 | 0.39 | 0.22 | 0.09 | 0.48 | 0.30 | 0.37 | 0.22 | 0.32 | 0.37 |
Continued
| Panel C: European debt crisis subsample (January 1, 2010 to December 31, 2014) | |||||||||
|---|---|---|---|---|---|---|---|---|---|
| Austria | Belgium | Finland | France | Ireland | Italy | Netherlands | Portugal | Spain | |
2-Year Maturity | |||||||||
| K-Spread2 | 0.57*** | 0.75*** | 0.38*** | 0.39*** | 1.94*** | 1.69*** | 0.22*** | 1.92* | 1.19*** |
| (0.11) | (0.22) | (0.05) | (0.10) | (0.74) | (0.38) | (0.08) | (1.00) | (0.35) | |
| CDS Spreadc2 | 0.24*** | 0.74*** | 0.08* | 0.31*** | 1.20*** | 0.65*** | 0.19*** | 0.79*** | 0.82*** |
| (0.06) | (0.05) | (0.05) | (0.05) | (0.06) | (0.04) | (0.07) | (0.04) | (0.04) | |
| R2-adjusted (%) | 0.28 | 0.49 | 0.15 | 0.29 | 0.66 | 0.53 | 0.11 | 0.56 | 0.63 |
5-Year Maturity | |||||||||
| K-Spread5 | 0.72*** | 0.99*** | 0.45*** | 0.78*** | 0.75* | 1.20*** | 0.36*** | 0.47 | 0.96*** |
| (0.10) | (0.15) | (0.06) | (0.10) | (0.44) | (0.30) | (0.06) | (0.62) | (0.25) | |
| CDS Spreadc5 | 0.49*** | 0.76*** | 0.16*** | 0.41*** | 0.96*** | 0.74*** | 0.22*** | 0.94*** | 0.88*** |
| (0.04) | (0.04) | (0.05) | (0.05) | (0.04) | (0.04) | (0.05) | (0.04) | (0.04) | |
| R2-adjusted (%) | 0.49 | 0.64 | 0.21 | 0.45 | 0.68 | 0.61 | 0.26 | 0.67 | 0.72 |
10-Year Maturity | |||||||||
| K-Spread10 | 0.70*** | 0.75*** | 0.27*** | 0.78*** | 0.64* | 1.12*** | 0.28*** | 0.33 | 1.01*** |
| (0.09) | (0.14) | (0.05) | (0.11) | (0.34) | (0.23) | (0.04) | (0.48) | (0.22) | |
| CDS Spreadc10 | 0.33*** | 0.56*** | 0.12*** | 0.33*** | 0.57*** | 0.60*** | 0.16*** | 0.64*** | 0.69*** |
| (0.04) | (0.04) | (0.03) | (0.04) | (0.03) | (0.04) | (0.03) | (0.03) | (0.03) | |
| R2-adjusted (%) | 0.42 | 0.54 | 0.09 | 0.38 | 0.56 | 0.64 | 0.27 | 0.58 | 0.67 |
This table reports the coefficient estimates, standard errors and adjusted R-squared values from the seemingly unrelated regression estimation of equation (3), at the 2-, 5-, and 10-year maturities, with all variables in weekly first differences. The dependent variable is changes in the sovereign bond yield spread of each country relative to that of Germany. Panels A through C report the joint estimation of changes in the K-spread and changes in each country’s sovereign CDS spread, for three sample periods. The sample for Panel A is January 1, 2007 through December 31, 2014, Panel B is January 1, 2007 through December 31, 2009 (the Global Financial Crisis), and Panel C is January 1, 2010 through December 31, 2014 (the Sovereign Debt Crisis). The Greek sample ends on January 1, 2010. Newey-West standard errors are in parentheses with the Newey (1994) lag length. *** indicates significance at the 1 percent level, ** at the 5 percent level, and * at the 10 percent level.
CDS spreads differ by country, in contrast to the single K-spread. Theoretical CDS-bond arbitrage arguments (Duffie, 1999) imply that CDS spreads and bond yield spreads should be identical, giving a coefficient of one on CDS for each country-maturity pair. However, in practice, as argued by Longstaff et al. (2011) and others, this theoretical relationship fails to hold because of frictions including transactions costs, tax effects, and the delivery option in fulfillment of the CDS contract in the event of default. Ammer and Cai (2011) argue that the cheapest-to-deliver option makes yield spreads move less than one-for-one with CDS spreads. The coefficients on CDS in Panel A of Table 3 are all highly significant and positive, but they are generally less than 1. As a robustness check, equation (3) is run imposing a coefficient of 1 on the CDS spread, and the results are shown in the Supplementary Appendix.
The estimation results over the Global Financial Crisis (Panel B) and European Debt Crisis (Panel C) are qualitatively similar to those for the full sample period. For most country-maturity pairs, there is again a positive and statistically significant role for liquidity, as measured by the K-spread, and a separate positive and statistically significant role for credit. The point estimates are generally larger for liquidity and credit in Panel C than in the earlier subsample in Panel B. Sovereign spread movements were far larger in the Debt Crisis than in the Financial Crisis (shown in Figure 1, Panel B). CDS spreads also widen much more during the Debt Crisis (shown in Figure 3, Panel B), but even still liquidity plays a meaningful role in this period.
3.1 The K-Spread versus Sovereign CDS Spreads in the Crisis Periods
Within the six months following Lehman’s September 2008 failure, each sovereign spread in the sample widened to its highest level to date, at the time, since the introduction of the euro. What drove the sudden discount demanded by investors to hold these bonds at this time? To understand the relative importance of liquidity versus credit to this episode, I match the yield spread change for each country-maturity pair from January 2007 to January 2009, to the corresponding change in the credit and liquidity measures over the same period. Using the Italian 5-year maturity as an example, the bond yield spread widened from 4 basis points to 128 basis points over this period, while the 5-year K-spread widened by 70 basis points, and the 5-year Italian CDS spread widened by 113 basis points. Next, I calibrate the movements in the credit and liquidity measures to the jointly estimated Financial Crisis-sample coefficients in Panel B of Table 3 to calculate the independent contribution of each measure. The K-spread explains 63 basis points () of the 124 basis point Italian sovereign spread widening, controlling for credit, and the CDS spread explains 40 basis points (), controlling for liquidity. Relating the contribution to the size of the spread increase implies that credit and liquidity contributed 51% and 32%, respectively, to the trough-to-peak Global Financial Crisis-widening of the 5-year Italian bond yield spread.
Figure 5 allows for a comparison of the relative influence of credit and liquidity for each country in the sample. Each symbol in Panel A represents the share of a country’s 2007-to-2009 sovereign yield spread widening that is explained by credit (x-axis) versus liquidity (y-axis), on average over all maturities. For countries that are above the 45 degree line in Figure 5, an illiquidity discount is relatively more important to the post-Lehman blowout in spreads than default. For example, the sovereign spreads of France and Finland are sufficiently unaffected by default risk that they would have remained within historic ranges during the Financial Crisis in the absence of a disruption to market liquidity. Greece and Ireland are the two countries clearly below the 45 degree line, meaning that default risk explains relatively more of the additional yield demanded to hold debt of these countries over the Financial Crisis. Several countries show a substantial influence for both liquidity and credit. An equal-weighted average across all countries and maturities shows that the K-spread explains 36% of the trough-to-peak spread widening and CDS spreads explain 22%. Weighting the shares by the average quantity of debt outstanding for each country and maturity tilts the importance further toward liquidity; liquidity and credit now account for 42% and 18% of yield spread widening, respectively.
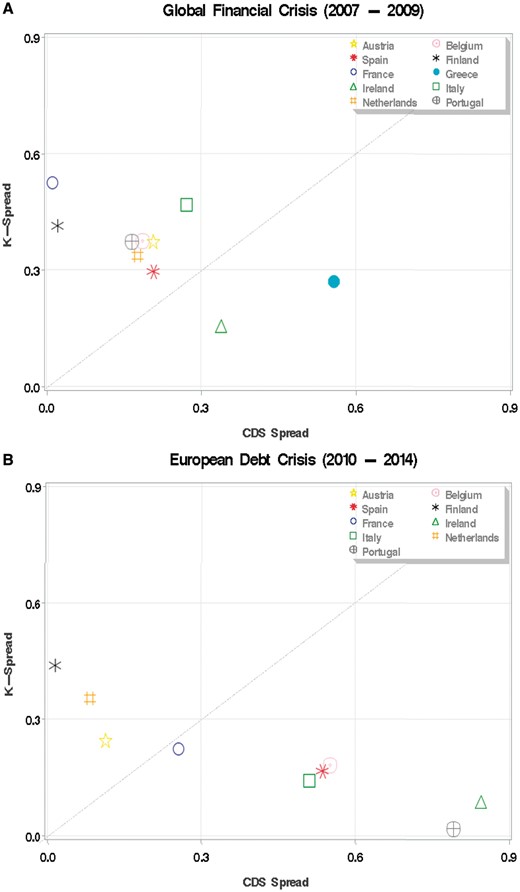
Share of sovereign spread widening explained by credit and liquidity. This figure plots the share of the trough-to-peak yield spread change that is attributable to the K-spread (y-axis) versus the country CDS spread (x-axis), for each country separately, on average over maturities. The plotted values are based on coefficient estimates from a regression of sovereign bond yield spreads onto the K-spread and the country sovereign CDS spreads, shown in Table 3. The figure shows the trough-to-peak yield spread change from January 2007 to January 2009 (A), and the trough-to-peak yield spread change from January 2010 to January 2012 (B). Greek data are only available for the Financial Crisis subsample.
Panel B of Figure 5 gives a similar analysis of the trough-to-peak yield spread widening over the Sovereign Debt Crisis, specifically from January 2010 to January 2012. The relative influence of credit and liquidity are calibrated to the coefficients estimated over the Sovereign Debt Crisis (Table 3, Panel C). In contrast to Panel A, most of the countries in Panel B are below the 45 degree line, indicating a relatively stronger role for credit during the Debt Crisis. Some countries show a substantial increase in the role of default over liquidity; spread widening for Portugal and Ireland is almost completely explained by default risk. On average over countries and maturities, the K-spread explains 21% of the trough-to-peak widening in sovereign bond spreads and CDS spreads explain 41% during the Debt Crisis. Weighting the estimates by each country and maturity’s quantity of debt outstanding leaves the measures little changed at 19% for liquidity and 39% for credit. It makes sense that the default risk is paramount over a period when a CDS credit event is triggered by one of the euro-area member countries.18
3.2 Sensitivity to Credit and Liquidity Shocks
To compare the sensitivity across countries to credit and liquidity shocks of a similar magnitude, I consider the change in the sovereign yield spread associated with a one standard deviation shock to each measure. The effects are calibrated using the full-sample coefficients (Table 3, Panel A) and the bond summary statistics (Table 1, Panel B). Again using the Italian 5-year spread for illustration, a one standard deviation (20 basis point) widening of the K-spread, is associated with a 21 basis point widening () of the Italian bond yield spread.
Figure 6 summarizes each country’s average response across maturities, in basis points, to a one standard deviation widening in CDS spreads (x-axis) and a one standard deviation widening in the K-spread (y-axis). The average liquidity shock effect ranges from 6 to 20 basis points across countries. For a country with a relatively small sovereign spread to start, this magnitude of shock could more than double the size of its yield spread. The effect of a one standard deviation credit shock ranges from having close to no effect for the countries situated along the y-axis (Finland and the Netherlands), to more than 100 basis points of widening for Portugal and Ireland. It seems reasonable that countries closer to the default boundary would be more sensitive to further credit shocks. Portugal and Ireland both received around EUR 80 billion from the EU and the IMF to avoid defaulting during the Sovereign Debt Crisis.
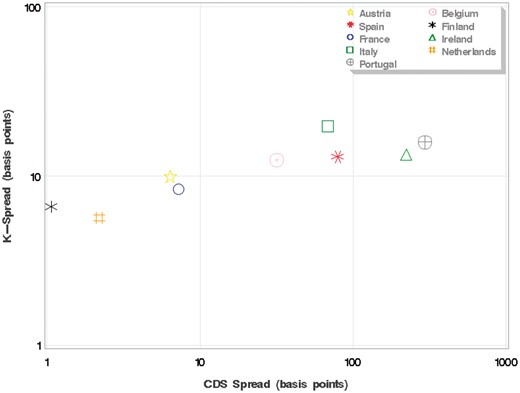
Basis point change in sovereign spread explained by one standard deviation shock to credit and liquidity (full sample period). This figure plots the basis point change in country sovereign bond yield spreads (averaged across maturities) associated with a one standard deviation increase in the country CDS spread (x-axis) versus a one standard deviation increase in the K-spread (y-axis). Both axes are on logarithmic scales. The plotted values are based on coefficient estimates from a regression of sovereign bond yield spreads onto the K-spread and the country sovereign CDS spreads, shown in Panel A of Table 3. The country sovereign CDS spread and the K-spread standard deviations are shown in Panels A and B of Table 1. The sample period covered by the estimation is January 1, 2007 to December 31, 2014.
3.3 Controlling for Redenomination Risk
In Table 4, the results are shown for the European Debt Crisis subsample (January 2010 through December 2014). Before 2010, there was virtually no trading in quanto CDS, and so the measure of redenomination risk is set to zero.
Controlling for redenomination risk in the debt crisis
| Dependent Variable: Sovereign yield spread changescmt | |||||||||
|---|---|---|---|---|---|---|---|---|---|
| Regressions onto K-Spread Changesmt, CDS Spread Changescmt and Quanto CDS Spread Changescmt | |||||||||
| Austria | Belgium | Finland | France | Ireland | Italy | Netherlands | Portugal | Spain | |
2-Year Maturity | |||||||||
| K-Spread2 | 0.40*** | 0.55*** | 0.29*** | 0.27*** | 1.18*** | 1.06*** | 0.24*** | 1.09** | 0.71*** |
| (0.07) | (0.12) | (0.04) | (0.06) | (0.43) | (0.21) | (0.05) | (0.55) | (0.19) | |
| CDS Spreadc2 | 0.17*** | 0.70*** | 0.11** | 0.30*** | 1.11*** | 0.67*** | 0.16*** | 0.78*** | 0.80*** |
| (0.03) | (0.04) | (0.04) | (0.03) | (0.04) | (0.03) | (0.05) | (0.03) | (0.03) | |
| Quanto CDS Spread c2 | 0.24*** | 0.27** | 0.05 | 0.30*** | 1.02*** | 0.41** | 0.10 | 0.56*** | 0.59*** |
| (0.07) | (0.11) | (0.06) | (0.06) | (0.23) | (0.19) | (0.06) | (0.13) | (0.15) | |
| R2-adjusted (%) | 0.23 | 0.47 | 0.13 | 0.30 | 0.63 | 0.53 | 0.10 | 0.57 | 0.62 |
5-Year Maturity | |||||||||
| K-Spread5 | 0.61*** | 0.67*** | 0.40*** | 0.53*** | 0.59** | 1.02*** | 0.37*** | 0.64* | 0.67*** |
| (0.06) | (0.09) | (0.04) | (0.06) | (0.25) | (0.16) | (0.04) | (0.34) | (0.13) | |
| CDS Spreadc5 | 0.31*** | 0.81*** | 0.23*** | 0.50*** | 0.88*** | 0.72*** | 0.30*** | 0.90*** | 0.84*** |
| (0.03) | (0.03) | (0.06) | (0.04) | (0.03) | (0.03) | (0.04) | (0.03) | (0.03) | |
| Quanto CDS Spread c5 | 0.43*** | 0.40*** | 0.08 | 0.44*** | 1.07*** | 0.75*** | 0.07 | 0.71*** | 0.84*** |
| (0.09) | (0.10) | (0.07) | (0.06) | (0.24) | (0.21) | (0.07) | (0.22) | (0.14) | |
| R2-adjusted (%) | 0.43 | 0.65 | 0.19 | 0.49 | 0.67 | 0.62 | 0.32 | 0.67 | 0.72 |
10-Year Maturity | |||||||||
| K-Spread10 | 0.60*** | 0.50*** | 0.30*** | 0.52*** | 0.43** | 0.82*** | 0.25*** | 0.56** | 0.62*** |
| (0.06) | (0.09) | (0.04) | (0.06) | (0.21) | (0.14) | (0.03) | (0.27) | (0.13) | |
| CDS Spreadc10 | 0.29*** | 0.62*** | 0.18*** | 0.41*** | 0.53*** | 0.61*** | 0.20*** | 0.60*** | 0.69*** |
| (0.02) | (0.03) | (0.05) | (0.04) | (0.03) | (0.03) | (0.03) | (0.03) | (0.03) | |
| Quanto CDS Spread c10 | 0.27*** | 0.41*** | 0.09 | 0.25*** | 0.63*** | 0.62*** | 0.06 | 1.03*** | 0.61*** |
| (0.06) | (0.07) | (0.05) | (0.05) | (0.14) | (0.13) | (0.04) | (0.15) | (0.11) | |
| R2-adjusted (%) | 0.45 | 0.55 | 0.13 | 0.40 | 0.56 | 0.63 | 0.25 | 0.61 | 0.67 |
This table reports the coefficient estimates, standard errors and adjusted R-squared values from the seemingly unrelated regression estimation of equation (4), at the 2-, 5-, and 10-year maturities, with all variables in weekly first differences. The dependent variable is changes in the sovereign bond yield spread of each country relative to that of Germany. Panels A through C report the joint estimation of changes in the K-spread, changes in each country’s sovereign CDS spread, and changes in the Quanto CDS measure of redenomination risk. The equation is estimated over the sample period from January 1, 2010 to December 31, 2014. Newey-West standard errors are in parentheses with the Newey (1994) lag length. *** indicates significance at the 1 percent level, ** at the 5 percent level, and * at the 10 percent level.
The average adjusted R-squared values over all countries and maturities when including redenomination risk in the estimation rises to 47% compared to 45% without.19 The 10-year maturity contributes most to the increase in explained spread variation, suggesting that redenomination risk is most prevalent at a longer horizon. Of course, not all sovereigns are subject to the same level of redenomination risk. The quanto CDS coefficient estimates from equation (4) show that the Netherlands and Finland have virtually no priced redenomination risk, once controlling for credit and liquidity. There is a high degree of correlation between the measures of redenomination risk and default risk (Table 1, Panel C), and these two countries show the smallest effect of credit on yield spreads (subsection 3.2).
The positive correlation between the quanto CDS and sovereign CDS measures also suggests that the role for credit might be overestimated in countries with redenomination risk in the baseline specification. Comparing the significance and magnitude of the coefficient estimates from equation (4) with those in Panel C of Table 3, where quanto CDS spreads are not included, there is no systematic change across countries and maturities. The effect of redenomination risk on spreads is distinct from that of liquidity or credit, though its contribution is smaller.
3.4 Controlling for Country-Specific Liquidity
Table 5 shows the expanded regression results. No single microstructure measure is significant across countries, and the estimates are unstable in sign. However, the CDS and K-spread estimates remain highly significant and close to their values in the bivariate case (Table 3, Panel A). A comparison of the R-squared values for the different specifications shows little incremental benefit to adding the microstructure measures. Averaged across countries and maturities, the adjusted R-squared is slightly lower when the five microstructure liquidity measures are included compared to the case with only sovereign CDS, the K-spread and Quantos CDS as explanatory variables.
All measures of credit and liquidity
| Dependent variable: Sovereign yield spread changescmt | |||||||||
|---|---|---|---|---|---|---|---|---|---|
| Regressions onto K-Spread Changesmt, CDS Spread Changescmt, Quanto CDS Spread Changescmt and Microstructure Liquidity Measurescmt | |||||||||
| Austria | Belgium | Finland | France | Ireland | Italy | Netherlands | Portugal | Spain | |
2-Year Maturity | |||||||||
| K-Spread2 | 0.40*** | 0.54*** | 0.29*** | 0.28*** | 1.16*** | 1.04*** | 0.24*** | 1.16** | 0.70*** |
| (0.07) | (0.13) | (0.04) | (0.06) | (0.43) | (0.21) | (0.05) | (0.55) | (0.19) | |
| CDS Spreadc2 | 0.17*** | 0.70*** | 0.11** | 0.31*** | 1.12*** | 0.67*** | 0.15*** | 0.77*** | 0.80*** |
| (0.03) | (0.04) | (0.04) | (0.03) | (0.04) | (0.04) | (0.05) | (0.03) | (0.03) | |
| Bid-Ask Spreadc2 | 0.00 | −0.42 | 0.08 | −0.57** | 1.06 | 0.75 | −0.25 | 2.31 | −0.07 |
| (0.30) | (0.50) | (0.21) | (0.28) | (3.18) | (1.35) | (0.33) | (3.51) | (0.64) | |
| BW indexc2 | 0.14* | −0.03 | −0.10** | 0.04 | −0.34 | −0.29 | 0.06 | −0.15 | −0.04 |
| (0.09) | (0.11) | (0.05) | (0.06) | (0.35) | (0.32) | (0.08) | (0.94) | (0.11) | |
| Order flowc2 | 0.02 | 0.00 | 0.00 | 0.00 | −0.17 | −0.01 | 0.00 | 0.01 | −0.01 |
| 0.01 | 0.01 | 0.01 | 0.01 | 0.12 | 0.02 | 0.01 | 0.06 | 0.02 | |
| Daily volumec2 | −2.73 | −8.11 | −12.07* | 3.10 | 134.32 | 1.11 | 4.48* | 5.40 | −2.84 |
| (9.69) | (8.28) | (6.39) | (2.65) | (126.08) | (3.18) | (2.49) | (40.53) | (12.72) | |
| Trade sizec2 | 0.19 | 0.16 | 0.01 | 0.10 | −2.23** | −0.61 | −0.03 | −1.49 | −0.13 |
| (0.13) | (0.15) | (0.07) | (0.07) | (1.10) | (0.67) | (0.07) | (1.29) | (0.22) | |
| Quanto CDS Spreadc2 | 0.24*** | 0.28*** | 0.06 | 0.30*** | 1.01*** | 0.44** | 0.10 | 0.56*** | 0.60*** |
| (0.07) | (0.11) | (0.06) | (0.06) | (0.23) | (0.19) | (0.06) | (0.13) | (0.15) | |
| R2-adjusted (%) | 0.23 | 0.46 | 0.14 | 0.30 | 0.63 | 0.53 | 0.11 | 0.57 | 0.62 |
5-Year Maturity | |||||||||
| K-Spread5 | 0.61*** | 0.68*** | 0.40*** | 0.54*** | 0.59** | 0.92*** | 0.35*** | 0.62* | 0.68*** |
| (0.06) | (0.09) | (0.04) | (0.05) | (0.25) | (0.16) | (0.04) | (0.34) | (0.13) | |
| CDS Spreadc5 | 0.30*** | 0.79*** | 0.22*** | 0.47*** | 0.88*** | 0.73*** | 0.31*** | 0.90*** | 0.83*** |
| (0.03) | (0.03) | (0.06) | (0.04) | (0.03) | (0.03) | (0.04) | (0.03) | (0.03) | |
| Bid-Ask Spreadc5 | −0.12 | −0.08 | 0.03 | −0.32** | 0.15 | 1.56*** | 0.15 | 0.62 | −0.16 |
| (0.10) | (0.17) | (0.08) | (0.13) | (0.68) | (0.46) | (0.10) | (1.07) | (0.26) | |
| BW indexc5 | 0.01 | 0.01 | −0.04** | −0.01 | 0.01 | −0.25** | −0.01 | 0.16 | 0.00 |
| (0.02) | (0.04) | (0.02) | (0.03) | (0.05) | (0.11) | (0.03) | (0.35) | (0.04) | |
| Order flowc5 | 0.00 | 0.00 | 0.00 | 0.00 | 0.03 | 0.01 | −0.01*** | −0.02 | −0.02 |
| 0.01 | 0.01 | 0.00 | 0.01 | 0.07 | 0.02 | 0.00 | 0.05 | 0.02 | |
| Daily volumec5 | 5.37 | 7.14 | 0.30 | 11.21*** | 27.95 | 2.11 | 4.77*** | −2.56 | −0.96 |
| (6.58) | (4.79) | (2.86) | (2.73) | (60.88) | (2.28) | (1.35) | (26.26) | (6.05) | |
| Trade sizec5 | 0.10 | 0.15 | −0.14** | −0.12 | 0.67 | −1.99*** | −0.03 | 0.04 | −0.23 |
| (0.07) | (0.17) | (0.06) | (0.09) | (0.56) | (0.58) | (0.07) | (0.95) | (0.22) | |
| Quanto CDS Spreadc5 | 0.45*** | 0.38*** | 0.08 | 0.42*** | 1.07*** | 0.70*** | 0.08 | 0.71*** | 0.84*** |
| (0.10) | (0.10) | (0.07) | (0.06) | (0.24) | (0.20) | (0.07) | (0.22) | (0.14) | |
| R2-adjusted (%) | 0.43 | 0.64 | 0.20 | 0.51 | 0.66 | 0.63 | 0.34 | 0.66 | 0.72 |
10-Year Maturity | |||||||||
| K-Spread5 | 0.60*** | 0.52*** | 0.30*** | 0.51*** | 0.44** | 0.86*** | 0.25*** | 0.56** | 0.63*** |
| (0.06) | (0.09) | (0.04) | (0.06) | (0.21) | (0.14) | (0.03) | (0.28) | (0.13) | |
| CDS Spreadc5 | 0.30*** | 0.63*** | 0.19*** | 0.42*** | 0.53*** | 0.61*** | 0.20*** | 0.61*** | 0.69*** |
| (0.02) | (0.03) | (0.05) | (0.04) | (0.03) | (0.03) | (0.03) | (0.03) | (0.03) | |
| Bid-Ask Spreadc5 | 0.06 | −0.15 | 0.06 | −0.04 | 0.15 | −0.16 | −0.04 | 0.06 | −0.25** |
| (0.05) | (0.11) | (0.06) | (0.07) | (0.33) | (0.16) | (0.04) | (0.36) | (0.12) | |
| BW indexc5 | −0.01 | 0.01 | −0.03 | −0.01 | −0.01 | −0.04* | 0.00 | −0.02 | 0.00 |
| (0.01) | (0.02) | (0.02) | (0.01) | (0.02) | (0.02) | (0.01) | (0.08) | (0.01) | |
| Order flowc5 | −0.02** | −0.01 | 0.00 | 0.00 | −0.03 | 0.00 | 0.00 | 0.03 | 0.00 |
| 0.01 | 0.01 | 0.00 | 0.01 | 0.06 | 0.02 | 0.00 | 0.05 | 0.02 | |
| Daily volumec5 | −3.67 | 1.02 | −2.95 | 6.98** | −23.09 | −1.11 | 0.25 | −8.84 | −8.07 |
| (5.23) | (4.50) | (2.74) | (2.89) | (41.23) | (2.64) | (1.07) | (27.38) | (10.50) | |
| Trade sizec5 | −0.08 | −0.22 | 0.02 | −0.14 | −0.18 | 0.66 | −0.05 | 0.29 | 0.03 |
| (0.08) | (0.18) | (0.10) | (0.10) | (0.38) | (0.54) | (0.05) | (0.87) | (0.24) | |
| Quanto CDS Spreadc5 | 0.27*** | 0.42*** | 0.08 | 0.27*** | 0.65*** | 0.61*** | 0.07* | 1.00*** | 0.63*** |
| (0.07) | (0.08) | (0.06) | (0.06) | (0.14) | (0.13) | (0.04) | (0.15) | (0.11) | |
| R2-adjusted (%) | 0.46 | 0.56 | 0.13 | 0.41 | 0.55 | 0.64 | 0.25 | 0.60 | 0.67 |
This table reports the coefficient estimates, standard errors and adjusted R-squared values from the seemingly unrelated regression estimation of equation (5), at the 2-, 5-, and 10-year maturities, with all variables in weekly first differences. The dependent variable is changes in the sovereign bond yield spread of each country relative to that of Germany. The regression is a joint estimation on changes in the K-spread, changes in each country’s sovereign CDS spread, changes in five country-specific microstructure liquidity measures, and changes in the Quanto CDS measure of redenomination risk. The equation is estimated over the sample period from January 1, 2007 to December 31, 2014, except that the Quanto CDS sample begins on January 1, 2010. Newey-West standard errors are in parentheses with the Newey (1994) lag length. *** indicates significance at the 1 percent level, ** at the 5 percent level, and * at the 10 percent level.
The relatively small role for microstructure measures of liquidity is consistent with Beber, Brandt, and Kavajecz (2009), who found that credit (also measured with sovereign CDS spreads) was far more important than microstructure liquidity variables for euro-area sovereign yields over 2003 and 2004. Despite the empirical advantage of the microstructure measures in relating distinctly to each country’s sovereign bond yield spreads, the K-spread remains paramount in explaining the liquidity component in sovereign spreads. The nature of the liquidity effect captured by the K-spread could represent liquidity problems that are not well measured by microstructure measures such as the pricing of liquidity risk—a premium demanded by investors for holding securities that might become less liquid in a high marginal-utility state of the world (Acharya and Pedersen, 2005; Dow, 2004; Musto, Nini, and Schwarz, 2018).
4. The Role of Aggregate Bond Market Liquidity in Euro-Area Interbank Spreads
The models of Brunnermeier and Pedersen (2009) and Bolton, Santos and Scheinkman (2011) describe a close relationship between bond and funding markets. This section empirically assesses the effect of aggregate bond liquidity in the funding market by using the K-spread to parse interbank rates.
4.1 Aggregate Bond Market Liquidity and Bank-Tiering Credit in Interbank Interest Rates
Table 6 shows the estimation results for equation (6) at each of the four maturity points. Results are broken out into the same three samples as in the sovereign bond analysis and shown in three separate panels: the entire sample period from 2007 to 2014 (Panel A); the Global Financial Crisis from 2007 to 2009 (Panel B); and the European Debt crisis from 2010 to 2014 (Panel C). Within each panel, results for the four maturities are shown in four separate subpanels.
Credit versus liquidity in the interbank money market
| Dependent Variable: EURIBOR-OIS spread changesmt | ||||||||||||||
|---|---|---|---|---|---|---|---|---|---|---|---|---|---|---|
| Regressions onto Changes in the K-Spreadt, Bank Tiering Credit Measurer, CDS Spreadt, and Microstructure Liquidity Measurest | ||||||||||||||
| Panel A: Full Sample Period (January 1, 2007 to December 31, 2014) | ||||||||||||||
1-Month Maturity | 3-Month Maturity | |||||||||||||
| K-Spread | 0.80*** | 0.74*** | 0.78*** | 0.76*** | 0.80*** | 0.73*** | 0.76*** | 0.74*** | ||||||
| (0.13) | (0.10) | (0.10) | (0.11) | (0.13) | (0.10) | (0.10) | (0.10) | |||||||
| Bank-tiering credit measure | 0.29** | 0.16*** | 0.16*** | 0.09** | 0.18* | 0.33** | 0.20** | 0.20** | 0.12** | 0.21* | ||||
| (0.13) | (0.06) | (0.06) | (0.04) | (0.10) | (0.15) | (0.08) | (0.08) | (0.05) | (0.11) | |||||
| Bank CDS Premia | 0.03** | −0.02* | −0.02* | 0.01 | 0.03*** | −0.02 | −0.02 | 0.02* | ||||||
| (0.01) | (0.01) | (0.01) | (0.01) | (0.01) | (0.01) | (0.01) | (0.01) | |||||||
| Bid-Ask Spread | 29.58 | 42.45 | 34.29 | 46.82 | ||||||||||
| (22.64) | (27.92) | (25.08) | (30.67) | |||||||||||
| Daily volume | −0.06 | −0.12 | −0.09 | −0.15 | ||||||||||
| (0.11) | (0.16) | (0.13) | (0.18) | |||||||||||
| Trade size | 0.06 | 0.06 | 0.07 | 0.08 | ||||||||||
| (0.05) | (0.05) | (0.05) | (0.05) | |||||||||||
| Order flow | −0.31 | −0.84 | −0.11 | −0.66 | ||||||||||
| (1.19) | (1.11) | (1.23) | (1.14) | |||||||||||
| BW index | −36.55 | −65.79 | −47.27 | −75.56 | ||||||||||
| (57.13) | (68.31) | (61.42) | (73.58) | |||||||||||
| R2-adjusted (%) | 27.50 | 6.54 | 0.52 | 29.19 | 29.62 | 30.18 | 7.99 | 27.82 | 8.33 | 0.86 | 30.52 | 30.73 | 31.79 | 10.56 |
6-Month Maturity | 12-Month Maturity | |||||||||||||
| K-Spread | 0.80*** | 0.74*** | 0.75*** | 0.74*** | 0.92*** | 0.86*** | 0.86*** | 0.84*** | ||||||
| (0.12) | (0.09) | (0.09) | (0.10) | (0.13) | (0.10) | (0.11) | (0.11) | |||||||
| Bank-tiering credit measure | 0.32** | 0.18** | 0.19** | 0.10* | 0.18* | 0.35** | 0.19** | 0.20** | 0.10 | 0.20 | ||||
| (0.16) | (0.09) | (0.09) | (0.06) | (0.11) | (0.18) | (0.10) | (0.10) | (0.07) | (0.12) | |||||
| Bank CDS Premia | 0.04*** | −0.01 | −0.01 | 0.03** | 0.05*** | 0.00 | 0.00 | 0.04*** | ||||||
| (0.01) | (0.01) | (0.01) | (0.01) | (0.01) | (0.01) | (0.02) | (0.01) | |||||||
| Bid-ask spread | 40.49 | 52.81 | 45.20 | 59.12* | ||||||||||
| (28.75) | (34.10) | (28.48) | (35.03) | |||||||||||
| Daily volume | −0.05 | −0.11 | −0.02 | −0.09 | ||||||||||
| (0.13) | (0.18) | (0.16) | (0.21) | |||||||||||
| Trade size | 0.06 | 0.07 | 0.06 | 0.07 | ||||||||||
| (0.05) | (0.06) | (0.06) | (0.06) | |||||||||||
| Order flow | −0.08 | −0.66 | −0.08 | −0.80 | ||||||||||
| (1.26) | (1.18) | (1.41) | (1.28) | |||||||||||
| BW index | −68.87 | −96.03 | −86.37 | −116.37 | ||||||||||
| (69.89) | (81.85) | (71.63) | (86.48) | |||||||||||
| R2-adjusted (%) | 26.29 | 7.31 | 1.40 | 28.49 | 28.42 | 29.79 | 10.31 | 28.26 | 7.19 | 2.15 | 30.26 | 30.09 | 31.40 | 10.71 |
Continued
| Dependent Variable: EURIBOR-OIS spread changesmt | ||||||||||||||
|---|---|---|---|---|---|---|---|---|---|---|---|---|---|---|
| Regressions onto Changes in the K-Spreadt, Bank Tiering Credit Measurer, CDS Spreadt, and Microstructure Liquidity Measurest | ||||||||||||||
| Panel B: Global financial crisis sub-sample (January 1, 2007 to December 31, 2009) | ||||||||||||||
1-Month Maturity | 3-Month Maturity | |||||||||||||
| K-Spread | 1.10*** | 0.99*** | 1.03*** | 1.06*** | 1.07*** | 0.92*** | 0.95*** | 0.98*** | ||||||
| (0.10) | (0.13) | (0.13) | (0.13) | (0.10) | (0.15) | (0.15) | (0.15) | |||||||
| Bank-tiering credit measure | 0.67*** | 0.28** | 0.30** | 0.15 | 0.62*** | 0.74*** | 0.38** | 0.40** | 0.29** | 0.73*** | ||||
| (0.22) | (0.12) | (0.13) | (0.13) | (0.23) | (0.25) | (0.15) | (0.16) | (0.14) | (0.26) | |||||
| Bank CDS Premia | 0.12* | −0.08 | −0.11 | 0.04 | 0.12 | −0.07 | −0.09 | 0.04 | ||||||
| (0.07) | (0.08) | (0.08) | (0.08) | (0.09) | (0.08) | (0.08) | (0.09) | |||||||
| Bid-ask spread | 29.65 | 16.75 | 25.80 | 13.86 | ||||||||||
| (37.07) | (34.77) | (36.78) | (35.56) | |||||||||||
| Daily volume | −0.11 | −0.05 | −0.16 | −0.11 | ||||||||||
| (0.17) | (0.18) | (0.18) | (0.19) | |||||||||||
| Trade size | 0.13 | 0.09 | 0.18 | 0.14 | ||||||||||
| (0.12) | (0.13) | (0.13) | (0.14) | |||||||||||
| Order flow | −2.80 | −0.58 | −1.04 | 1.01 | ||||||||||
| (5.15) | (5.19) | (5.51) | (5.54) | |||||||||||
| BW index | 7.67 | −64.76 | −1.71 | −68.76 | ||||||||||
| (159.99) | (168.89) | (165.06) | (172.58) | |||||||||||
| R2-adjusted (%) | 38.31 | 13.79 | 0.75 | 40.07 | 40.25 | 39.88 | 11.05 | 36.41 | 17.30 | 0.89 | 40.05 | 40.16 | 39.83 | 15.08 |
6-Month Maturity | 12-Month Maturity | |||||||||||||
| K-Spread | 1.03*** | 0.88*** | 0.89*** | 0.91*** | 1.14*** | 0.97*** | 0.97*** | 0.99*** | ||||||
| (0.10) | (0.15) | (0.16) | (0.16) | (0.12) | (0.15) | (0.16) | (0.16) | |||||||
| Bank-tiering credit measure | 0.73*** | 0.39** | 0.40** | 0.32** | 0.73*** | 0.81*** | 0.43*** | 0.43** | 0.34** | 0.79*** | ||||
| (0.26) | (0.17) | (0.17) | (0.15) | (0.26) | (0.28) | (0.17) | (0.17) | (0.17) | (0.28) | |||||
| Bank CDS Premia | 0.15 | −0.04 | −0.05 | 0.07 | 0.21 | 0.00 | −0.01 | 0.12 | ||||||
| (0.10) | (0.08) | (0.09) | (0.10) | (0.11) | (0.10) | (0.10) | (0.11) | |||||||
| Bid-ask spread | 30.10 | 18.99 | 29.01 | 16.94 | ||||||||||
| (40.18) | (38.19) | (38.82) | (36.52) | |||||||||||
| Daily volume | −0.13 | −0.08 | −0.09 | −0.03 | ||||||||||
| (0.17) | (0.19) | (0.23) | (0.26) | |||||||||||
| Trade size | 0.16 | 0.12 | 0.14 | 0.10 | ||||||||||
| (0.13) | (0.14) | (0.13) | (0.15) | |||||||||||
| Order flow | 0.08 | 1.99 | 0.11 | 2.19 | ||||||||||
| (5.74) | (5.77) | (5.79) | (5.79) | |||||||||||
| BW index | −79.47 | −141.88 | −60.39 | −128.19 | ||||||||||
| (190.74) | (191.06) | (200.98) | (201.71) | |||||||||||
| R2-adjusted (%) | 32.64 | 16.41 | 1.49 | 36.33 | 36.06 | 35.58 | 14.82 | 34.63 | 17.26 | 3.04 | 38.50 | 38.09 | 37.24 | 16.06 |
Continued
| Dependent Variable: EURIBOR-OIS spread changesmt | ||||||||||||||
|---|---|---|---|---|---|---|---|---|---|---|---|---|---|---|
| Regressions onto Changes in the K-Spreadt, Bank Tiering Credit Measurer, CDS Spreadt, and Microstructure Liquidity Measurest | ||||||||||||||
| Panel C: European debt crisis sub-sample (January 1, 2010 to December 31, 2014) | ||||||||||||||
1-Month Maturity | 3-Month Maturity | |||||||||||||
| K-Spread | 0.32*** | 0.30*** | 0.29*** | 0.27*** | 0.36*** | 0.34*** | 0.33*** | 0.29*** | ||||||
| (0.06) | (0.06) | (0.07) | (0.06) | (0.07) | (0.07) | (0.07) | (0.07) | |||||||
| Bank-tiering credit measure | 0.11*** | 0.08** | 0.08** | 0.04 | 0.04 | 0.11*** | 0.09** | 0.09** | 0.03 | 0.03 | ||||
| (0.04) | (0.04) | (0.03) | (0.04) | (0.05) | (0.04) | (0.04) | (0.03) | (0.04) | (0.06) | |||||
| Bank CDS Premia | 0.02* | 0.00 | 0.00 | 0.01* | 0.02*** | 0.01 | 0.01 | 0.02** | ||||||
| (0.01) | (0.01) | (0.01) | (0.01) | (0.01) | (0.01) | (0.01) | (0.01) | |||||||
| Bid-ask spread | 20.42 | 27.34 | 34.41* | 41.65** | ||||||||||
| (18.18) | (18.60) | (18.90) | (20.14) | |||||||||||
| Daily volume | −0.20 | −0.21 | −0.25 | −0.25 | ||||||||||
| (0.28) | (0.28) | (0.23) | (0.23) | |||||||||||
| Trade size | 0.07* | 0.07* | 0.06* | 0.06* | ||||||||||
| (0.04) | (0.04) | (0.03) | (0.03) | |||||||||||
| Order flow | −0.21 | −0.45 | −0.06 | −0.39 | ||||||||||
| (0.71) | (706.14) | (0.71) | (0.68) | |||||||||||
| BW index | −7.58 | −16.99 | −39.17 | −47.95 | ||||||||||
| (35.28) | (33.58) | (35.50) | (35.80) | |||||||||||
| R2-adjusted (%) | 10.14 | 2.73 | 1.90 | 11.65 | 11.32 | 12.51 | 6.65 | 14.11 | 3.89 | 3.46 | 16.33 | 16.15 | 18.94 | 11.32 |
6-Month Maturity | 12-Month Maturity | |||||||||||||
| K-Spread | 0.43*** | 0.42*** | 0.39*** | 0.35*** | 0.57*** | 0.55*** | 0.51*** | 0.47*** | ||||||
| (0.10) | (0.10) | (0.10) | (0.09) | (0.13) | (0.12) | (0.13) | (0.12) | |||||||
| Bank-tiering credit measure | 0.10** | 0.07* | 0.07* | 0.00 | 0.00 | 0.11 | 0.07 | 0.07 | 0.00 | 0.00 | ||||
| (0.05) | (0.04) | (0.04) | (0.05) | (0.06) | (0.07) | (0.06) | (0.06) | (0.05) | (0.06) | |||||
| Bank CDS Premia | 0.03*** | 0.01 | 0.01 | 0.03*** | 0.04*** | 0.01 | 0.01 | 0.03*** | ||||||
| (0.01) | (0.01) | (0.01) | (0.01) | (0.01) | (0.01) | (0.01) | (0.01) | |||||||
| Bid-ask spread | 46.34* | 54.50** | 39.32 | 50.02 | ||||||||||
| (24.66) | (26.67) | (28.67) | (31.40) | |||||||||||
| Daily volume | −0.15 | −0.14 | 0.27 | 0.29 | ||||||||||
| (0.22) | (0.23) | (0.30) | (0.33) | |||||||||||
| Trade size | 0.04 | 0.05 | 0.03 | 0.04 | ||||||||||
| (0.03) | (0.03) | (0.05) | (0.05) | |||||||||||
| Order flow | −0.12 | −0.56 | −0.38 | −1.02 | ||||||||||
| (0.70) | (0.64) | (0.82) | (0.74) | |||||||||||
| BW index | −65.07 | −73.49 | −50.44 | −61.03 | ||||||||||
| (46.56) | (49.08) | (56.19) | (58.80) | |||||||||||
| R2-adjusted (%) | 16.08 | 2.39 | 4.62 | 17.09 | 17.15 | 20.68 | 12.21 | 17.76 | 1.73 | 5.21 | 18.28 | 18.44 | 20.56 | 10.57 |
This table reports the results from regressing the EURIBOR−OIS spread at different maturities onto the one-year K-spread liquidity measure, the proposed overnight bank-tiering credit measure, the one-year bank CDS premia, and overnight interbank market microstructure liquidity measures, with all variables in weekly first-differences, as in equation (6). Panels A through C show the results for three sample periods. The sample for Panel A is January 1, 2007 through December 31, 2014, Panel B is January 1, 2007 through December 31, 2009 (the Global Financial Crisis), and Panel C is January 1, 2010 through December 31, 2014 (the European Debt Crisis). In Panels A through C, the first three columns for each EURIBOR-OIS maturity point report univariate results for the K-spread, the bank-tiering measure, and the CDS spread alone. Column four is a regression onto the K-spread and bank-tiering jointly. Column five is a joint estimation of the K-spread, bank-tiering and CDS. Column six includes all variables. Column seven is the comprehensive estimation, but without the K-spread. Newey-West standard errors are in parentheses with the Newey (1994) lag length. *** indicates significance at the 1 percent level, ** at the 5 percent level, and * at the 10 percent level.
The first three columns of each subpanel in Panels A through C report univariate regression estimates for the K-spread, the bank-tiering credit measure, and the bank CDS measure. The estimates formed over the entire sample period (Panel A) reveal that each variable is significant and positive at the four maturity points. This is consistent with the intuition that a deterioration in either credit or aggregate market liquidity conditions would lead banks to charge one another a higher borrowing premium. The fourth column shows the joint effect of credit and liquidity, estimated with a regression of EURIBOR-OIS spread changes onto both the K-spread changes and the bank-tiering credit measure changes. In comparison to the univariate case, the K-spread coefficient estimates are nearly unchanged in size, but the bank-tiering credit estimates shrink by more than one third. Nonetheless, both estimates remain significant across maturities, showing a role for credit and liquidity in interbank spreads.
The magnitude of the coefficient point estimates for credit and liquidity are different across the sample periods. The Global Financial Crisis (Panel B) sample estimates are more than twice the size of those estimated over the European Debt Crisis (Panel C) period, for both measures. To gauge the economic magnitude of credit and liquidity effects in these two different risk environments, I assess the EURIBOR-OIS spread sensitivity to a one standard deviation shock in credit and liquidity. I use each measure’s sample-average standard deviation, as reported in the summary statistics (Table 2, Panel B) and the joint estimates reported in Table 6, for each sample separately. In the Global Financial Crisis period, a 13 basis point increase in bank tiering implies a 4 to 5 basis point EURIBOR-OIS spread increase, depending on the maturity, and a one standard deviation increase in the K-spread (20 basis points) is associated with an 18–20 basis point EURIBOR-OIS spread increase. For comparison, a typical ECB monetary policy tightening of 25 basis points is expected to produce roughly the same magnitude increase in other short-horizon interest rates. Considering that trillions of euros worth of contracts are linked to prevailing EURIBOR, worsening bond liquidity implies a potentially large contraction in financial conditions.
Over the Sovereign Debt Crisis (Panel C), the estimated EURIBOR-OIS response to a one standard deviation shock to liquidity is 8 basis points, compared to a 1 basis point response to a credit shock, on average across maturities. These estimates show less sensitivity to both types of shocks than in the Financial Crisis. However, the relative importance of liquidity over credit is nearly double that of the Financial Crisis subsample. One argument for the relative increase in the importance of liquidity over credit is that some default risk shifted from the private sector to the public sector as banking systems were bailed out by their respective governments. Another possibility is that interbank market functioning was less robust over the Debt Crisis period than during the Financial Crisis. In particular, unsecured interbank borrowing may have been partly substituted by the ECB’s extraordinary liquidity provision.22
4.2 Controlling for Bank CDS and Interbank Market Liquidity Effects
To check that the estimation results are not driven by an idiosyncratic dynamic to the bank-tiering credit measure, I include bank CDS premia as an additional credit measure in equation (6). The estimates are reported in the fifth column of each subpanel of Table 6. Arguably, CDS contract standardization, central clearing of swaps and a relative increase in short-maturity CDS contracts could improve the information content of their premia.23 However, for each sample, and at all maturity points, the bank CDS estimates are insignificant or unstable in sign. Even with possibly improved informativeness over the sample period, bank CDS premia seem to explain little in interbank spreads beyond what is already captured jointly by the bank-tiering and K-spread measures.
Next, I consider the potential contribution of idiosyncratic interbank liquidity risk to EURIBOR-OIS spreads. The sixth column of Table 6 gives estimates with the full set of controls, now adding the five interbank microstructure liquidity measures, . The interbank liquidity measures show very little significance in any of the sample periods. The adjusted R-squared values, when including the full set of controls (column 6), are very close those from the regressions without the five interbank liquidity measures (column 5) in each sample period. The final column of Table 6 shows the expanded specification, including all credit and liquidity measures, except without the K-spread measure of aggregate liquidity. Over all sample periods, the R-squared values shown in column 7 are less than half as large as those in column 6 when the K-spread is included. Accounting for aggregate bond market liquidity explains more of the variation in EURIBOR-OIS spreads than all the interbank measures combined, regardless of the sample period. These results suggests that in a time of tight funding conditions, interbank spreads might be substantially narrowed through steps to improve aggregate market liquidity, independent of any credit effect.
5. Conclusion
Beginning in August 2007, interest rate spreads across markets widened dramatically during the Global Financial Crisis, threatening the stability of the financial system and the broader economy. Following a brief retrenchment in 2009 and 2010 spreads rose again in 2011 as the European Sovereign Debt Crisis escalated. There are two potential drivers behind these movements: (1) a higher likelihood of default, and (2) market liquidity effects, separate from default risk. Policy prescriptions for addressing these risk conditions differ. If the chief component is default, then only actions to improve the solvency of the issuer are likely to be successful. On the other hand, if wider spreads represent a discount for poor liquidity, then measures to improve market functioning are the most appropriate, and could help prevent adverse repercussions due to a sustained period of higher financing costs. From a practitioner standpoint, a relative price premium attributable to a disruption to market liquidity may represent an attractive opportunity for a long-horizon investor to exploit, whereas deteriorating credit risk would not.
This article first documents the large and persistent liquidity differential between yields on two duration-matched bonds that share an identical credit guarantee from the German federal government. I interpret this yield spread as a model-free measure of euro-area market liquidity, conceptually similar to the Refcorp spread proposed by Longstaff (2004). Formed directly from asset prices, this liquidity yield differential, the K-spread liquidity measure, recovers all information in bond yields that is not related to default risk.
The K-spread and other measures are then used to estimate the effect of credit and market liquidity risks in explaining the extreme euro-area sovereign bond and EURIBOR-OIS spread movements during the 2007–2009 Financial Crisis, and the subsequent Sovereign Debt Crisis. I find that aggregate market liquidity and credit each played substantial and independent roles in sovereign bond yield spread widening in both of the Crises. The results reveal that the common component of liquidity in sovereign bond spreads is substantially larger than the influence of country-specific microstructure bond liquidity measures. This suggests that the K-spread captures a liquidity dimension not priced into instantaneous microstructure liquidity measures.
Additionally, the K-spread measure of aggregate bond market liquidity shows an important role in explaining interbank interest rates spreads, beyond the effects of credit and liquidity measures constructed from interbank transactions. This gives empirical evidence of the large and significant influence of aggregate bond market liquidity on interbank rates. It also underscores the potential for spillover effects stemming from market liquidity disruptions. A common liquidity factor is consistent with the idea that the ease with which securities are traded is related to their value as collateral in funding transactions. The large role for liquidity supports existing findings from the literature on corporate yield spreads. Chen, Lesmond, and Wei (2007) find a role for liquidity in pre-crisis data, Bao, Pan, and Wang (2011) find that liquidity is the primary driver of high-grade corporate bond spreads in the Financial Crisis, and Bongaerts, de Jong, and Driessen (2017) find that liquidity affects expected corporate bond returns over the 2005–2008 sample. My analysis however applies to sovereign bond and interbank markets.
Liquidity explains relatively more of the trough-to-peak sovereign spread widening in the Financial Crisis, but then credit becomes relatively more important in the Debt Crisis sovereign spread widening. In contrast, in interbank spreads, the absolute role of aggregate bond market liquidity in interbank spreads exceeds that of credit in both Crises.
The results in this article have implications for policymakers and for the portfolio choices of investors. For practitioners, a long/short position mimicking the K-spread can hedge against credit fluctuations. The measure itself can gauge real-time pricing of market liquidity risk, helping to inform investment decisions. For policymakers, the results imply that measures to improve market functioning, or even an action that addresses risk perceptions alone, could be effective in bringing down risk spreads. Importantly, such measures can help to avoid the risk of an adverse feedback loop between the liquidity of asset markets and the liquidity of funding markets, and in turn the state of the economy.
Footnotes
I am grateful to Alex Edmans (the editor), Jack Bao (the referee), an anonymous editorial board member, Heitor Almeida, Andrew Ang, Charles Calomiris, Larry Glosten, Charles Jones, Ahn Le, Francis Longstaff and Suresh Sundaresan for their extremely helpful comments on this work, to the Department of Economics and Finance at Columbia Business School for funding the MTS data used in this paper, and to e-MID for generously sharing their data with me. I thank conference participants at the NBER Asset Pricing Meeting, Duke/UNC Asset Pricing, MTS, FIRS, and FRIAS. I also thank Sally Chen, Nicholas Hyde, Paola Ripamonti, and Ernie Vogt for valuable discussions about institutional detail and market functioning. All errors and omissions are my own.
Sovereign bonds are often used as collateral in euro repo transactions (e.g., the central bank’s liquidity operations). Market liquidity premia in the cash bond market will drive EURIBOR rates higher via their collateral value in the repo market; unsecured funding is a close substitute for repo funding.
The Greek data end in January 2010. There are insufficient transactions for reliable analysis in the period around the debt restructuring.
See Gürkaynak, Sack, and Wright (2007), for a discussion of the methodology.
Germany is the largest economy in the euro area, and is one of the three largest euro-area government debt markets in par value outstanding, along with France and Italy. However, Germany has maintained a lower debt-to-GDP ratio than France and Italy since the 1999 monetary union. Additionally, at the time of the Financial Crisis, Germany’s sovereign bond market was the only euro-area bond market with a complementary futures market.
The yield spread could alternatively be constructed relative to the euro-area average yield, giving very similar results.
EURIBOR is a survey rate of unsecured interbank euro borrowing rates compiled by the European Money Markets Institution for eight maturities, from overnight to 1-year. LIBOR, also a survey of interbank borrowing, has been widely cited as manipulated to some degree by the contributing banks. It is unlikely that any potential manipulation of EURIBOR would be systematically related to the measures used in this article. Further there is no clear direction in which it would potentially shift the relative breakdown of liquidity versus credit.
Default risk in OIS is negligible since the notional principal is not exchanged, mitigating counterparty risk even in the absence of central clearing, and the fixed reference rate is for overnight credit. The liquidity component of OIS rates should be negligible for a number of reasons. First, an interest rate swap does not require upfront funding. Also, an OIS is a derivative in zero net supply. As such, it is unclear whether a liquidity premium would be demanded by the payer of the fixed rate or the receiver of the fixed rate. Empirically, the depth of the OIS market far exceeds that of the interbank cash market.
An important but conceptually distinct type of liquidity is funding liquidity, an institution’s precautionary demand for term funding so as to have liquid assets on its balance sheet. In the interbank market, precautionary demand for funding is closely tied to market participants’ creditworthiness. Credit and funding liquidity are thus particularly hard to disentangle and I do not attempt to do so; in this paper, credit incorporates both default risk and associated funding liquidity.
The existence of futures markets enhances the liquidity of Treasury securities in the U.S. (Fleming, 1997), allowing an investor to hedge a position in the underlying security.
In 2008, gross annual issuance was €216 billion in federal government debt versus €74 billion for KfW, and the size of government debt was about 8 times that of KfW agency debt. Issue sizes outstanding at the time were around €20 billion for benchmark federal debt issues versus €5 billion for benchmark KfW issues. Nonetheless, KfW is the 4th largest euro-area debt issuer by volume, after the sovereigns of Germany, France, and Italy. Trading volume for the federal government debt is roughly 10 times higher than that of the agency market (a daily average of €443 million versus €42 million, respectively), on the MTS platform, over the sample period.
KfW bonds may not be used as collateral in federal government repo agreements and vice versa. However, both the securities are actively used for funding purposes; they each have centrally cleared general collateral repo markets, and the settlement convention is the same: three days following trade execution (t+3).
MTS is an acronym for Mercato dei Titoli di Stato (Market for Sovereign Bonds). MTS is the largest inter-dealer European sovereign bond market platform, comprising an estimated 80% of electronic inter-dealer transactions (Euroweek special report, May 2007).
e-MID is an acronym for Elettronica Mercato Interbancario dei Depositi (Electronic Interbank Deposit Market). Transactions on this platform comprise roughly 20% of all unsecured euro-denominated interbank transactions over the sample period.
Overnight funding transactions help banks meet their day-to-day funding needs. In the sample, 91% of transaction volume is agreed to for maturity on the following business day. The ECB’s annual euro money market reports give detailed statistics on borrowing and lending each year. The maturity distribution has consistently shown that the largest share of transactions occurs at the overnight maturity.
The 22 EURIBOR survey banks are: Banco Bilbao Vizcaya Argentaria (BBVA), Banco Santander SA, Barclays, Bank of Tokyo Mitsubishi, BNP Paribas, Caiza General de Depositos, Citibank, Credit Agricole, Credit Suisse First Boston (CSFB), Danske Bank, Deutsche Bank, DZ Bank, HSBC, ING, Intesa San Paolo, JP Morgan Chase, Mizuho, Monte dei Paschi di Siena, Lloyds, National Bank of Greece, Natixis, Nordea, Pohjola, Rabobank, Royal Bank of Scotland, Societe Generale, and Unicredit.
EURIBOR is a trimmed arithmetic average of interbank survey rates collected from a particular set of banks. I do not trim the bank CDS premia before averaging them, because it is not clear that the same banks would be trimmed from the EURIBOR survey as those trimmed according to the distribution of bank CDS premia.
Results across the other four maturities are similar, and are detailed in the Supplementary Appendix (http://finance.wharton.upenn.edu/~kschwarz/MTG_WebApp.pdf).
In March 2012, the Greek government officially triggered a credit event for CDS contracts referencing Greek government debt. Over many months preceding the default determination, the Greek government proposed various debt haircuts for private debt holders. The debt was ultimately restructured such that outstanding Greek bonds were exchanged for a basket of European Financial Stability Facility (EFSF) and Greek government securities, with varying terms and conditions. This left only a small fraction of Greek bonds with private creditors.
Results for all maturities in the sample are provided in Supplementary Appendix.
Results are reported when using the 1-year maturity K-spread measure for the analysis of interbank spreads, but the estimation is not sensitive to the choice of maturity.
The explanatory variables are the same at all four maturities; so estimating the equation at the four maturities jointly by SUR gives numerically identical results.
In late 2008, the ECB began a policy of allowing banks to hold funds in excess of their minimum reserve requirements, in aggregate. The sharpest rise in excess reserve occurred in 2011, during the European Debt Crisis, reaching a peak of around €1 trillion in excess reserves in 2012. A November 2017 report by the ECB shows that excess reserves accumulated during the European Debt Crisis period were almost fully eliminated by 2014. However, excess reserves surged again in 2015 amid the ECB’s securities’ purchase program, and have remained at an elevated level since then. In an environment of aggregate excess reserves in the United States, amid the Federal Reserve’s quantitative easing program from 2008 to 2014, transaction volume in the interbank market declined precipitously, as banks had little need to transfer funds among themselves.
Although the gross notional value of CDS outstanding contracted following the Global Financial Crisis, the BIS (https://www.bis.org/publ/qtrpdf/r_qt1806b.htm) reports that a large share of this is attributable to portfolio compression. Contract standardization, much of which came from new industry protocols that were set forth in the “Big Bang” and “Little Bang” in 2009, allows for contract netting, which reduces portfolio risk. Additionally, the United States and Europe have phased in central clearing requirements for standardized swap contracts following the Financial Crisis, which entail novating the contract to a third party clearinghouse, thus reducing counterparty risk. The European Union officially adopted a ban on short sales of European sovereign debt in November 2011. Buying CDS protection is a way to replicate a short debt position on the underlying.
In the unsecured interbank market, the lender is fully exposed to the credit risk of the borrower, and this is the only credit risk that the lender faces. The interbank rate thus prices the likelihood of repayment by the borrower.
A simple example illustrates the model’s multiplicative assumption. Suppose on a day with low credit and on a day with high credit, and suppose for the best credit bank and for the worst credit bank. Then credit tiering on a good credit day would be and credit tiering on a bad credit day would be .
One distinct advantage of the new credit measure is that it is constructed from rates on actual unsecured interbank transactions and thus reflects true borrowing costs, whereas survey-derived rates such as EURIBOR and LIBOR may be affected by manipulation. A comparison of LIBOR and other measures of bank borrowing costs is reported in Kuo, Skeie, and Vickery (2012).
In contrast, the MTS bond trading platform follows conventional price-time priority; trades are matched automatically based on the most attractive quote submitted, with priority given to the earliest submission. The counterparty’s identity is revealed only after the trade is agreed to, which eliminates counterparty risk effects from bond trades on the MTS platform.
The intuition behind an identity-transparent platform for interbank markets is that the interbank loan is effectively the equivalent to the traded asset in an asset market. Just as a bond market participant would find it difficult to price a bond without knowing the identity of the bond issuer, an interbank market participant would be reluctant to lend unsecured funds to a mystery borrower. The relationship between counterparty default risk and the credit of an interbank trade is precisely what drives the transparent information structure of the e-MID platform. The importance of the borrower’s identity is evident; 81% of interbank lending volume in the sample is via market order. Following the crisis, e-MID introduced a parallel platform where identities were not revealed, but there was very little market interest to transact “confidentially.”
Estimation is necessary because each bank in the sample has a unique but generic identifier that does not reveal the bank’s actual identity. A priori, I cannot tell which banks are good/bad credits from their e-MID identifiers alone.
Controlling for the day effect in equation (8) is important as the overall level of rates changed over the sample. The ECB raised its policy rate by 25 basis points on March 14, 2007 and again on June 13, 2007. Another way to isolate the credit component of interbank rates is to subtract the daily GC repo rate from the left-hand side of equation (8). However, this approach confounds the credit component with repo market seasonality.
There is no way to insure against the default of interbank deposits. In principal, a CDS contract could be entered into each day with the counterparty’s debt as the reference obligation, but transactions costs would be prohibitive. In practice, these loans are not resold. Novation requests, or third party risk assumption for a transaction, occurred during the crisis. But, this was motivated by risk reduction of outstanding obligations, not to insure new transactions.
To check whether I have captured the difference between rates paid by high credit and low credit institutions, I consider the propensity to borrow via limit order versus market order for different credit quintiles. Low credit banks should prefer to borrow via limit order so that their identity is factored into the counterparty’s lending rate; the lending bank will know that the borrower is low risk and will thus agree to a relatively low rate. It turns out that borrowing via market order as a fraction of total borrowing is 92% in the best credit quintile, compared to 57% in the lowest credit quintile. In fact, the propensity to borrow via limit order is monotonically increasing in credit quintile, supporting the idea that the grouping of banks by quintile has indeed separated the good credit banks from the bad credit banks.
Appendix Bank Credit Tiering Measure Estimation
To motivate this approach, suppose that the spread between the interest rate that bank j has to pay on day t and the hypothetical risk-free interest rate is multiplicative of the form where is a bank fixed effect and is a time fixed effect. Normalize the average to one and let the cross-sectional dispersion of be θ. Then the average credit premium on any day is and the dispersion across banks on any day is . The average credit premium on day t is thus proportional to the dispersion in rates.25 In this model, as the default risk of low credit institutions worsens, that of high credit institutions worsens proportionately more, and so an increase in the average rate difference between these two tiers of borrowers reflects an increase in the overall level of credit. The intuition is consistent with that of structural credit models. For instance, the model of Merton (1974) predicts that the credit premium is approximately proportional to rate volatility. It is also consistent with the idea that credit is largely driven by a systemic factor (Longstaff et al., 2011).
To operationalize this bank-tiering measure, I use the unique database of signed interbank transactions from e-MID, an electronic interbank trading platform. These data show the negotiated rate and bank identities of the borrower and lender for each individual trade that takes place over the sample, plus the time stamp, maturity, volume, and the initiating side of each trade.26 There are two key features of the e-MID platform that are important to the interpretation of the transaction rates. First, the lender in a trade is fully exposed to the default risk of a borrower in these trades that are facilitated but not backed by e-MID. This contrasts with trades in centrally cleared markets, such as futures, where the clearinghouse effectively becomes the counterparty to each trade. Second, e-MID transactions are identity-transparent; a participant can view all limit orders posted by platform participants, alongside of their respective bank identities, and can choose to take the other side of any order that is posted.27 A bank will initiate a market order to lend only if the posted borrowing rate sufficiently compensates the lender for the risk of the trade. It follows that the credit-relevant information on e-MID comes from the rates on limit orders to borrow (or equivalently market orders to lend), where trades are agreed to with the foreknowledge of the borrower’s identity.28
I use the rate and borrower identity information in e-MID limit order data to form a bank-tiering measure of credit, in the following three steps.
- First, to estimate banks’ credit quality, I run the following pooled regression29:where denotes the unsecured interbank rate paid by borrower j in its ith transaction on day t in hour h. denotes the time-of-day indicator variable for each hour, h, denotes the indicator variable for bank borrower j, and denotes the indicator variable for day t. The day and time indicators control for effects common to all rates, including interbank market-wide liquidity shocks.30 The bank dummy coefficient, , estimates the average credit quality of each bank.31 Considering only the borrowing side of the quote avoids any contribution of noise to the measure from the bid-ask bounce. I re-estimate the banks’ creditworthiness each year, updating each banks’ relative ranking based on its most recent borrowing rates.(8)
Next, I sort borrowers into credit quintiles according to their credit coefficient estimates; the top quintile represents banks that paid the highest average rates, and are thus perceived as the worst credits.32 Each quintile contains the same number of banks. For an apples-to-apples comparison, I use only maturity-matched trades.
In the third and final step, I define the bank-tiering credit measure. Let and denote the average rates paid by the banks in the highest and lowest risk quintiles, respectively, on day t (averaged across all hours on each day). The bank-tiering credit measure is then simply as in equation (7).
Figure 4A plots the new bank-tiering credit measure, showing that it spikes to 60 basis points in October 2008 during the Global Financial Crisis, and later peaks at 119 basis points in December 2011 during the Sovereign Debt crisis. This compares with a less-than 5 basis point differences in average rates paid by the best- versus worst-credit banks in normal times.
