


Abstract
To investigate, in anti-CCP antibody–positive individuals with musculoskeletal symptoms but no clinical synovitis (CCP+ at-risk), the additional value of US for the prediction of inflammatory arthritis. Furthermore, to define a concise US protocol for feasible risk prediction.
Demographic and clinical data were collected in 417 CCP+ at-risk (Leeds CCP cohort) with a baseline US scan assessing synovitis and bone erosions in 36 joints, and a follow-up duration ≥24 months. Multivariable binary regression models for inflammatory arthritis development at 24 months evaluated routine clinical variables associated with inflammatory arthritis alone (‘clinical’ model) and combined with a 36-joint US scanning protocol (‘clinical-US extended’ model). A ‘clinical-US short’ model was also developed.
At 24 months, 92/417 (22.1%) CCP+ at-risk developed inflammatory arthritis (median time 7 months, interquartile range 3–12). The ‘clinical-US extended’ model performed better than the ‘clinical’ model [area under the curve (AUC) 0.788 vs AUC 0.731, respectively, P < 0.001] with an odds ratio for inflammatory arthritis development of 3.18 (95% CI 1.80–5.63) for US synovitis and 2.54 (95% CI 1.21–5.37) for bone erosions. The ‘clinical-US short’ model, which retained the wrists, knees and MTP5 joints, performed better (AUC 0.782) than the ‘clinical’ model (P < 0.001) and similarly (difference in Akaike information criteria <2) to the ‘clinical-US extended’ model.
US provides valuable information for predicting progression to inflammatory arthritis in CCP+ individuals both alone and in addition to clinical variables. US synovitis was associated with a 3-fold increase risk of inflammatory arthritis development. A concise US protocol of six joints provides clinically feasible risk prediction in CCP+ at-risk.
US improved prediction of inflammatory arthritis progression over routine clinical/serological variables in CCP+ at-risk individuals.
A 6-joint US assessment performed similarly to an extended (i.e. 36 joints) research ultrasound protocol.
This 6-joint scanning protocol could be incorporated into clinical practice for risk-prediction in at-risk individuals.
Introduction
The identification of reliable biomarkers for future arthritis development is crucial for the risk-stratification and management of individuals at-risk of RA [1–3].
In the context of risk stratification, imaging—and in particular US—has shown a very promising role [4–6]. Several studies have demonstrated that US-detected subclinical synovitis and/or bone erosions improve prediction of inflammatory arthritis/RA progression in different at-risk populations [7–13]. We have previously demonstrated that power Doppler signal alone is associated with progression to inflammatory arthritis at both joint and patient level in at-risk individuals with positive anti-CCP antibodies and musculoskeletal (MSK) symptoms (CCP+ at-risk) [7, 14]. Moreover, the majority of CCP+ at-risk who develop arthritis may first go through a stage of US subclinical synovitis [15]. In line with the increased inflammatory arthritis risk associated with sub-clinical synovitis, arthritis prevention trials have frequently included subclinical inflammation on imaging as an inclusion criterion [16–18].
Given its widespread use in symptomatic at-risk populations, especially in Europe, clarification of the true value of US compared with other risk factors in this setting is needed [19, 20].
First, the additional value of US over and above routine clinical variables, including those that have been shown to predict arthritis progression [e.g. early morning stiffness (EMS) duration, hand or feet involvement, level of autoantibodies] remains to be determined [21]. Indeed, most US studies in at-risk individuals have reported a positive correlation between the presence of US abnormalities and inflammatory arthritis development without considering the potential influence of co-existent clinical and serological variables [7–10].
Secondly, the feasibility of performing an US assessment in routine clinical practice requires critical assessment. Most research studies use extensive US protocols evaluating >20 joints, some >30 joints. However, rheumatologists commonly have no more than 30 min to assess each patient. A concise US protocol, offering optimum predictive accuracy while being brief enough to be incorporated into routine clinical practice, has not yet been defined [22].
Therefore, the objectives of this study were twofold:
To explore, in anti-CCP-positive individuals with MSK symptoms but without clinical synovitis (CCP+ at-risk), the additional value of US over and above routine clinical and serological variables for the prediction of inflammatory arthritis.
To develop an optimized, concise US scanning protocol for prediction of inflammatory arthritis in CCP+ at-risk, suitable for routine use in clinical practice.
Methods
This study is a predefined analysis of a longitudinal observational cohort (‘The CCP Study: Coordinated Programme to Prevent Arthritis’). The Transparent Reporting of a multivariable prediction model for Individual Prognosis Or Diagnosis (TRIPOD) checklist informed the study design [23].
The details of the Leeds CCP study have been published previously [24, 25]. Briefly, this is a national observational study, where individuals presenting to primary care with a new non-specific MSK complaint are tested for anti-CCP antibodies; those who test positive are invited to a dedicated research clinic at Chapel Allerton Hospital, Leeds as part of a prospective cohort. The primary outcome of the study is the development of inflammatory arthritis, defined as the presence of one or more swollen and tender joint clinically confirmed by a rheumatologist.
This current study includes CCP+ at-risk who were enrolled from June 2008 to December 2020. Individuals were included in the current study if they had a baseline (i.e. first visit) US scan and at least 2 years of follow-up (unless they developed inflammatory arthritis within this period).
Baseline US scans were performed by rheumatologists experienced in MSK US and MSK sonographers from a single centre, all of whom underwent training on the US scanning protocol. They were blinded to the participant’s clinical and demographic data.
As previously reported [7, 10], three different US machines were used during this 15-year study: a Philips (ATL HDI 5000) US machine working with 5–12 MHz and 8–15 MHz transducers; a General Electric (GE) S7 machine, employing a 6–15 MHz transducer; a GE Logiq E9 machine, employing a 6–15 MHz transducer. The change in US machines reflects the 15 year duration of this large cohort study. Because of the change in the US machine during the study, sensitivity analyses between the first two US machines (Philips and GES7) were performed [7]. Due to the positive results of this analysis and the fact that the GES7 was replaced with another General Electric machine (GE Logiq E9), the same analyses were not repeated for the third US machine used. Power Doppler signal was set as follows: pulse repetition frequency 700–1000 Hz, Doppler frequency 6 MHz for the Philips (ATL HDI 5000), 10 MHz for the GE S7 and GE Logiq E9.
Greyscale (GS) changes and power Doppler signal were scored using a semi-quantitative method from 0 to 3, using a previously proposed scoring system by EULAR/OMERACT [26]. A representative example of the spectrum of different grades of power Doppler synovitis has been reported in Supplementary Fig. S1, available at Rheumatology online. A combination of GS features and power Doppler signal was used to define the presence of US synovitis according to the more recent EULAR/OMERACT definitions (i.e. GS changes ≥1 and power Doppler signal ≥1) [27]. Bone erosions were also defined according to OMERACT [28].
The US scanning protocol included the following 18 joints bilaterally: elbow, wrist, MCP joints 1–5, PIP joints 1–5, knee, ankle and MTP joints 2–5.
For each individual, the following baseline data were included in the analysis: age, gender, smoking exposure, EMS duration, tenderness in the small joints of the hands and/or feet, second-generation anti-CCP (CCP2) Ab titre (BioPlex 2200 CCP2, BioRad, Hercules, CA, USA) and RF positivity/negativity. Selection of clinical and serological variables for inclusion in the analysis was based on previous data from this cohort indicating EMS, tenderness of hands and autoantibody levels are associated with inflammatory arthritis development [24]. Age and smoking were also tested in this current larger cohort, despite not being associated with inflammatory arthritis development in the original analysis [24]. These variables were included in the univariate analysis to evaluate association with inflammatory arthritis development.
Anti-CCP2 positivity threshold was set at 7 IU/ml initially, and later 2.99 IU/ml (manufacturer cut-offs). Low or high level were defined as <3 or ≥3 times the positivity threshold, respectively. RF positivity was set at ≥40 IU/ml (before February 2010) or ≥20 IU/ml (after February 2010). Participants were assessed for progression to inflammatory arthritis at 3-monthly intervals for the first year and then annually.
Ethics approval
This study was approved by the National Health Service Health Research Authority National Research Ethics Service Committee Yorkshire & the Humber–Leeds West. Full written informed consent was received from all participating individuals.
Statistical analysis
Categorical variables were reported as numbers and percentages. Continuous variables were reported as mean and s.d. or median with 5th–95th range according to the normality of the data distribution assessed by inspection of Q–Q (quantile–quantile) plots.
Baseline clinical characteristics and US findings of individuals who developed and did not develop inflammatory arthritis within 24 months were compared using χ2 test or Fisher’s exact test, for categorical variables and Student’s t-test or Mann–Whitney test for continuous variables. The Kaplan–Meier method with log-rank test was also conducted to determine whether there were differences in the inflammatory arthritis–free survival distributions according to the baseline US findings.
Logistic regression analysis was performed using a 10-fold cross validation and then compared. The linear relationship between the logit of the outcome and each continue predictor variable was verified by inspection of the corresponding scatterplot. The absence of influential observation was confirmed in the absence of standardized residual ≥3 s.d. The multicollinearity of predictors was defined in the absence variance inflation factor (VIF) values ≥5. Results were expressed as odds ratio (OR) with 95% CI.
Regression model performances were described by their area under the curve (AUC). Nested model performances were compared using Likelihood-Ratio test while non-nested models by Akaike information criterion (AIC) with a difference >2 considered evidence for the model with the smaller AIC [29, 30]. The classification cut-off was set according to the higher Youden’s index. The predictive performance of a 36-joint US scanning protocol in addition to the clinical variables (‘clinical-US extended’ model) was evaluated in comparison with the clinical variables alone (‘clinical’ model). A ‘clinical-US short’ model (including the clinical variables and a minimum combination of joints with highest prediction accuracy) was developed.
A minimum of 10 events per evaluated predictor was considered acceptable to build the multivariable regression model [31]. Given an expected inflammatory arthritis cumulative incidence of 25% at 24 months [10, 24], we considered a minimal sample size of 400 at-risk individuals sufficient to build the model.
The number needed to scan (NNS) (i.e. the number of US examinations needed to prevent a single misclassification of inflammatory arthritis based on clinical variables only) was computed as the reciprocal of the absolute risk reduction [32]. Statistical significance was defined as a P < 0.05 for all the analyses and all the tests were two-tailed. Data were analysed using R Studio (version 2022.02.3 + 492).
Once a reduced scanning protocol was identified, sonographers recorded the time to scan and report a full (i.e. 36 joints) US protocol compared with this reduced short US protocol (i.e. 6 joints) in 10 consecutive CCP+ at-risk subsequently evaluated.
Results
US predicts progression to inflammatory arthritis in CCP+ at-risk individuals
A total of 463 CCP+ at risk taking part in the Leeds CCP study between June 2008 and December 2020 had a baseline (i.e. first visit) US scan. Of these, 46 (9.9%) were excluded because they were lost to follow-up within the 2 years of follow-up without developing inflammatory arthritis.
Therefore, 417 CCP+ at risk with a baseline US scan and at least 2 years follow-up were included in the final analysis. Of the 417 individuals, 92 (22.1%) progressed to inflammatory arthritis within 24 months [median time to inflammatory arthritis progression 7 months, interquartile range (IQR) 3–12] and 81/92 (88.0%) fulfilled the 2010 RA ACR/EULAR classification criteria.
Baseline clinical and demographic characteristics of the 417 CCP+ at-risk individuals are reported in Table 1.
Clinical characteristics and US findings in 417 CCP+ at-risk individuals and their association with inflammatory arthritis development at 24 months follow-up
| 24-month follow-up | ||||
|---|---|---|---|---|
| Overall, n = 417 | ‘Progressors’, n = 92 | ‘Non-progressors’, n = 325 | P-value | |
| Age, years, median ± s.d. | 52 ± 13 | 54 ± 14 | 51 ± 13 | 0.047 |
| Female, n (%) | 304 (72.9) | 67 (72.8) | 237 (72.9) | >0.9 |
| Current or previous smoker, n (%) | 232 (55.6) | 64 (69.6) | 168 (51.7) | 0.002 |
| Hand joint tenderness on examination, n (%) | 151 (36.2) | 43 (46.7) | 108 (33.2) | 0.017 |
| Foot joint tenderness on examination, n (%) | 72 (17.3) | 21 (22.8) | 51 (15.7) | 0.11 |
| EMS ≥30 min, n (%) | 158 (37.9) | 48 (52.2) | 110 (33.8) | 0.001 |
| High anti-CCP level, n (%) | 273 (65.5) | 76 (82.6) | 197 (60.6) | <0.001 |
| RF positivity, n (%) | 158 (37.9) | 57 (62.0) | 101 (31.1) | <0.001 |
| GS abnormality in ≥1 joint, n (%) | 389 (93.3) | 87 (94.6) | 302 (92.9) | 0.6 |
| Power Doppler abnormality in ≥1 joint, n (%) | 103 (24.7) | 45 (48.9) | 58 (17.8) | <0.001 |
| US synovitisa in ≥1 joint, n (%) | 103 (24.7) | 45 (48.9) | 58 (17.8) | <0.001 |
| Bone erosions in ≥1 joint, n (%) | 48 (11.5) | 25 (27.2) | 23 (7.1) | <0.001 |
| US synovitisa and/or bone erosions in ≥1 joint, n (%) | 120 (28.8) | 51 (55.4) | 69 (21.2) | <0.001 |
US synovitis was defined as the concomitant presence of GS changes ≥1 and power Doppler ≥1 in the same joint. EMS: early morning stiffness; GS: greyscale.
On univariable analysis, the following routinely available clinical and serological variables were associated with inflammatory arthritis development: age, smoking exposure, EMS duration ≥30 min, tenderness in the hands on physical examination, high-level anti-CCP antibody and RF positivity (all variables P < 0.05). These variables were used to build the inflammatory arthritis prediction model based on routine clinical/serological information only (‘clinical’ model).
Power Doppler in ≥1 of 36 joints, US synovitis in ≥1 of 36 joints and US bone erosions in ≥1 of 36 joints were also associated with inflammatory arthritis progression (P < 0.001), while GS changes did not show any significant association with the outcome (Table 1). The prevalence and distribution of the US findings (i.e. GS changes, power Doppler, US synovitis and bone erosions) in the 417 CCP at-risk are reported in Supplementary Table S1, available at Rheumatology online.
In addition, the prevalence and distribution of the US findings and their association with inflammatory arthritis progression (univariate analysis) within 24 months in individual joints are reported in Supplementary Table S2, available at Rheumatology online.
Kaplan–Meier analysis confirmed different inflammatory arthritis–free survival patterns according to the evidence of US synovitis and/or bone erosion at baseline (Log-Rank test P < 0.001) (Fig. 1).
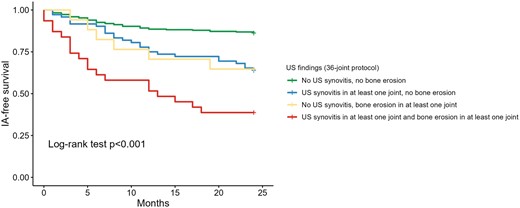
Kaplan–Meier curves of inflammatory arthritis–free survival according 36-joint US scanning protocol. IA: inflammatory arthritis
US predicts progression to inflammatory arthritis over and above clinical variables alone
As shown in Table 2, the discrimination ability of clinical variables in combination with US assessment of synovitis (AUC 0.782), bone erosions (AUC 0.748) or both (AUC 0.788) in 36 joints was better than the clinical variables alone (‘clinical’ model) (AUC 0.731, Likelihood-Ratio test P < 0.001 for each comparison).
Prediction models for inflammatory arthritis progression at 24 months’ follow-up
| US abnormality | Adjusted ORb (95% CI) | P-value | AUC | P-valuec | AICd | |
|---|---|---|---|---|---|---|
| Clinical model with US assessment of synovitis and/or bone erosions in 36 joints | ||||||
| Clinical variables onlya | 0.731 | 404.68 | ||||
| Clinical variablesa + US assessment of 36 joints | US synovitis (≥1 joint) | 3.93 (2.29–6.73) | <0.001 | 0.782 | <0.001 | 381.82 |
| Clinical variablesa + US assessment of 36 joints | Bone erosions (≥1 joint) | 3.97 (2.00–7.88) | <0.001 | 0.748 | <0.001 | 391.42 |
| Clinical variablesa + US assessment of 36 joints | US synovitis (≥1 joint) | 3.18 (1.80–5.63) | <0.001 | 0.788 | <0.001 | 377.95 |
| Bone erosions (≥1 joint) | 2.54 (1.21–5.37) | 0.001 | ||||
| Different combinations of the most predictive individual jointse | ||||||
| Clinical variablesa + US of MTP5, wrists and knees | US synovitis (≥1 joint) | 3.07 (1.66–5.68) | <0.001 | 0.782 | <0.001 | 379.27 |
| Bone erosions (≥1 joint) | 3.56 (1.60–7.95) | 0.002 | ||||
| Clinical variablesa + US of MTP5, wrists and MTP3 | US synovitis (≥1 joint) | 2.97 (1.60–5.51) | <0.001 | 0.781 | <0.001 | 380.16 |
| Bone erosions (≥1 joint) | 3.57 (1.60–7.97) | 0.002 | ||||
| Clinical variablesa + US of MTP5, knees and MTP3 | US synovitis (≥1 joint) | 4.86 (1.83–12.88) | 0.002 | 0.777 | <0.001 | 380.97 |
| Bone erosions (≥1 joint) | 4.18 (1.77–9.87) | 0.001 | ||||
Clinical/serological variables associated with inflammatory arthritis onset at univariate analysis: age, current/previous smoker, RF positivity, high anti-CCP titre, tenderness in the hands, EMS ≥30 min.
Adjusted for the clinical/serological variables above.
Likelihood-Ratio test comparison with the nested model based on clinical evaluation only.
AIC difference >2 was used to define a difference between two models in data fitting in favour of the model with the lower value.
Only the most predictive combinations of three joints were reported in this table. AIC: Akaike information criterion; AUC: area under the curve; EMS: early morning stiffness; OR: odds ratio.
Of note, both US synovitis (adjusted OR 3.18, 95% CI 1.80–5.63) and bone erosions (adjusted OR 2.54, 95% CI 1.21–5.37) were associated with inflammatory arthritis development independently of each other. The US assessment of 36 joints including both synovitis and erosions was superior to US assessment of synovitis or erosions alone using the same protocol, as indicated by the lower AIC values and ΔAIC >2. Therefore, the final model, which combined the clinical variables and US assessment in 36 joints, included the US assessment of both synovitis and erosions (‘clinical-US extended’ model).
The NNS using a 36-joint US scanning protocol to prevent one misclassification of inflammatory arthritis development based on clinical variables only was 10.
Defining a novel concise US protocol for predicting progression to inflammatory arthritis
The predictive value of US-detected synovitis and bone erosions for inflammatory arthritis progression within 24 months in CCP+ at-risk (in addition to the clinical and serological variables) was evaluated in each individual joint: wrists, MCP1, knees, MTP3 and MTP5 showed the best predictive performance for inflammatory arthritis development according to AIC values (Supplementary Table S3, available at Rheumatology online).
Therefore, different combinations of three pairs of joints were explored to identify a reduced US scanning protocol with a comparable discrimination ability to the ‘clinical-US extended’ model.
As shown in Table 2, all combinations of three pairs of joints determined an improvement of the predictive performance for inflammatory arthritis development compared with the ‘clinical’ model (Likelihood-Ratio test P < 0.001 for all comparisons). However, the combination of wrists, knees and MTP5 joints (‘clinical-US short’ model) was the only one that provided an inflammatory arthritis prediction performance comparable to the ‘clinical-US extended’ model (ΔAIC <2). The models including all potential combinations of three joints have been reported in Supplementary Table S4, available at Rheumatology online.
In this ‘clinical-US short’ model, both US synovitis (adjusted OR 3.07, 95% CI 1.66–5.68) and bone erosions (adjusted OR 3.56, 95% CI 1.60–7.95) were independently associated with inflammatory arthritis development within 24 months. Receiver-operating characteristic curves showing inflammatory arthritis progression within 24 months for the ‘clinical’ model plus US assessment of synovitis and bone erosions in 36 joints (‘clinical-US extended’ model) and 6 joints (‘clinical-US short’ model) are illustrated in Fig. 2.
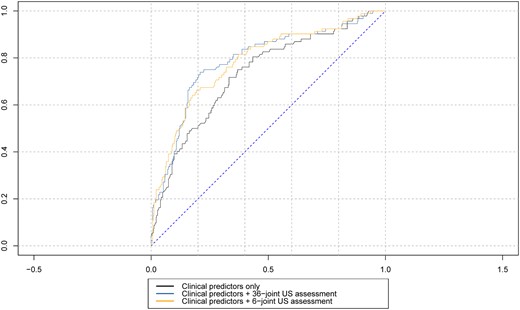
ROC curves analyses comparing inflammatory arthritis progression at 24 months follow-up for clinical/serological variables (‘clinical’ model) with US assessment of synovitis and bone erosions in 36 joints (‘clinical-US full’ model) or 6 joints (‘clinical-US short’ model). IA: inflammatory arthritis; ROC: receiver-operating characteristic
The NNS using the concise 6-joint US scanning protocol to prevent one misclassification of inflammatory arthritis development based on clinical variables only was 11. Conversely, the NNS using a full 36-joint US protocol to prevent one inflammatory arthritis development misclassification based on the concise 6-joint US protocol was 133.
The mean time required by sonographers to perform an ‘extended’ US scanning protocol (i.e. 36 joints) in 10 randomly selected CCP+ at-risk individuals was 30.2 min (IQR 29–32) vs 10.9 min (IQR 10–12) for the ‘short’ scanning protocol (mean difference 19.3 min, IQR 18–20).
Discussion
While US is generally accepted as a valuable (albeit late) biomarker for identifying individuals at imminent risk of developing inflammatory arthritis, its additional value over the routine clinical/serological variables that can also risk-stratify these individuals has been poorly defined. The current study confirmed that US further improves prediction of progression to inflammatory arthritis in CCP+ at risk individuals with MSK symptoms but no clinical synovitis, over and above routine clinical/serological variables in a large CCP+ at risk population. Using a concise US assessment of three joints bilaterally (wrist, knee and MTP5 joint), US synovitis and bone erosions improved prediction of progression to inflammatory arthritis with an OR of 3.07 (95% CI 1.66–5.68) for US synovitis and 3.56 (95% CI 1.60–7.95) for bone erosions, when adjusted for clinical and serological variables.
The predictive performance of this novel, concise US protocol (‘clinical-US short’ model) was similar to our typical research-based US scanning protocol which included 36 joints (‘clinical-US extended’ model) and determined a reduction in the scanning time of about 20 min compared with the extended protocol. This protocol could therefore be incorporated into routine clinical practice, with a brief US assessment performed by the rheumatologist (or a sonographer) at the same visit as the clinical assessment, thus facilitating immediate and accurate risk stratification and informing clinical decision making (e.g. inclusion in a clinical trial for inflammatory arthritis prevention, timing of follow-up, communication of risk status with the patient).
Indeed, the importance of subclinical synovitis on imaging in at risk individuals is indicated by its inclusion as an eligibility criterion in several RA prevention trials internationally [16, 33]. Since such trials are likely to proliferate over the next decade, the true value and optimal use of US in these populations must now be carefully determined. In addition, while a previous UK survey has shown that many rheumatologists would start a treatment in CCP+ at-risk individuals with MSK symptoms (but without clinical synovitis) who show power Doppler on US [34], a Dutch study has demonstrated that power Doppler synovitis is not always associated with progression to inflammatory arthritis in this at risk population, thus suggesting that treating these individuals on the basis of subclinical inflammation only (i.e. before the development of clinical arthritis) might lead to overtreatment [35]. Interestingly, in an interim analysis of the Stop Rheumatoid Arthritis trial, HCQ failed to prevent the development of inflammatory arthritis in 144 CCP3+ individuals with or without arthralgia and imaging inflammation [36].
In the current study, we confirmed the role of US as a powerful predictor for the development of inflammatory arthritis in CCP+ at-risk individuals. Despite the absolute difference in AUC between the US models (i.e. ‘clinical-US extended’ and ‘clinical-US short’ model) and the clinical model of <5% (i.e. AUC 0.788, AUC 0.782 and AUC 0.731, respectively) this was statistically significant. In addition, other analyses that were carried out in the current study suggest that this difference could also be regarded as clinically significant. Indeed, as shown in Table 2, US synovitis and bone erosions determined a 3-fold increase in the risk of developing inflammatory arthritis in both the ‘extended’ and ‘short’ US models. Furthermore, the NNS to prevent one misclassification of inflammatory arthritis development based on clinical variables only was 10 and 11 using the ‘extended’ and ‘short’ US models respectively, which confirm the value of US in clinical practice for the identification of potential progressors to inflammatory arthritis.
The development of inflammatory arthritis was used as the outcome measure for the construction and validation of our model, rather than the full fulfilment of the 2010 RA ACR/EULAR classification criteria [37]. This methodological approach aligns with previous studies of our research group as well as with studies from other RA at-risk cohorts [7, 10, 38–40]. Moreover, we chose inflammatory arthritis development at the outcome measure as we felt that this is associated with management decisions in clinical practice, i.e. clinicians will usually initiate disease-modifying treatment if inflammatory arthritis develops in a patient who is CCP+. The ACR/EULAR classification criteria are useful for inclusion into trials but most people would start treatment if inflammatory arthritis is identified.
The ‘clinical-US short’ model, which was developed in the current study, retained the knee joint despite the low prevalence of US synovitis (1.2%) and the absence of US bone erosions. Our decision to define US synovitis by the mandatory presence of power Doppler signal (i.e. GS ≥1 and power Doppler ≥1) might have determined such a low prevalence. In fact, the depth of the knee joint could make power Doppler signal detection uncommon, even in those patients with clinical synovitis (which usually appears as synovial hypertrophy or fluid on US).
We defined synovitis as a combination of GS and power Doppler findings to improve specificity. Indeed, GS changes are frequently seen in the joints of asymptomatic healthy individuals [41, 42]. On the other hand, despite the fact that power Doppler signal is less frequently encountered in non-inflammatory conditions or healthy subjects, the recent EULAR/OMERACT definitions do not accept the isolated presence of power Doppler signal (i.e. without synovial hypertrophy) as sufficient to define US synovitis [27].
The wrists were the joints with the highest prevalence of US subclinical synovitis (15.1%). US synovitis in the wrists was associated with inflammatory arthritis development in both the univariate and multivariate analysis. On the other hand, US bone erosions in the wrists were uncommon (1.2%) and infrequently associated with inflammatory arthritis progression. The evaluation of bone erosions in the wrist joints (including the ulnar styloid) can be challenging, especially in patients with OA where bone superimposition due to osteophytosis can mimic the presence of bone erosions [43].
The MTP5 joints had the highest prevalence of bone erosions (8.2%). In addition, MTP5 joints were the only joints where the presence of bone erosions was significantly associated with inflammatory arthritis development. While MTP5 bone erosions were significantly associated with inflammatory arthritis development in both the univariable and multivariable analyses, synovitis (which was less prevalent, 4.3%) was associated with inflammatory arthritis development only in the former analysis (see Fig. 3 for representative images).
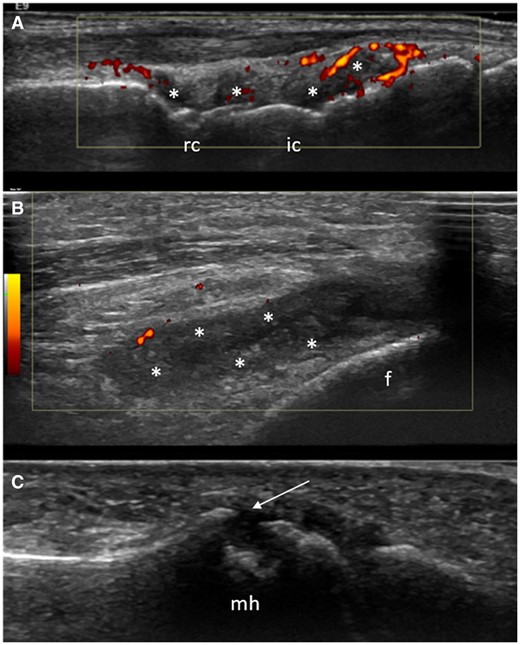
US synovitis and/or bone erosions in the three joints included in the ‘clinical-US short’ model (wrist, knee and MTP5 joint) in three different CCP+ at risk individuals. (A) Synovial hypertrophy (asterisks) and power Doppler (red spots) in the radiocarpal (rc) and intercarpal (ic) joints. (B) The presence of synovial hypertrophy (asterisks) and minimal power Doppler signal (red spots) in the lateral recess of the knee joint. (C) A large bone erosion (arrow) in the lateral aspect of the fifth metatarsal head (mh). f: femur
The current study has some limitations. First, tendons were not included in the current analyses, as they were not systematically evaluated during the initial period of the Leeds CCP study. Second, US bone erosions were not confirmed by radiographs, which is regarded as the reference imaging technique for the detection of bone erosions in patients with RA [44]. However, we recently demonstrated that radiographic bone erosions are extremely rare in CCP+ at-risk and are not predictive for the development of inflammatory arthritis, suggesting that radiographs are not informative in this population [45]. Third, as a consequence of the size and duration of this cohort study, different US operators carried out the US scans during the course of this 15-year study. All US examiners were sonographers or rheumatologists with expertise in the use of MSK US, and all participated in a training session and agreed on the scanning protocol. A formal agreement assessment (i.e. inter- and intra-reliability) between these operators was not carried out.
Conclusions
US is a valuable tool in CCP+ at-risk with MSK symptoms for the prediction of inflammatory arthritis. US synovitis was independently associated with a 3-fold increase risk of inflammatory arthritis development. An US assessment of three joints bilaterally (wrist, knee and MTP5 joint) for synovitis and bone erosions improved prediction of inflammatory arthritis over and above routine clinical and serological risk factors. This novel, concise 6-joint US protocol, which performed similar to an extended research-based US protocol, may offer clinically feasible risk prediction, which could be easily incorporated into routine clinical practice.
Supplementary material
Supplementary material is available at Rheumatology online.
Data availability
The data underlying this article will be shared upon reasonable request to the corresponding author.
Contribution statement
A.D.M. was one of the clinicians of the study, designed the study, collected and analysed data, and wrote the first draft of the manuscript. E.D.L. performed the statistical analysis and contributed to the analysis and interpretation of data. L.D., L.G.-M., K.H. and R.C. were clinicians of the study, and contributed to the collection and analysis of data. J.L.N. was one of the clinicians of the study, contributed to the design of the study and collected data. R.J.W. contributed to the interpretation of data and writing the manuscript. P.E. established the cohort, designed the study and contributed to writing the manuscript. K.M. was one of the clinicians of the study, designed the study, and contributed to the analysis of data and writing the manuscript. All co-authors contributed to revising the manuscript critically and approved the final version to be published.
Funding
The study was supported by the National Institute for Health and Care Research (NIHR) Leeds Biomedical Research Centre (BRC) (grant IS-BRC-1215-20015).
Disclosure statement: R.J.W. has received honoraria from AbbVie, Novartis and GE for US-related educational activities. P.E. reports consultant fees from BMS, AbbVie, MSD, Pfizer, Novartis and Roche, and personal fees from Abbvie, Gilead, Lilly and Novartis, outside the submitted work. He also reports research grants from AbbVie, BMS, Lilly and Samsung. K.M. reports personal fees from Abbvie, Lilly, Galapagos, UCB and Serac Healthcare outside the submitted work, and research grants from Gilead and Lilly. The remaining authors have declared no conflicts of interest.
Acknowledgements
P.E. is NIHR BRC past director and and current workstream lead and BRC funds supported this work. The authors would like to thank Kate Smith, Laura Horton, Borsha Saker and Harjit Ubhi for their contribution with the US exams.
Patient and public involvement: The Leeds CCP study, including biomarkers measured and data collected, has been informed by several patient and public involvement (PPI) meetings where patients and public partners were actively involved. Different potential biomarkers were discussed. The PPI members placed significant importance on the use of clinically practical biomarkers (e.g. imaging and blood tests) in the risk stratification of individuals at-risk of RA. Consideration of patient burden was also raised. PPI group preferences and priorities informed the design and development of the study.

Comments