


Abstract
To identify determinants of neuropsychiatric (NP) flares in patients with SLE treated for active SLE yet no ongoing severe NPSLE with non-biologic standard therapy plus belimumab or placebo.
We analysed data from five phase III trials (BLISS-52, BLISS-76, BLISS-NEA, BLISS-SC, EMBRACE; n = 3638) after exclusion of patients with baseline NP BILAG A. Factors associated with NPSLE flare, defined as a new NP BILAG A or B, were investigated using Cox regression. In a subgroup analysis, we studied patients with baseline NP BILAG E for determinants of de novo NPSLE flare. Organ damage was assessed using the SLICC/ACR Damage Index (SDI).
We documented 105 (2.9%) NPSLE flares. In multivariable analysis, male sex (HR = 2.37; 95% CI: 1.31, 4.28; P = 0.004), baseline NP BILAG B–D (HR = 5.91; 95% CI: 3.86, 9.06; P < 0.001), and increasing SDI scores (HR = 1.35; 95% CI: 1.21, 1.50; P < 0.001) were strongly associated with NPSLE flare. Belimumab use yielded no association at any dose or administration form. In analysis of SDI domains, NP damage was the strongest determinant of NPSLE flare (HR = 3.25; 95% CI: 2.72, 3.88; P < 0.001), holding true for cognitive impairment (HR = 14.29; 95% CI: 9.22, 22.14; P < 0.001), transverse myelitis (HR = 21.89; 95% CI: 5.40, 88.72; P < 0.001), and neuropathy (HR = 8.87; 95% CI: 5.59, 14.09; P < 0.001). Male sex was the strongest determinant of de novo NPSLE flare (HR = 3.26; 95% CI: 1.51, 7.04; P = 0.003).
Male sex, NPSLE history, and NP damage were strong determinants of impending NPSLE flare. No clear protection or predisposition was conferred from add-on belimumab.
Established neuropsychiatric damage at baseline was associated with an increased hazard to develop NPSLE flare.
Current or previous NPSLE activity at baseline was the strongest determinant of impending NPSLE flare.
The potential benefits from belimumab treatment in preventing NPSLE flares remain unclear, warranting future survey.
Introduction
SLE constitutes a prototypical autoimmune disease and is characterized by multiorgan involvement and a variable course [1]. When primarily elicited by SLE, affliction of the nervous system and psychiatric manifestations define a subset of the disease known as neuropsychiatric (NP)SLE [2, 3]. NPSLE affects 30–40% of SLE patients, with differences across studies depending on selection criteria for attribution of symptoms to SLE [4].
Despite advances in the understanding of its pathogenesis, NPSLE remains a major cause of morbidity and mortality in SLE [2]. Being highly heterogeneous and unpredictable, NPSLE flares constitute a challenge for clinicians, and treatment decisions are mainly made on the basis of empiricism [5, 6]. NPSLE flares vary in presentation, ranging from mild conditions, such as headache and subtle cognitive impairment, to severe or even life-threatening events, psychosis, seizure disorders, and cerebrovascular accidents (CVAs), which considerably contribute to overall organ damage and diminished health-related quality of life [7, 8]. Identification of clinical features and serological markers that are predictive of NPSLE flares would contribute to early detection of NP involvement, early initiation of treatment, and hopefully, improved outcomes [9, 10]. Previous studies have attempted to address this knowledge gap and proposed potential risk factors for NPSLE flares, but results have been inconsistent, leaving space for further survey [11–14].
Belimumab is a human monoclonal antibody that binds to and inhibits the activity of B-cell activating factor belonging to the TNF ligand family (BAFF), a cytokine that is crucial for B-cell survival and proliferation and is believed to be important in SLE pathogenesis [15–17]. Belimumab was the first biologic to be approved for active SLE [18, 19], and several studies have demonstrated its ability to induce disease control and prevent SLE flares [20–23]. However, since phase III trials of belimumab excluded patients with severe CNS involvement, little is known about the potential benefits of this drug in the treatment of NPSLE, and data are so far controversial [24–26].
In this work, we aimed to identify determinants of NPSLE flares in patients with SLE treated with non-biological standard therapy (ST) plus belimumab or placebo for active disease, yet no severe active CNS involvement or severe active lupus nephritis (LN), in a large population deriving from five phase III clinical trials [27–31]. We additionally aimed to determine the ability of belimumab to protect against NPSLE events.
Materials and methods
Study design and population
We designed a post-hoc analysis of data from five phase III randomized controlled trials (RCTs) of belimumab with similar design and endpoints i.e. BLISS-52 (NCT00424476; n = 865) [27], BLISS-76 (NCT00410384; n = 819) [28], BLISS-NEA (NCT01345253; n = 677) [29], BLISS-SC (NCT01484496; n = 836) [30], and EMBRACE (NCT01632241; n = 448) [31]. We considered the first 52 weeks of follow-up from all trials.
Study participants fulfilled the ACR revised criteria for SLE, were adults, had an ANA titre ≥1:80 and/or a serum anti-dsDNA antibody level ≥30 IU/ml at screening, and a Safety of Estrogens in Lupus National Assessment (SELENA)-SLEDAI score ≥6 (BLISS-52, BLISS-76) or ≥8 (BLISS-SC, BLISS-NEA, EMBRACE). All patients were on stable non-biological ST for ≥30 days prior to baseline. Patients with severe active CNS involvement or severe active LN were excluded. Patients were randomized to receive i.v. belimumab 1 mg/kg, i.v. belimumab 10 mg/kg, or placebo on top of ST in BLISS-52 and BLISS-76. In BLISS-NEA and EMBRACE, patients received i.v. belimumab 10 mg/kg or placebo on top of ST. In BLISS-SC, patients received weekly doses of s.c. belimumab 200 mg or placebo in addition to ST.
Upon exclusion of patients with NP BILAG [32] A at baseline (n = 7), the total study population comprised 3638 SLE patients. In a subgroup analysis, we studied patients with NP BILAG E at baseline (n = 3276) to identify factors associated with impending de novo NPSLE flares.
Ethics
Data from the BLISS trials were made available by GlaxoSmithKline (Uxbridge, UK) through the CSDR consortium. Written informed consent was obtained from all study participants prior to enrolment. The trial protocols were reviewed and approved by regional ethics review boards for all participating centres and complied with ethical principles of the Declaration of Helsinki. The protocol for the present post-hoc analysis was approved by the Swedish Ethical Review Authority (2019–05498).
Clinical definitions
Current or previous NP involvement was defined as NP BILAG A–D score at baseline, while no history of NPSLE was defined as NP BILAG E.
In the absence of a universally accepted definition of NPSLE flare, we herein applied the proposed classic BILAG index-based definition of SLE flares by Gordon et al. [33]. Hence, we defined NPSLE flare as the development of any new NP BILAG A in patients with baseline NP BILAG B or the development of any new NP BILAG A or B in patients with baseline NP BILAG C–E during the 52-week study follow-up.
Global SLE disease activity was assessed using the SLEDAI 2000 (SLEDAI-2K), and clinical disease activity was assessed using the clinical version of SLEDAI-2K (cSLEDAI-2K) [34], in which the serological descriptors (DNA binding and low complement levels) are suppressed. Organ damage was assessed using the SLICC/ACR Damage Index (SDI) [35].
Demographics and clinical features
Demographics and baseline clinical features evaluated as potential determinants of NPSLE flares included age, sex, ancestry, SLE disease duration, NP involvement, cSLEDAI-2K score, and SDI score. We also evaluated mean BMI from baseline through week 52.
Background medications included antimalarial agents (AMA), glucocorticoids and immunosuppressants. Glucocorticoid intake was assessed as the mean prednisone equivalent dose from baseline until the first occurrence of an NPSLE flare, or at week 52 if no NPSLE flare occurred.
Serological markers
We investigated traditional serological markers as potential determinants of NPSLE flare occurrence. These included the presence of anti-dsDNA antibodies (≥30.0 IU/mL); anti-Smith (Sm) antibodies (≥15.0 IU/mL); anti-RNP antibodies (≥25.0 IU/mL); anti-ribosomal P antibodies (≥12.0 IU/mL in BLISS-52; ≥12.4 IU/mL in BLISS-76; ≥12.5 IU/mL in BLISS-SC); aPL antibodies (presence of any), aCL IgA (≥10.0 IU/mL in BLISS-52 and BLISS-76; ≥11.0 IU/mL in BLISS-NEA, BLISS-SC and EMBRACE), IgG (≥10.0 IU/mL in BLISS-52 and BLISS-76; ≥14.0 IU/mL in BLISS-NEA, BLISS-SC and EMBRACE) and IgM antibodies (≥10.0 IU/mL in BLISS-52 and BLISS-76; ≥12.0 IU/mL in BLISS-NEA, BLISS-SC and EMBRACE), anti-β2-glycoprotein I (β2-GPI) IgA, IgG, and IgM antibodies (≥21.0 IU/mL for all Ig isotypes) and lupus anticoagulant (LAC) (≥45.0 IU/mL in BLISS-SC; ≥41.0 IU/mL in EMBRACE). We also investigated low levels of C3 (<90.0 mg/dL), low levels of C4 (<16.0 mg/dL in BLISS-52 and BLISS-76; <10.0 mg/dL in BLISS-NEA, BLISS-SC and EMBRACE) and serum BAFF levels.
Statistical analysis
Descriptive statistics are reported as numbers (percentage) or means (S.D.), and medians (interquartile range) are indicated in case of non-normal distributions. For comparisons between patients who developed an NPSLE flare and patients who did not, the non-parametrical Mann–Whitney U test was used for continuous variables and the Pearson’s chi-squared (χ2) test for binomial variables. For comparisons between belimumab and placebo, placebo-treated patients in the respective trials formed the comparator groups.
Determinants of NPSLE flare occurrence were investigated using univariable and multivariable proportional hazards (Cox) regression analysis. P values <0.05 were deemed statistically significant.
Items with sufficient available values (<5% missing data) showing a statistically significant association (P < 0.05) with occurrence of NPSLE flare in univariable models were further evaluated in multivariable Cox regression analysis to assess priority and account for confounding potentiality. Age, sex and ethnicity were always included as covariates in multivariable models, regardless of results in univariable analysis. Results from Cox regression analysis are presented as the coefficient, hazard ratio (HR), 95% CI, and P-value.
Analyses were performed and illustrations were developed using the R Statistical Software version 4.2.1 (R Foundation for Statistical Computing, Vienna, Austria).
Results
A total of 3638 patients formed the population of the present investigation. Demographics, clinical features and serological profiles for the pooled study population along with comparisons between patients who experienced an NPSLE flare during follow-up and patients who did not are presented in Table 1 and separately for each belimumab trial in Supplementary Tables S1–S5, available at Rheumatology online. Baseline clinical features within the NP domain and clinical evolution of NP symptoms in the seven patients with baseline NP BILAG A who were excluded from analysis are detailed in Supplementary Table S6, available at Rheumatology online.
Comparisons between patients who displayed NPSLE flares and patients who did not during follow-up.
| All patients | NPSLE flare | No NPSLE flare | P value | |
|---|---|---|---|---|
| (n = 3638) | (n = 105) | (n = 3533) | ||
| Patient characteristics | ||||
| Age; mean (S.D.) | 37.0 (11.6) | 40.1 (11.3) | 36.9 (11.6) | 0.003 |
| Female sex; n (%) | 3431 (94.3) | 92 (87.6) | 3339 (94.5) | 0.005 |
| Ethnicity; n (%) | ||||
| Asian | 1213 (33.3) | 12 (11.4) | 1201 (34.0) | <0.001 |
| Black/African American | 678 (18.6) | 21 (20.0) | 657 (18.6) | 0.813 |
| Indigenous Americana | 450 (12.4) | 17 (16.2) | 433 (12.3) | 0.291 |
| White/Caucasian | 1297 (35.7) | 55 (52.4) | 1242 (35.2) | <0.001 |
| Clinical data at baseline | ||||
| SLE duration (years); median (IQR) | 4.5 (1.6–9.3); n =3637 | 3.6 (1.3–8.8) | 4.5 (1.6–9.3); n =3532 | 0.613 |
| Mean BMI (week 0–52); mean (S.D.) | 25.7 (6.2); n =3532 | 28.6 (7.1); n =103 | 25.6 (6.1); n =3429 | <0.001 |
| NP BILAG score; n (%) | ||||
| B | 21 (0.6) | 1 (1.0) | 20 (0.6) | 1.000 |
| C | 302 (8.3) | 50 (47.6) | 252 (7.1) | <0.001 |
| D | 39 (1.1) | 2 (1.9) | 37 (1.0) | 0.719 |
| E | 3276 (90.0) | 52 (49.5) | 3224 (91.3) | <0.001 |
| SLEDAI-2K; mean (S.D.) | 10.3 (3.7) | 11.6 (4.6) | 10.3 (3.6) | 0.005 |
| cSLEDAI-2K; mean (S.D.) | 7.7 (3.5) | 9.5 (4.5) | 7.7 (3.4) | <0.001 |
| NP SLEDAI-2K; mean (S.D.) | 0.1 (1.1) | 1.6 (3.6) | 0.1 (0.9) | <0.001 |
| seizure; n (%) | 0 (0.0) | 0 (0.0) | 0 (0.0) | NA |
| psychosis; n (%) | 3 (0.1) | 0 (0.0) | 3 (0.1) | 1.000 |
| organic brain syndrome; n (%) | 8 (0.2) | 5 (4.8) | 3 (0.1) | <0.001 |
| visual disturbance; n (%) | 11 (0.3) | 2 (1.9) | 9 (0.3) | 0.033 |
| cranial nerve disorder; n (%) | 5 (0.1) | 1 (1.0) | 4 (0.1) | 0.342 |
| lupus headache; n (%) | 32 (0.9) | 13 (12.4) | 19 (0.5) | <0.001 |
| cerebrovascular accident; n (%) | 0 (0.0) | 0 (0.0) | 0 (0.0) | NA |
| SDI score ≥1; n (%) | 1294 (35.6); n =3636 | 77 (73.3) | 1217 (34.5); n =3531 | <0.001 |
| SDI score; median (IQR) | 0.0 (0.0–1.0); n =3636 | 0.0 (0.0–1.0) | 0.0 (0.0–1.0); n =3531 | <0.001 |
| Serological profile at baseline | ||||
| Anti-dsDNA (+); n (%) | 2589 (71.2) | 64 (61.0) | 2525 (71.5) | 0.025 |
| Anti-Sm (+); n (%) | ||||
| at baseline | 775 (31.0); n =2503 | 29 (31.2); n =93 | 746 (31.0); n =2410 | 1.000 |
| ever | 778 (31.1); n =2505 | 29 (31.2); n =93 | 749 (31.1); n =2412 | 1.000 |
| Anti-RNP (+); n (%) | ||||
| at baseline | 410 (32.5); n =1262 | 8 (30.8); n =26 | 402 (32.5); n =1236 | 1.000 |
| ever | 411 (32.5); n =1265 | 8 (30.8); n =26 | 403 (32.5); n =1239 | 1.000 |
| Anti-ribosomal P (+); n (%) | ||||
| at baseline | 970 (33.4); n =2905 | 23 (23.5); n =98 | 947 (33.7); n =2807 | 0.044 |
| ever | 971 (33.4); n =2905 | 23 (23.5); n =98 | 948 (33.8); n =2807 | 0.044 |
| aPL (+); n (%) | ||||
| aCL | ||||
| aCL IgA | 67 (1.9); n =3494 | 3 (3.0); n =100 | 64 (1.9); n =3394 | 0.667 |
| aCL IgG | 497 (14.2); n =3500 | 18 (17.8); n =101 | 479 (14.1); n =3399 | 0.362 |
| aCL IgM | 327 (9.3); n =3500 | 11 (10.9); n =101 | 316 (9.3); n =3399 | 0.713 |
| anti-β2-GPI | ||||
| anti-β2-GPI IgA | 232 (18.3); n =1270 | 1 (3.7); n =27 | 231 (18.6); n =1243 | 0.084 |
| anti-β2-GPI IgG | 32 (2.5); n =1270 | 0 (0.0); n =27 | 32 (2.6); n =1243 | 0.883 |
| anti-β2-GPI IgM | 73 (5.7); n =1270 | 0 (0.0); n =27 | 73 (5.9); n =1243 | 0.379 |
| LAC | 219 (17.5); n =1255 | 4 (14.8); n =27 | 215 (17.5); n =1228 | 0.914 |
| aPL (+) ever | 1273 (36.3); n =3504 | 32 (31.7); n =101 | 1241 (36.5); n =3403 | 0.379 |
| BAFF (ng/mL); median (IQR) | 1.2 (0.9–1.8); n =3164 | 1.48 (1.1–2.2); n =95 | 1.2 (0.8–1.8); n =3069 | 0.001 |
| Low C3 levels; n (%) | 1746 (48.0) | 33 (31.4) | 1713 (48.5) | 0.001 |
| Low C4 levels; n (%) | 1444 (39.7) | 39 (37.1) | 1405 (39.8) | 0.660 |
| Medications | ||||
| Prednisone equivalent dose during follow-up (mg/day); median (IQR) | 10.0 (5.3–15.0) | 10.0 (5.0–16.3) | 10.00 (5.4–15.0) | 0.498 |
| AMAb at baseline; n (%) | 2513 (69.1) | 64 (61.0) | 2449 (69.3) | 0.085 |
| Immunosuppressants at baseline; n (%) | ||||
| Azathioprine | 723 (19.9) | 19 (18.1) | 704 (19.9) | 0.734 |
| Methotrexate | 432 (11.9) | 17 (16.2) | 415 (11.7) | 0.217 |
| Mycophenolate mofetil | 579 (15.9) | 17 (16.2) | 652 (15.9) | 1.000 |
| Oral cyclophosphamide | 58 (1.6) | 4 (3.8) | 54 (1.5) | 0.149 |
| Tacrolimus | 97 (2.7) | 1 (1.0) | 96 (2.7) | 0.424 |
| Cyclosporine | 93 (2.6) | 2 (1.9) | 91 (2.6) | 0.908 |
| Leflunomide | 102 (2.8) | 0 (0.0) | 102 (2.9) | 0.143 |
| Trial intervention; n (%) | ||||
| Placebo | 1216 (33.4) | 32 (30.5) | 1184 (33.5) | 0.586 |
| Belimumab | 2422 (66.6) | 73 (69.5) | 2349 (66.5) | 0.586 |
| IV 1 mg/kg | 556 (15.3) | 21 (20.0) | 535 (15.1) | 0.220 |
| IV 10 mg/kg | 1311 (36.0) | 41 (39.0) | 1270 (35.9) | 0.583 |
| SC 200 mg | 555 (15.3) | 11 (10.5) | 544 (15.4) | 0.213 |
| Belimumab approved dose; n (%) | 1866 (60.5); n =3082 | 52 (61.9); n =84 | 1814 (60.5); n =2998 | 0.884 |
Data are presented as numbers (percentage) or means (standard deviation). In case of non-normal distributions, the medians (interquartile range) are indicated. In case of missing values, numbers of patients with available data are indicated. Statistically significant P values are in bold.
Alaska Native or American Indian from North, South or Central America.
Hydroxychloroquine, chloroquine, mepacrine, mepacrine hydrochloride, or quinine sulphate.
(+): positive levels; aCL: anticardiolipin antibodies; AMA: antimalarial agents; anti-dsDNA: anti-double-stranded DNA antibodies; anti-Sm: anti-Smith antibodies; anti-RNP: anti-ribonucleoprotein antibodies; anti-β2-GPI: anti-β2-glycoprotein I antibodies; aPL: antiphospholipid antibodies; BAFF: B cell activating factor belonging to the TNF ligand family; cSLEDAI-2K: clinical SLEDAI-2K; C3: complement component 3; C4: complement component 4; Ig: immunoglobulin; IQR: interquartile range; IV: intravenous; LAC: lupus anticoagulant; NA: not applicable; NP: neuropsychiatric; SC: subcutaneous; SDI: SLICC/ACR Damage Index; SLEDAI-2K: SLEDAI 2000.
Determinants of NPSLE flare in the pooled study population
During the 52-week follow-up, 105 (2.9%) patients developed an NPSLE flare. Of those, 59 patients (56.2%) developed an NP BILAG A score, and 46 patients (43.8%) developed an NP BILAG B score. The proportion of patients experiencing an NPSLE flare did not differ across treatment arms (Fig. 1A), neither was any difference noted in the comparison between i.v. belimumab-treated patients and patients from the same trials who received placebo (62 [3.3%] vs 24 [2.6%]; P = 0.327). The nature and frequency of NP BILAG items at the time of flare are detailed in Supplementary Table S7, available at Rheumatology online; no differences were noted between belimumab-treated patients and patients who received placebo. In univariable Cox regression analysis, age (HR = 1.02; 95% CI: 1.01, 1.04; P = 0.005), male sex (HR = 2.37; 95% CI: 1.33, 4.24; P = 0.004), mean BMI (HR = 1.06; 95% CI: 1.04, 1.09; P < 0.001), baseline NP BILAG B–D (HR = 9.86; 95% CI: 6.72, 14.45; P < 0.001), increasing cSLEDAI-2K scores at baseline (HR = 1.13; 95% CI: 1.08, 1.18; P < 0.001) and increasing SDI scores at baseline (HR = 1.57; 95% CI: 1.44, 1.71; P < 0.001) were associated with NPSLE flare occurrence in the pooled study population. Conversely, Asian ethnicity (HR = 0.23; 95% CI: 0.12, 0.43; P < 0.001), presence of anti-dsDNA antibodies at baseline (HR = 0.63; 95% CI: 0.42, 0.93 P = 0.020), presence of anti-ribosomal P protein antibodies at baseline (HR = 0.61; 95% CI: 0.38, 0.97; P = 0.035) or at any timepoint during the study period (HR = 0.60; 95% CI: 0.38, 0.96; P = 0.035), and low C3 levels at baseline (HR = 0.49; 95% CI: 0.33, 0.74; P < 0.001) yielded a lower hazard for NPSLE flare.
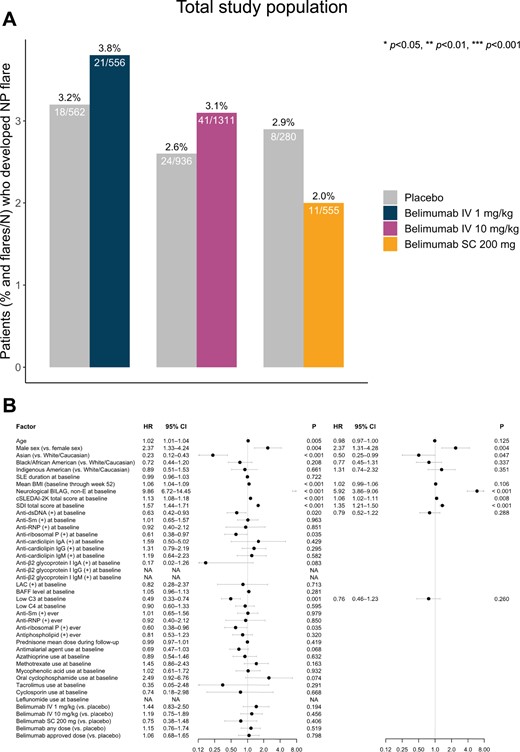
Factors associated with NPSLE flare development in the pooled population of the belimumab trials. (A) Bars depicting proportions of patients who developed at least one NPSLE flare during follow-up in patient subgroups exposed to belimumab treatment of different dosage forms compared with patients from the same studies treated with placebo. (B) Forest plots illustrating results from univariable (left) and multivariable (right) Cox regression analysis, investigating determinants of NPSLE flare development.(+): positive levels; anti-dsDNA: anti-double-stranded DNA antibodies; anti-RNP: anti-ribonucleoprotein antibodies; anti-Sm: anti-Smith antibodies; BAFF: B-cell activating factor belonging to the TNF ligand family; C3: complement component 3; C4: complement component 4; cSLEDAI-2K: clinical SLEDAI 2000; HR: hazard ratio; Ig: immunoglobulin; IV: intravenous; LAC: lupus anticoagulant; NA: not applicable; NP: neuropsychiatric; NPSLE: neuropsychiatric SLE; SC: subcutaneous; SDI: SLICC/ACR Damage Index
Belimumab use at any dose or administration form displayed no clear protection against NPSLE flare occurrence (HR = 1.15; 95% CI: 0.76, 1.74; P = 0.519). Similarly, treatment with the licenced doses of i.v. belimumab 10 mg/kg (HR = 1.19; 95% CI: 0.75, 1.89; P = 0.456) and s.c. belimumab 200 mg (HR = 0.75; 95% CI: 0.38, 1.48; P = 0.406), or the non-licenced low-dose i.v. belimumab 1 mg/kg (HR = 1.44; 95% CI: 0.83, 2.50; P = 0.194) yielded no statistically significant protection against NPSLE flare occurrence (Fig. 1B; Supplementary Table S8, available at Rheumatology online).
In multivariable Cox regression analysis, male sex (HR = 2.37; 95% CI: 1.31, 4.28; P = 0.004), NP BILAG B–D at baseline (HR = 5.91; 95% CI: 3.86, 9.06; P < 0.001), increasing baseline cSLEDAI-2K scores (HR = 1.06; 95% CI: 1.02, 1.11; P = 0.008) and increasing baseline SDI scores (HR = 1.35; 95% CI: 1.21, 1.50; P < 0.001) were independent determinants of NPSLE flare occurrence, whereas Asian ethnicity was protective against NPSLE flare (HR = 0.51; 95% CI: 0.25, 0.99; P = 0.047). Results are illustrated in Fig. 1B and detailed in Supplementary Tables S8 and S9, available at Rheumatology online. The same analysis upon exclusion of patients in whom the NPSLE flare consisted of severe unremitting lupus headache identified the same independent determinants of NPSLE flare, with the exception of increasing cSLEDAI-2K scores for which the association did not reach statistical significance. Details are provided in Supplementary Tables S10 and S11, available at Rheumatology online.
Determinants of de novo NPSLE flare
We investigated determinants of de novo NPSLE flare in a subgroup analysis of patients with SLE who were naive to NP history, defined as a NP BILAG E score at baseline (n = 3276). At week 52, a total of 52 (1.6%) patients had developed a de novo NPSLE flare. The proportion of patients who received belimumab at any dose or administration form and experienced a de novo NPSLE flare did not differ from the proportion of placebo recipients in the same studies who experienced a de novo NPSLE flare (Fig. 2A). Similarly, no significant difference was found between the proportion of observed de novo NPSLE flares in the subgroup of i.v. belimumab-treated patients and the respective proportion in patients who received placebo from the same trials (32 [1.9%] vs 8 [0.9%]; P = 0.092). In the univariable model, variables that were positively associated with de novo NPSLE flare occurrence included male sex (HR= 3.03; 95% CI: 1.43, 6.45; P = 0.004), mean BMI (HR = 1.06; 95% CI: 1.03, 1.10; P < 0.001) and increasing baseline SDI scores (HR = 1.57; 95% CI: 1.38, 1.78; P < 0.001). Asian ethnicity (HR = 0.42; 95% CI: 0.19, 0.92; P = 0.031) was protective against de novo NPSLE flare (Fig. 2B; Supplementary Table S12, available at Rheumatology online). No statistically significant signals of protection conferred from belimumab treatment were documented for any drug dose or administration form.
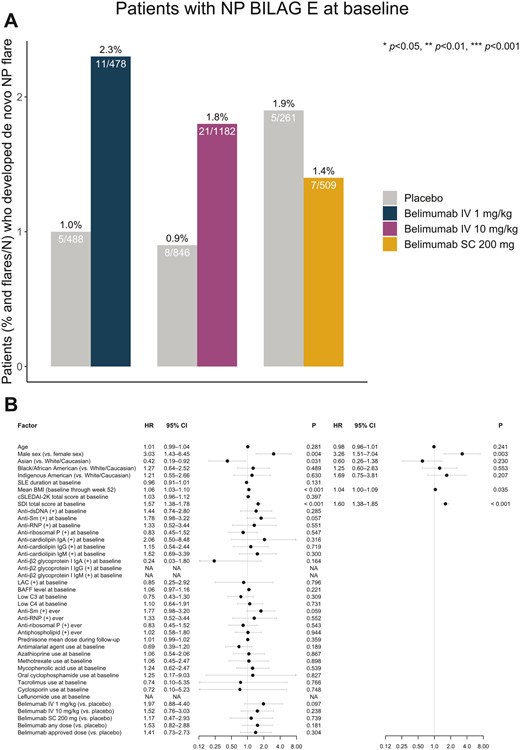
Factors associated with de novo NPSLE flare development. (A) Bars depicting proportions of baseline NP BILAG E patients who developed at least one de novo NPSLE flare during follow-up in patient subgroups exposed to belimumab treatment of different dosage forms compared with patients from the same studies treated with placebo. (B) Forest plots illustrating results from univariable (left) and multivariable (right) Cox regression analysis, investigating determinants of de novo NPSLE flare development in the baseline NP BILAG E population.(+): positive levels; anti-dsDNA: anti-double-stranded DNA antibodies; anti-RNP: anti-ribonucleoprotein antibodies; anti-Sm: anti-Smith antibodies; BAFF: B-cell activating factor belonging to the TNF ligand family; C3: complement component 3; C4: complement component 4; cSLEDAI-2K: clinical SLEDAI 2000; HR: hazard ratio; Ig: immunoglobulin; IV: intravenous; LAC: lupus anticoagulant; NA: not applicable; NP: neuropsychiatric; NPSLE: neuropsychiatric SLE; SC: subcutaneous; SDI: SLICC/ACR Damage Index
In the multivariable Cox regression model, male sex (HR = 3.26; 95% CI: 1.51, 7.04; P = 0.003), mean BMI (HR = 1.04; 95% CI: 1.00, 1.09; P = 0.035) and increasing baseline SDI scores (HR = 1.60; 95% CI: 1.38, 1.85; P < 0.001) were independent determinants of de novo NPSLE flare occurrence (Fig. 2B; Supplementary Table S13, available at Rheumatology online). Similar results were yielded upon exclusion of patients who experienced severe unremitting lupus headache at the time of the NPSLE flare. Details are provided in Supplementary Tables S14 and S15, available at Rheumatology online.
Analysis of SDI domains and items
To assess the contribution of organ damage within different organ domains to the risk of NPSLE flare, we dissected the SDI total score into scores within organ domains. Whenever an association between organ damage within a certain domain was detected, separate analyses were conducted for each one of the SDI items within the respective domain. Results are illustrated in Fig. 3 and detailed in Supplementary Tables S16 and S17, available at Rheumatology online.
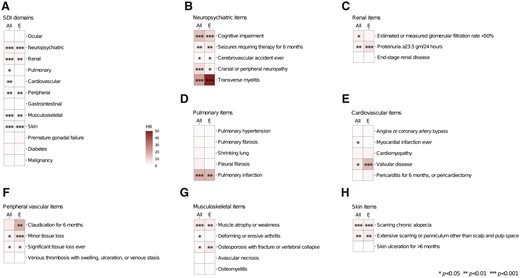
Hazards for NPSLE flare occurrence in relation to organ damage accrual. Heat maps illustrating hazard ratios deriving from Cox regression analysis investigating associations between SDI organ domain scores and occurrence of NPSLE flares (A), as well as between SDI items and occurrence of NPSLE flares (B–H) in the entire study population (left columns) and in the baseline NP BILAG E population (right columns). Asterisks indicate statistically significant associations.HR: hazard ratio; SDI: SLICC/ACR Damage Index
Organ damage in the NP domain at baseline was strongly associated with the occurrence of NPSLE flare during follow-up in the pooled study population (HR = 3.25; 95% CI: 2.72, 3.88; P < 0.001). All SDI items within the NP domain were predictive of NPSLE flare occurrence, with transverse myelitis (HR = 21.89; 95% CI: 5.40, 88.72; P < 0.001), cognitive impairment (HR = 14.29; 95% CI: 9.22, 22.14; P < 0.001) and neuropathy (HR = 8.87; 95% CI: 5.59, 14.09; P < 0.001) displaying the strongest associations, followed by seizures (HR = 4.13; 95% CI: 1.68, 10.15; P = 0.002) and CVA (HR = 1.97; 95% CI 1.05, 3.71; P = 0.035). Similar results were retrieved in the subgroup analysis of the NP BILAG E population, where baseline transverse myelitis (HR = 49.58; 95% CI: 6.84, 359.54; P < 0.001) and cognitive impairment (HR = 10.00; 95% CI: 4.27, 23.41; P < 0.001) were the strongest determinants of de novo NPSLE flare occurrence.
In addition, established organ damage within the renal (HR = 2.80; 95% CI: 1.61, 4.89; P < 0.001), pulmonary (HR = 1.99; 95% CI: 1.05, 3.75; P = 0.034), cardiovascular (HR = 1.96; 95% CI: 1.25, 3.06; P = 0.003), peripheral vascular (HR = 2.07; 95% CI: 1.32, 3.26; P = 0.002), musculoskeletal (HR = 1.76; 95% CI: 1.34, 2.33; P < 0.001) and skin domains (HR = 2.20; 95% CI: 1.54, 3.17; P < 0.001) was predictive of development of NPSLE flares in the pooled study population. Organ damage in the same SDI domains was also predictive of de novo NPSLE flare occurrence, with the exception of the pulmonary and cardiovascular domains where no significant associations were documented.
Discussion
In the present post-hoc analysis, we investigated determinants of NPSLE flare occurrence in a large international and multi-ethnic population of SLE deriving from phase III clinical trials. Male sex was a strong determinant of NPSLE flare as well as of de novo NPSLE flare occurrence, and these associations remained significant after adjustments in multivariable models. While this finding may not be unexpected given the strong hormonal component of SLE pathogenesis with the disease being less common yet usually more severe in men [36], it bears important implications for clinical practice to unveil this sex-specific burden imposed on NPSLE disease evolution. Therefore, in addition to monitoring the renal domain [37], it is crucial to maintain vigilant surveillance of NPSLE activity in men with SLE.
We observed overall lower frequencies of NPSLE flare occurrence in Asian patients, while Asian ethnicity was negatively associated with the development of NPSLE flare in the pooled study population after accounting for the time to the first NPSLE flare in Cox regression analysis, indicating that the susceptibility to NPSLE may differ across different ethnic groups. Our findings are in conformity with a previous study by Hanly et al. [13], where similar associations were seen between male sex or Asian ethnicity and occurrence of NSPLE events. This calls for future surveys aimed at gaining comprehensive insights.
High SLE disease activity and established organ damage were predictive of NPSLE flare occurrence in the pooled study population. In this respect, it is worth noting that patients experiencing an NPSLE flare displayed higher baseline NP SLEDAI-2K scores compared with patients who did not flare, implying that baseline NP activity could have been a significant driver of the association between SLEDAI-2K and NPSLE flare. In line with this, we found that current or previous NPSLE activity and established organ damage in the NP domain were the strongest determinants of NPSLE flare development. These results are in conformity with previous studies [9, 14, 38], where high disease activity was found to be linked with NPSLE manifestations and organ damage within the NP domain.
Low baseline C3 levels were negatively associated with NPSLE flare occurrence, but this association did not reach statistical significance after adjustment for confounders. While a relationship between low complement levels and NPSLE has been reported in some studies, data in literature have been conflicting [11, 12, 38, 39]. In a recent work by Aso et al., low serum levels of C4 at the time of SLE diagnosis represented a risk factor for severe NPSLE flare [11]. Similarly, Karassa et al. reported an association between low C3 or C4 levels and CNS involvement [38]. By contrast, Dong et al. [39] reported no association between complement levels and NPSLE flares, and Yu et al. [12] demonstrated that a decrease in C3 levels was protective against the development of NPSLE; these studies comprised paediatric SLE populations. These discrepant findings may be, at least in part, due to different cut-off values used to define low complement levels, as well as differences regarding the attribution of neurological symptoms to SLE across studies. While for other SLE manifestations, such as LN, the activation of the complement cascade is an established major pathogenetic driver, its connection with NPSLE is yet to be further clarified [2].
We investigated positive levels of anti-dsDNA, anti-Sm, anti-ribosomal P, anti-RNP and aPL (aCL, anti-β2-GPI, LAC) antibodies at baseline as determinants of impending NPSLE flare. Notably, none of these markers predicted either recurrent or de novo NPSLE activity. Given that NPSLE pathogenesis encompasses a variety of underlying mechanisms, it is unlikely that a certain autoantibody profile would indiscriminately predict NPSLE involvement. Clinical and experimental evidence suggests that different autoantibodies may be directly related to specific NPSLE manifestations [3]. In this regard, aPL have been implicated in focal NPSLE manifestations, such as CVA and seizures, through autoantibody-mediated thrombotic events [9, 40, 41]. Moreover, anti-ribosomal P antibodies have been linked to a variety of NPSLE syndromes, such as psychosis and mood disorders, through epitope binding to neurons within brain regions of the limbic system [42, 43]. One reason for the lack of significant associations between the traditional autoantibody specificities investigated in the present study and NPSLE flare occurrence may have been the considerable proportions of missing data across these variables, which limited our power to obtain solid answers.
The potential benefit from belimumab treatment against NPSLE events has not been thoroughly studied. In this study, addition of belimumab to ST did not offer any clear protection from the occurrence of an NPSLE flare. Potentially related to this finding, we observed no association between baseline serum levels of BAFF, i.e. the target of belimumab, and impending NPSLE flare. While serum BAFF was previously shown to be elevated in SLE patients with CNS disease compared with SLE patients with no current CNS involvement [44], investigations of serum BAFF as a marker of treatment response in NSPLE are lacking [45], thus making conclusions on the potential implications of our observation hard to draw, leaving space for further survey. In a previous post-hoc analysis of the BLISS-52 and BLISS-76 trials, belimumab treatment was associated with improvement in a small number of patients with NPSLE activity at baseline, which in most cases consisted of lupus headache [46]. Recently, the published results from the Belimumab Assessment of Safety in SLE (BASE) trial, a phase IV trial conducted to assess safety of i.v. belimumab 10 mg/kg, reported an increased risk of adverse psychiatric events in SLE patients under belimumab therapy, particularly serious depression, treatment-emergent suicidality and self-injury events [47]. However, a meta-analysis of RCTs in patients with SLE receiving belimumab found no increased risk for overall or serious psychiatric disorders related to belimumab therapy at any dose, including suicidal ideation and depression [24]. Nevertheless, recommendations for the use of belimumab advise caution in patients with history of pre-existing mental disorder [24, 47]. In the present investigation, we found no difference in the frequency or nature of NP BILAG items observed in belimumab-treated patients compared with placebo recipients, including organic depressive illness. In a previous post-hoc analysis of the BLISS-52 and BLISS-76 trials from our group, low-dose i.v. belimumab 1 mg/kg, but not the licensed i.v. belimumab 10 mg/kg dose, was demonstrated to be associated with a response of ‘no problem’ in the anxiety/depression dimension of the EQ-5D health questionnaire [48]. Taken together, these results point against an association between belimumab and adverse psychiatric events and warrant future investigation of potential benefits from belimumab, including differential protection conferred from different belimumab dosages.
Among limitations of this study was its post-hoc nature, which may have hampered the power in statistical analyses. In addition, the trials comprised a selected population of SLE patients, limiting the generalizability of our findings. The BLISS trials were not designed to specifically evaluate the effects of belimumab on NPSLE, nor were they designed to determine predictors of NPSLE flares. The lack of data on investigations in support of the diagnosis of NPSLE [e.g. neuroimaging such as MRI, or analysis of cerebrospinal fluid (CSF)] prevented us from ascertaining a definite NPSLE flare. It should also be noted that while the definition of NPSLE flare used herein captures new NP BILAG A or B, worsening of pre-existing NP items or development of new NP BILAG items yielding an NP BILAG score that equals that of baseline is not captured. This was an intrinsic limitation of the classic BILAG index-based definition of SLE flare [33], which was later overcome by the BILAG 2004 index-based SLE flare assessment [49]; though, the latter definition was not applicable to the data that were available for analysis in the present investigation.
Nevertheless, our analyses encompassed a large and diverse patient population from across the globe, followed up within the frame of controlled trial programmes. This guaranteed reliability of acquired data and allowed us to perform multivariable regression analyses adjusting for a relatively large number of potential confounders.
To summarize, we showed that male sex, current or previous NPSLE activity, and established organ damage in the NP domain were robust determinants of NPSLE flare development in SLE patients treated for active disease yet no ongoing severe NP involvement. Our findings bear important implications for clinical practice, calling for attentive surveillance of NPSLE activity in male SLE patients, as well as in patients with a history of NPSLE and in patients with established damage in the NP domain. In this study, we were unable to demonstrate a clear protection from belimumab against NPSLE flares, leaving space for further survey, desirably in a prospective real-world setting.
Supplementary material
Supplementary material is available at Rheumatology online.
Data availability
The datasets used and analysed during the current study are available from the corresponding author upon reasonable request.
Contribution statement
Conception and design of the work: J.L., I.P. Acquisition of data: J.L., N.C., I.P. Statistical analysis and interpretation of data: L.P., J.L., N.C., H.A., I.P. Original draft: L.P., J.L., I.P. Critical revision of the manuscript for important intellectual content: all authors. All authors reviewed and approved the final version of the manuscript prior to submission and agree to be accountable for all aspects of the work.
Funding
This work was supported by grants from the Swedish Rheumatism Association (R-969696), King Gustaf V’s 80-year Foundation (FAI-2020–0741), Swedish Society of Medicine (SLS-974449), Nyckelfonden (OLL-974804), Professor Nanna Svartz Foundation (2021–00436), Ulla and Roland Gustafsson Foundation (2021–26), Region Stockholm (FoUI-955483) and Karolinska Institutet.
Disclosure statement: I.P. has received research funding and/or honoraria from Amgen, AstraZeneca, Aurinia Pharmaceuticals, Elli Lilly and Company, Gilead Sciences, GlaxoSmithKline, Janssen Pharmaceuticals, Novartis, Otsuka Pharmaceutical and F. Hoffmann-La Roche AG. The other authors declare that they have no conflicts of interest related to this work. The funders had no role in the design of the study, the analyses or interpretation of data, or the writing of the manuscript.
Acknowledgements
The authors would like to thank GlaxoSmithKline for providing data from the BLISS-52 (NCT00424476), BLISS-76 (NCT00410384), BLISS-SC (NCT01484496), BLISS-NEA (NCT01345253) and EMBRACE (NCT01632241) trials through the CSDR consortium, and all patients with SLE who participated in the trials.

Comments