


Abstract
Joint involvement in SLE is the most frequent manifestation and shows a wide heterogeneity. It has not a valid classification and it is often underestimated. Subclinical inflammatory musculoskeletal involvement is not well known. We aim to describe the prevalence of joint and tendon involvement in hand and wrist of SLE patients, either with clinical arthritis, arthralgia or asymptomatic and compare it with healthy subjects using contrasted MRI.
SLE patients fulfilling SLICC criteria were recruited and classified as follows: group (G) 1: hand/wrist arthritis, G2: hand/wrist arthralgia, G3: no hand/wrist symptoms. Jaccoud arthropathy, CCPa and RF positivity, hand OA or surgery were excluded. Healthy subjects (HS) were recruited as controls: G4. Contrasted MRI of non-dominant hand/wrist was performed. Images were evaluated following RAMRIS criteria extended to PIP, Tenosynovitis score for RA and peritendonitis from PsAMRIS. Groups were statistically compared.
A total of 107 subjects were recruited (G1: 31, G2:31, G3:21, G4:24). Any lesion: SLE patients 74.7%, HS 41.67%; P 0.002. Synovitis: G1: 64.52%, G2: 51.61%, G3: 45%, G4: 20.83%; P 0.013. Erosions: G1: 29.03%; G2: 54.84%, G3: 47.62%; G4: 25%; P 0.066. Bone marrow oedema: G1: 29.03%, G2: 22.58%, G3: 19.05%, G4: 0.0%; P 0.046. Tenosynovitis: G1: 38.71%; G2: 25.81%, G3: 14.29%, G4: 0.0%; P 0.005. Peritendonitis: G1: 12.90%; G2: 3.23%, G3: 0.0%, G4: 0.0%; P 0.07.
SLE patients have a high prevalence of inflammatory musculoskeletal alterations confirmed by contrasted MRI, even if asymptomatic. Not only tenosynovitis but peritendonitis is also present.
SLE patients have a high prevalence of inflammatory musculoskeletal alterations confirmed by contrasted MRI, even if asymptomatic.
Musculoskeletal manifestations in SLE patients should be strictly evaluated with sensitive imaging techniques, including not only joints, but also tendons and peritendinous structures.
Introduction
SLE is a chronic, multisystemic, autoimmune disease of unknown cause, as a result of loss of self-tolerance and subsequent production of autoantibodies. This autoimmunity process can lead to very heterogeneous damage in several organs and tissues, with musculoskeletal affection being predominant, for 70–95% of patients over the course of the disease, for 60% of patients in a lupus flare, and it appears as a first symptom for at least 50% of patients [1–4].
Joints, muscles, tendons and bones can be affected by SLE. Joint involvement ranges from a subclinical inflammatory alteration, only detected by highly sensitive imaging techniques [5, 6] to mild self-limited migratory arthralgia or persistent deforming non-erosive arthritis [7–11]. Erosive arthritis in SLE, commonly termed rhupus [7, 12–14], is characterized by overlapping features of RA and SLE. SLE-related arthritis has been traditionally defined as ‘non-erosive’ when detected with plain X-rays (according to the 1982 and revised 1997 ACR criteria) [15], but with the implementation of ultrasound scanning (US) in clinical practice [16–18], erosions have been frequently found, leading to a change in the classic paradigm. Nevertheless, pure erosive lupus not classified as rhupus has not been described so far. On the other hand, MRI is not as commonly used as US for osteoarticular affections in SLE, despite its high sensitivity. Only a few studies, with irregular results and little systematization, have examined this aspect of SLE using MRI [16, 18–23].
The main objective of this study is to identify the prevalence of inflammatory musculoskeletal alterations in a large cohort of SLE patients with wrist and/or hand arthritis or inflammatory arthralgia, as well as SLE patients without musculoskeletal symptoms, all assessed by contrast enhanced MRI, which is considered the most sensitive imaging technique to detect these types of abnormalities, and to compare data to those obtained from healthy subjects.
Methods
Patients
Outpatients seen in a SLE monographic clinic at Hospital del Mar (Barcelona, Spain), meeting the 2012 SLICC criteria for SLE [24] classification, and voluntarily taking part in the study were consecutively recruited until reaching ∼30 subjects per group.
Patients diagnosed with SLE were classified as follows:
Group 1 (arthritis): patients diagnosed with SLE who have wrist and/or hand arthritis observed with a physical examination by an expert rheumatologist during the medical visit or in the past six months.
Group 2 (arthralgia): patients diagnosed with SLE who have wrist and/or hand inflammatory arthralgia that was reported by the patient, without arthritis observed by an expert rheumatologist during the medical visit or in the past six months.
Group 3 (SLE control): patients diagnosed with SLE with neither arthritis nor arthralgia in their wrist and/or hand in the last six months.
A control group was created in order to rule out abnormalities originated by physiological processes that are typical among general population:
Group 4: healthy volunteers with similar sociodemographic characteristics of subjects in the patient cohort, having reported not having any wrist and/or hand pain/swelling, and who were never diagnosed nor had close relatives with a rheumatic disease.
Exclusion criteria
Patients diagnosed with Jaccoud arthropathy, incomplete SLE, mixed connective tissue disease, overlap syndromes and other non-rheumatic systemic autoimmune diseases were excluded. Patients who were RF and/or ACPA positive were excluded to evaluate the pure erosive affectation secondary to lupus. Likewise, those subjects with symptomatic hand osteoarthritis, previous hand surgery, and/or active neoplasm were excluded to avoid possible bias towards pain, functional impairment, and fatigue. Those patients who had contraindications for MRI scan (claustrophobia, severe chronic kidney disease, presence of ferromagnetic material or a pacemaker) were excluded based on technical impossibility.
Data collection
The following sociodemographic and clinical data were retrospectively collected from SLE patients through medical reports: age (years), sex (female/male subjects), body mass index (BMI) (kg/m2), tobacco use, either current or former (yes/no), race and ethnicity (White, Latino, Asia, Arab, Black) and disease duration since diagnosis (years).
Both patients and healthy controls had MRI with gadolinium contrast given by intravenous injection (ClariscanTM, gadoteric acid, 0.5 mmol/ml, standard dose: 10 ml) of their nondominant wrist and hand using the SIGNA™ 1.5 T MRI system. Images obtained were assessed by Outcome Measures in Rheumatology (OMERACT) Arthritis Magnetic Resonance Imaging Scoring System (RAMRIS) criteria [25, 26] including proximal interphalangeal (PIP) joints, Tenosynovitis Score System (TSS) [27], and OMERACT Psoriatic Arthritis Magnetic Resonance Imaging Scoring System (PsAMRIS) [28] for peritendonitis by two radiologists with proved experience in osteoarticular diagnostic with MRI and blind to the subject group assignment. The RAMRIS anatomical atlas was used, consisting of ‘wrist’: distal radioulnar (RU) joint and radiocarpal (RC) joint, intercarpal (IC) joint, carpometacarpal (CMC) joint, and proximal epiphysis (base) of metacarpal (BMC) bones; and ‘hand’: 2°–5° metacarpophalangeal (MCP) joints with the addition of 2°–5° proximal interphalangeal (PIP) joints. Between rater agreement was calculated and showed perfect for erosions, tenosynovitis and peritendonitis. For bone marrow oedema was almost perfect (kappa = 0.8834) and for synovitis was Fair (kappa = 0.3448).
Ethical considerations
All participant subjects signed the informed consent form. Race and ethnicity were selected by study participants, following guides for the reporting race and ethnicity in medical journals, trying to adapt to a European country. Sex was selected following biological factors. This study was approved by the local ethics committee: the CEIm, the ethics committee for research with medicinal products of Parc de Salut Mar (Ref.: 2018/7831/I) and carried out according to the Principles of Good Clinical Practice of the Declaration of Helsinki.
Sample size calculation and statistical analysis
Sample size calculation in this study was carried out according to the tenosynovitis expected frequency, the most frequent musculoskeletal disorder observed in SLE by ultrasound scan according to the systematic review carried out by the OMERACT group [29].
For the statistical analysis, quantitative variables were described as mean and corresponding standard deviation and categorical variables were expressed by relative frequency distributions tables (number and percentage). Between-group comparisons (four group comparisons, Tables 1 and 2) were performed according to variable type: ANOVA or Kruskal–Wallis test, after Kolmogorov–Smirnov test for normal distribution, for continuous variables and χ2 test and Fisher exact test for categorical ones.
Demographic variables
| Variable | SLE w/arthritis (Group 1) n = 31 | SLE w/arthralgia (Group 2) n = 31 | SLE w/o arthritis/arthralgia (Group 3) n = 21 | Healthy subjects (Group 4) n = 24 | Total n = 107 | P-value |
|---|---|---|---|---|---|---|
| Age (years) | 47.58 (14.60) | 50.13 (12.38) | 50.90 (12.73) | 48.33 (10.59) | 49.14 (12.66) | 0.662 |
| Sex (n female) | 29 (93.5%) | 27 (87.1%) | 20 (95.2%) | 22 (91.7%) | 98 (91.6%) | 0.722 |
| Disease duration (years) | 7.0 (3.0, 14.0) | 8.0 (2.0, 12.0) | 5.0 (2.0, 10.0) | 7.0 (2.0, 13.0) | 0.721 | |
| BMI (kg/m2) | 25.2 (21.6, 28.0) | 25.0 (23.0, 27.3) | 27.0 (22.7, 30.5) | 25.3 (22.4, 28.4) | 0.521 | |
| Tobacco use (yes) | 8 (26.7%) | 12 (38.7%) | 4 (19.0%) | 24 (29.3%) | 0.341 | |
| Ethnicity | 0.556 | |||||
| White | 18 (58.1%) | 18 (58.1%) | 7 (33.3%) | 43 (51.8%) | ||
| Latino | 10 (32.3%) | 11 (35.5%) | 11 (52.4%) | 32 (38.6%) | ||
| Asian | 2 (6.5%) | 1 (3.2%) | 2 (9.5%) | 5 (6.0%) | ||
| Arab | 1 (3.2%) | 1 (3.2%) | 1 (4.8%) | 3 (3.6%) | ||
| Black | 0 (0%) | 0 (0%) | 0 (0%) | 0 (%) |
Comparation among 4 groups were done and showed no statistical differences. Results for age were expressed as mean (s.d.); results for disease duration and BMI were expressed as median (p25, p75).
Lesions in MRI according to groups: comparations among each group (1, 2, 3 and 4) were done
| Lesion in MRI | SLE w/arthritis (Group 1) n = 31 | SLE w/arthralgia (Group 2) n = 31 | SLE w/o arthritis/arthralgia (Group 3) n = 21 | Healthy subjects (Group 4) n = 24 | P-value |
|---|---|---|---|---|---|
| At least one lesion | 22 (70.97%) | 24 (72%) | 16 (76.19%) | 10 (41.67%) | 0.023* |
| Erosions | 9 (29.03%) | 17 (54.84%) | 10 (47.62%) | 6 (25%) | 0.066 |
| PIP | 1 (3.23%) | 2 (6.45%) | 0 (0%) | 2 (8.33%) | 0.548 |
| MCP | 0 (0%) | 3 (9.68%) | 3 (14.29%) | 2 (8.33%) | 0.245 |
| BMC | 1 (3.23%) | 0 (0%) | 0 (0%) | 0 (0%) | 0.480 |
| Carpus | 9 (29.03%) | 17 (54.84%) | 8 (38.10%) | 4 (16.67%) | 0.024* |
| Ulna-radius | 3 (9.68%) | 2 (6.45%) | 0 (0%) | 0 (0%) | 0.244 |
| Synovitis | 20 (64.52%) | 16 (51.161%) | 9 (45.00%) | 5 (20.83%) | 0.013* |
| PIP | 12 (38.71%) | 11 (35.48%) | 4 (20.00%) | 1 (4.17%) | 0.016* |
| MCP | 15 (48.39%) | 11 (35.48%) | 6 (30%) | 2 (8.33%) | 0.017* |
| CMC | 7 (22.58%) | 7 (22.58%) | 2 (10%) | 1 (4.17%) | 0.170 |
| IC | 16 (51.61%) | 13 (41.94%) | 7 (35.00%) | 3 (12.50%) | 0.024* |
| Carpus-ulna-radius | 18 (58.06%) | 13 (41.94%) | 6 (30.00%) | 2 (8.33%) | 0.002* |
| Bone marrow oedema | 9 (29.03%) | 7 (22.58%) | 4 (19.05%) | 0 (0%) | 0.046* |
| PIP | 2 (6.45%) | 2 (6.45%) | 1 (4.76%) | 0 (0%) | 0.655 |
| MCP | 1 (3.23%) | 2 (6.45%) | 0 (0%) | 0 (0%) | 0.418 |
| BMC | 3 (9.68%) | 4 (12.90%) | 0 (0%) | 0 (0%) | 0.127 |
| Carpus | 3 (9.68%) | 4 (12.90%) | 3 (14.29%) | 0 (0%) | 0.315 |
| Ulna-radius | 3 (9.68%) | 4 (12.90%) | 1 (4.76%) | 0 (0%) | 0.296 |
| Tenosynovitis | 12 (38.71%) | 8 (25.81%) | 3 (14.29%) | 0 (0%) | 0.005* |
| Flexors | 8 (25.81%) | 7 (22.58%) | 2 (9.52%) | 0 (0%) | 0.037* |
| Extensors | 6 (19.35%) | 4 (12.90%) | 2 (9.52%) | 0 (0%) | 0.155 |
| Peritendonitis | 4 (12.90%) | 1 (3.23%) | 0 (0%) | 0 (0%) | 0.046* |
indicates statistical significance (P < 0.05).
BMC: base of metacarpal bones; CMC: carpometacarpophalangeal joints; IC: intercarpal joints; MCP: metacarpophalangeal joints; PIP: proximal interphalangeal joints.
On the other hand, total SLE vs healthy subjects comparisons were performed by χ2 test and Fisher exact test (variables in Table 3). P-values below 0.05 were considered statistically significant. Statistical analyses were performed with the STATA 15.1 software package (StataCorp LLC; College Station, TX, USA).
Lesions in MRI: comparing SLE Patients (G1, G2 and G3) vs Healthy Subjects (G4)
| Lesion in MRI | Total SLE (Groups 1 + 2 + 3) n = 83 | Healthy subjects (Group 4) n = 24 | P-value |
|---|---|---|---|
| At least one lesion | 62 (74.70%) | 10 (41.67%) | 0.002* |
| Erosions | 35 (41.17%) | 6 (25%) | 0.128 |
| PIP | 3 (3.61%) | 2 (8.33%) | 0.335 |
| MCP | 6 (7.23%) | 2 (8.33%) | 0.856 |
| BMC | 1 (1.20%) | 0 (0%) | 0.589 |
| Carpus | 34 (40.96%) | 4 (16.67%) | 0.028* |
| Ulna-radius | 5 (6.02%) | 0 (0%) | 0.218 |
| Synovitis | 45 (54.88%) | 5 (20.83%) | 0.003* |
| PIP | 27 (32.93%) | 1 (4.17%) | 0.005* |
| MCP | 32 (39.02%) | 2 (8.33%) | 0.005* |
| CMC | 16 (19.51%) | 1 (4.17%) | 0.072 |
| IC | 36 (43.90%) | 3 (12.50%) | 0.005* |
| Carpus-ulna-radius | 37 (45.12%) | 2 (8.33%) | 0.001* |
| Bone marrow oedema | 20 (24.10%) | 0 (0%) | 0.008* |
| PIP | 5 (6.02%) | 0 (0%) | 0.218 |
| MCP | 3 (3.61%) | 0 (0%) | 0.345 |
| BMC | 7 (8.43%) | 0 (0%) | 0.141 |
| Carpus | 10 (12.05%) | 0 (0%) | 0.074 |
| Ulna-radius | 8 (9.64%) | 0 (0%) | 0.114 |
| Tenosynovitis | 23 (27.71%) | 0 (0%) | 0.004* |
| Flexors | 17 (20.48%) | 0 (0%) | 0.016* |
| Extensors | 12 (14.16%) | 0 (0%) | 0.048* |
| Peritendonitis | 5 (6.02%) | 0 (0%) | 0.218 |
indicates statistical significance (P < 0.05).
BMC: base of metacarpal bones; CMC: carpometacarpophalangeal joints; IC: intercarpal joints; PIP: proximal interphalangeal joints.
Results
A total of 107 subjects were recruited. Out of this total, 83 were patients diagnosed with SLE. Group 1: 31 patients; group 2: 31 patients; group 3: 21 patients; and group 4: 24 healthy controls. Most of the subjects were female (91.6%), and average age was 49.14 (±12.66) years with no difference between the four groups. In patients with SLE (groups 1, 2 and 3), the mean time of disease was 8.54 (±7.72) years. There were no significant differences between groups regarding tobacco use, race and ethnicity or BMI.
Inflammatory findings observed by MRI were analysed by a descriptive and comparative analysis. Data were compared between groups (group 1, group 2, group 3 and group 4: Table 1 and 2) and between subjects (the Total SLE Cluster, which consists of groups 1, 2 and 3, compared with the healthy controls in group 4: Table 3). For complete data, see results tables (Tables 1–3). The symbol (*) indicates statistical significance (P < 0.05).
SLE patients showed higher incidence of any type abnormalities in MRI, regardless of the group, when compared with healthy controls (group 1: 70.97%, group 2: 77.42%, group 3: 76.19%, group 4: 41.67%, P = 0.023; Total SLE 74.70% vs healthy controls 41.67%, P = 0.002) (Fig. 1).
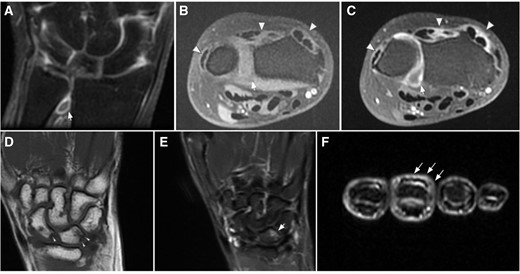
Selected images MR images from different patients covering the spectrum of positive findings. (A–C) Grade II synovitis of the distal radio-ulnar joint and active tenosynovitis from 2° to 6° extensor compartments. (A) Coronal T1FatSat after IV contrast administration. (B) Axial T1FatSat pre-contrast. (C) Axial T1FatSat after contrast administration. Note the active enhancement in the synovium of the joint (arrows), and tendon sheaths (arrowheads) after IV contrast administration. (D–E) Grade 1 erosions and grade II bone marrow oedema. (D) Coronal T1WI, depicting small erosions at the proximal aspect of the scaphoid and lunate (arrowheads). (E) Coronal STIR, shows associated bone marrow edema (arrow). (F) Axial STIR image at the level of the middle phalanges, showing extensor peritendinous edema (peritendinitis) in the third finger (tailed arrows)
There were no statistically significant differences regarding erosions between groups or when comparing the Total SLE Cluster vs healthy controls (group 1: 29.03%, group 2: 54.84%, group 3: 47.62%, group 4: 25%, P = 0.066; Total SLE 42.17% vs healthy controls 25%, P = 0.128); except in the carpal bones, where SLE patients from all groups showed a greater proportion of erosions with higher significance in patients with arthralgia and patients without pain (group 1: 29.03%, group 2: 54.84%, group 3: 38.10%, group 4: 16.67%, P = 0.024; Total SLE 40.96% vs healthy controls 16.67%, P = 0.028). There were no statistically significant differences regarding erosions in the rest of locations examined (PIP, MCP, BMC, RU).
There were statistically significant differences between groups and the Total SLE Cluster vs healthy controls regarding presence of synovitis, partly due to the study design, but the high frequency of synovitis in patients with arthralgia and those without pain must be underlined (group 1: 64.52%, group 2: 51.61%, group 3: 45%, group 4: 20.83%, P = 0.013; Total SLE 54.88% vs healthy controls 20.83%, P = 0.03). Radiocarpal-radioulnar was the location with the highest frequency of synovitis in all groups, including patients without pain (Total SLE: 45.13%), followed by the IC joint (Total SLE: 43.92%).
The presence of bone marrow oedema also showed significant differences between groups and between Total SLE vs healthy controls, while the absence of bone marrow oedema in healthy controls should be noted (group 1: 29.03%, group 2: 22.58%, group 3: 19.05%, group 4: 0.0%, P = 0.046; Total SLE 24.10% vs healthy controls 0.0%, P = 0.008).
Tenosynovitis and peritendonitis were only observed in SLE patients (group 1: 38.71%, group 2: 25.81%, group 3: 14.29%, group 4: 0.0%, P = 0.005; Total SLE 27.71% vs healthy controls 0.0%, P = 0.004; and group 1: 12.90%, group 2: 3.23%, group 3: 0.0%, group 4: 0.0%, P = 0.07; Total SLE 6.02% vs healthy controls 0%, P = 0.21, respectively). As for location, tenosynovitis was more frequent in the flexor tendons of the hand than in extensors (Total SLE: 20.48% and 14.46%, respectively).
Discussion
A total of 107 subjects were evaluated by contrast enhancement MRI of their nondominant hand and wrist (83 SLE patients and 24 healthy subjects). As known, musculoskeletal involvement in SLE is the most frequent manifestation, reported in some series up to 90% [3, 4], and its assessment by MRI, as demonstrated in RA [19], is proved to be the most sensitive, even at an early stage of the disease. Nevertheless, to date, there are very few published studies on musculoskeletal assessment by MRI in SLE [18–23]. To our knowledge, this study shows the largest SLE cohort, so far, evaluated with contrast MRI using the RAMRIS criteria [25, 26], TSS [27] and PSAMRIS [28]; becoming, to the best of our knowledge, the largest study which evaluates all possible joint and tendon inflammatory abnormalities (synovitis, erosions, bone marrow oedema, tenosynovitis and peritendonitis).
The main objective of this study is to determine the frequency of osteoarticular and tendon lesions by MRI in SLE diagnosed patients. A higher prevalence of inflammatory and/or structural musculoskeletal alterations was observed in SLE patients (74.40%) when compared with healthy controls (41.67%) even in those SLE patients not presenting any signs or symptoms of joint involvement over the last six months (76.19%).
The prevalence of synovitis observed in the patients evaluated in this study (64.52% in the arthritis group, 51.16% in the arthralgia group and 45% in the asymptomatic group) is similar to the one observed by Zollars et al. [21] but lower than the prevalence observed in the rest of studies that were also carried out with contrast-enhanced MRI [18, 19, 21–23], which show a prevalence of synovitis close to 100%. Noteworthy, most of the enrolled patients in these other studies are symptomatic, which clearly overestimates the frequency of arthritis in SLE, while in the present study only 64.5% of the symptomatic patients showed synovitis detected by MRI. In that sense, it is also important to take into account that, except for the Tani et al. work [20], none of the studies with MRI to date have excluded rhupus patients (positive RF and/or ACPA), and it is well known that these patients have a high inflammatory and erosive pattern similar to RA [7, 14]. In the present study, patients presenting with rhupus or Jaccoud’s arthropathy have been excluded to avoid possible biases in imaging results. In healthy subjects, the prevalence of synovitis in this study is 20.83% similar to, or even slightly higher than, other studies which assess healthy subjects [30, 31]; which makes it unlikely that the presence of synovitis could have been underestimated by our expert radiologists.
This study shows a lower prevalence of erosions (41% for all patients), at all locations, than the proportion obtained in other studies to date (between 50 and 93% [18–23], except for the Mosca et al. [16], reaching up to 98.9%). The carpal bones of patients with arthralgia are the only area showing similar values in this study (54.8%). Despite the frequency of erosions being clearly higher in SLE patients than in healthy subjects (25%), these values do not show a statistically significancy (P 0.06). However, once again this does not happen in the carpal bones, where SLE patients, regardless of the group they belong to, have significantly more erosions than healthy subjects. In addition, this is the most frequent location among this patient cohort. Prior existing literature shows very heterogeneous data regarding the predominant location of erosions. It is important to note also that Mosca et al. [16] and Tani et al. [20] found erosions in the wrist of 97% healthy subjects, while our study only shows erosions in 25% of healthy controls. This percentage is closer to the much lower 2% found by Ejbjerb et al. [31], one of the few studies that evaluates healthy subjects using RAMRIS criteria for RA, so these data are still very inconsistent. To note, neither of these two studies [16, 20] used contrast agents. Although it is thought that the absence of contrast does not reduce sensitivity in erosion detection [32], it should also be pointed that the absence of contrast does not allow for observing the fast postcontrast perilesional enhancement, and erosions could be overestimated [31] when considering subchondral bone lesions of degenerative origin as actual erosions. In our study, the presence of erosions is closely associated with the subject’s age in both patients and healthy controls, which would support this theory. Determining the actual prevalence of erosions in healthy subjects in large studies, in order to compare the prevalence of erosion with SLE patients, remains pending. At the moment, we think that isolated erosions should not be categorically considered as pathological if there are no other inflammatory abnormalities. However, the last a matter in continuous investigation nowadays [33].
Bone marrow oedema was found in 24.10% of SLE patients, close to those obtained in other studies so far (14–55%), predominantly in those patients showing arthritis during physical examination and without any specific prevailing location. As other studies assessing subjects with no inflammatory pathology [20, 30, 31], this study also dismisses the presence of bone marrow oedema in healthy controls. This is an important aspect to take into account when assessing paucisymptomatic patients, because bone marrow oedema in the patient’s imaging should be, also in SLE, a warning sign when considering findings to be of inflammatory origin, as is the case with RA [34]. Likewise, this shall be key to avoiding cumulative damage, because in RA the presence of bone marrow oedema has been considered to be an early characteristic of inflammatory affection whose damage is still reversible if treated early [35], but prospective studies must be done to confirm this earlier.
Tendinous affection has been considered as a highly frequent inflammatory alteration in SLE in recent years, normally examined by ultrasound scan. Not only tendinitis has been observed, but also peritendonitis, enthesitis and tendon thickening and rupture. The presence of tenosynovitis assessed by ultrasound scan is established as 22–65%, reaching 93% if patients do not receive any treatment [9, 36]. To date, the frequency of tenosynovitis has only been assessed with MRI in five studies of few patients [18, 19, 21–23], being present in up to 95% of SLE patients.
To our knowledge, this is the largest cohort in which tendinous affection in SLE was assessed by MRI, and it evaluates not only tenosynovitis, but also peritendonitis. Tenosynovitis is observed in 27.71% of patients, reaching 71% in patients with arthritis during physical examination, and is more frequent in the flexor tendons. For those few studies where MRI was used to evaluate healthy subjects, a prevalence of tenosynovitis, generally mild, was observed between 0 and 8% [30, 31, 37]. In accordance with these data, our study did not find tenosynovitis in any healthy subject. Results could be different if the flexor tendon sheaths in the fingers were assessed, because effusion is a common non-pathological finding there [38], but this anatomical site was not considered in this study.
An interesting finding of this study, and a new highly valuable contribution to literature, is the presence of peritendonitis in 6% of patients with SLE (0% in healthy subjects), predominantly in those with arthritis during physical examination. This alteration has been rarely studied in patients with SLE and was never assessed by MRI before. Peritendonitis definition was obtained from the evaluation of psoriatic arthritis patients (PsAMRIS) [28] where tendons are extensively studied. It is defined as increased water content or abnormal post-gadolinium enhancement adjacent to a tendon, in an area without a tendon sheath (in hands, usually in extensors tendons distal to metacarpal bones). Di Mateo et al. [39] published data from a series of patients assessed by ultrasound in 2017 where peritendonitis was observed in 4.7%. Ogura et al. [40] mention in their study the evaluation of peritendinous inflammation of the extensors tendons, but give no differentiated data from the tenosynovitis. These findings, together with Di Mateo et al.’s [39], show a musculoskeletal soft tissue without synovial inflammatory affection that has not been studied so far.
It is also interesting to highlight the unexpected findings according to the group. On one hand, the high prevalence of abnormalities observed in asymptomatic patients by MRI. This shows a subgroup of SLE patients with subclinical musculoskeletal affection, which have already been assessed by ultrasound, but have never been assessed by MRI to date. Their prevalence (5–40%) [5, 6, 41] has been generally estimated lower than the obtained in this study, except for the Salliot et al. study [42], with ∼85% of patients with at least one injury found by ultrasound scan. In the musculoskeletal asymptomatic group (group 3), synovitis is observed in 45% of patients, bone marrow oedema in 19% and tenosynovitis in 14.3%, which highlights active inflammatory activity that had gone unnoticed so far and that was confirmed by MRI. On the other hand, a higher synovitis prevalence (close to 100%) could be expected in those patients with synovitis confirmed by an expert rheumatologist, which indicates the low specificity of traditional physical examination in this disease, which has a low-grade inflammatory component, much less pronounced compared with other inflammatory diseases, as RA, making the correct musculoskeletal evaluation of swollen joint count even more challenging.
Both situations lead us to recommend a systematic musculoskeletal assessment in all SLE patients through sensitive imaging techniques, even for musculoskeletal asymptomatic patients.
Unavoidably, this study also has some limitations. Firstly, this is a cross-sectional study, therefore some important data, such as cumulative glucocorticoid dose, was unable to be collected. Secondly, this is a daily clinical practice conditions study, so variations in clinical and results outcomes could be observed related to waiting time for imaging tests, treatments changes and the natural SLE flare-remission characteristic. Regarding the anatomical site, we focused this study on the wrist and hand, as the main prior studies did; therefore, the abnormalities found can not necessarily be extrapolated to other joints.
In conclusion, to date, this study includes the largest cohort of SLE patients assessed by MRI with contrast of their non-dominant wrist and hand, showing a high prevalence of inflammatory abnormalities (synovitis, bone marrow oedema, tenosynovitis and peritendonitis) when compared with healthy subjects, and finding them even in asymptomatic patients. These findings led us to consider the need to evaluate the musculoskeletal system systematically with sensitive imaging techniques for all patients diagnosed with SLE. In accordance with Zollars et al. [21] it may be necessary to create and validate an MRI-specific assessment method for SLE patients, similar to RAMRIS, which assesses joints and tendons together.
Data availability
Data are available on request from the correspondence author.
Funding
This study was financed thanks to the support of GSK with an Investigator Sponsored Studies grant and another grant from the SCR (Catalan Society of Rheumatology) for research projects (2019). Also, the authors thanks to the Spanish Foundation of Rheumatology for providing medical writing/editorial assistance during the preparation of the manuscript (FERBT2022).
Disclosure statement: P.C.G. received payments for educational talks from: GSK, Lilly, Novartis, Janssen, Galápagos. A.A.C. discloses no conflict of interest. I.G.-D. discloses no conflict of interest. X.D.J. discloses no conflict of interest. J.M. received payments for educational talks and consulting activities from: Pfizer, Roche, Procare Health and Farmalider. T.C.S.-M. received payments for educational talks and consulting activities from: GSK, Otzuka, Vifor.
References
Author notes
J.M. and T.C.S.-M. share senior authorship.

Comments