


Abstract
To determine the effect of antimalarial agents (AMA) and different doses and pharmaceutical forms of belimumab on preventing renal flares in patients with SLE treated for extra-renal disease.
We pooled data from the BLISS-52, BLISS-76, BLISS-SC and BLISS-Northeast Asia trials of belimumab (n = 3225), that included patients with active SLE yet no severe ongoing nephritis. Participants were allocated to receive intravenous belimumab 1 mg/kg, intravenous belimumab 10 mg/kg, subcutaneous belimumab 200 mg, or placebo in addition to standard therapy. We estimated hazards of renal flare development throughout the study follow-up (52–76 weeks) using Cox regression analysis.
In total, 192 patients developed a renal flare after a median of 197 days. Compared with placebo, the risk of renal flares was lower among patients receiving intravenous belimumab 10 mg/kg (HR: 0.62; 95% CI: 0.41, 0.92; P = 0.018) and intravenous belimumab 1 mg/kg (HR: 0.42; 95% CI: 0.22, 0.79; P = 0.007), while no significant association was found for subcutaneous belimumab 200 mg. AMA use yielded a lower hazard of renal flares (HR: 0.66; 95% CI: 0.55, 0.78; P < 0.001). The protection conferred was enhanced when belimumab and AMA were co-administered; the lowest flare rate was observed for the combination intravenous belimumab 1 mg/kg and AMA (18.5 cases per 1000 person-years).
The protection conferred from belimumab against renal flare development in patients treated for extra-renal SLE appears enhanced when belimumab was administered along with AMA. The prominent effect of low-dose belimumab warrants investigation of the efficacy of intermediate belimumab doses.
BLISS-52: NCT00424476; BLISS-76: NCT00410384; BLISS-SC: NCT01484496; BLISS-NEA: NCT01345253.
The protection against renal flares conferred from belimumab is enhanced in the presence of antimalarials.
Antimalarials protect against renal flares, further supporting its use in all SLE patients unless contraindicated.
The prominent effect of low-dose belimumab warrants investigation of the efficacy of intermediate belimumab doses.
Introduction
SLE is a heterogeneous systemic autoimmune disease that can affect various tissues. Up to 60% of patients with SLE develop kidney involvement during their disease course, and LN constitutes one of the most serious manifestations, remaining today a substantial cause of end-stage kidney disease (ESKD), dialysis and mortality [1]. Prompt and adequate treatment of LN as well as prevention of renal flares are therefore key components of disease management towards improved outcomes in SLE patients. The treatment armamentarium for LN includes antimalarial agents (AMA), glucocorticoids, synthetic immunosuppressants, calcineurin inhibitors, and, more recently, monoclonal antibodies such as belimumab [2].
The 2019 EULAR recommendations for the management of SLE and the 2019 EULAR/European Renal Association–European Dialysis and Transplantation Association (ERA–EDTA) recommendations for the management of LN advocate for long-term use of hydroxychloroquine in all patients with LN unless contraindicated [2, 3]. However, as commented upon in the systematic literature review performed to inform these recommendations, studies addressing the effect of AMA on preventing renal flares are scarce and conflicting [4]. Concerning biological agents, the 2019 EULAR/ERA-EDTA recommendations suggest considering belimumab as an add-on to standard therapy, and rituximab in refractory disease [2].
Belimumab is a human monoclonal antibody that targets the B-cell activating factor (BAFF; also known as B lymphocyte stimulator, BLyS). Belimumab has been approved as an add-on therapy for adult patients with active, autoantibody positive SLE, as well as for the treatment of active LN, after demonstrating efficacy in several phase III randomized clinical trials (RCTs) [5–9]. Secondary analyses of the BLISS-LN trial [9]—that comprised 446 patients with active, biopsy-proven LN—showed that i.v. belimumab was associated with a 55% reduced risk of renal flares compared with placebo [10]. However, the effect of belimumab on preventing renal flares is less clear in patients treated for active extra-renal SLE, with one investigation reporting a numerical but not statistically significant benefit from belimumab, presumably due to power limitations [11]. Furthermore, different case series and cohort studies have reported cases of de novo LN in patients treated with belimumab for reasons other than nephritis, which suggests that belimumab may not provide sufficient protection against renal involvement in some patients, e.g. those who are prone to or at high risk for LN [12–16].
In the present analysis of data from a clinical trial setting, we aimed to determine the effect of the use of AMA and different doses and pharmaceutical forms of belimumab on preventing renal flares in patients with moderately to highly active SLE yet no severe active renal disease.
Methods
Study design and population
This is a post-hoc analysis of four RCTs of belimumab, i.e. BLISS-52 (NCT00424476; n = 865), BLISS-76 (NCT00410384; n = 819), BLISS-SC (NCT01484496; n = 836) and BLISS-NEA (NCT01345253; n = 705) [5–8]. All trials met their primary efficacy end point, i.e. SLE Responder Index (SRI-4) response at week 52, as well as key secondary efficacy endpoints. In brief, adult patients with active (SELENA-SLEDAI score ≥6 for BLISS-52 and BLISS-76, and ≥8 for BLISS-SC and BLISS-NEA), seropositive (ANA titres ≥1:80 and/or anti-dsDNA levels ≥30 IU/ml) SLE despite non-biological standard therapy were eligible. Participants had to be on stable standard therapy for at least 30 days prior to enrolment, including AMA, glucocorticoids and synthetic immunosuppressants. The trials excluded patients with active severe renal disease, defined as proteinuria >6 g/day, serum creatinine >2.5 mg/dl, active biopsy-proven nephritis, or requirement of haemodialysis within 90 days prior to enrolment.
In BLISS-52 and BLISS-76, patients were randomized to receive belimumab 1 mg/kg, belimumab 10 mg/kg, or placebo as i.v. infusions at weeks 0, 2, 4, and monthly thereafter for 48 or 72 weeks, respectively [5, 6]. In BLISS-NEA, patients were randomized to receive i.v. belimumab 10 mg/kg or placebo, following the same schedule as that of BLISS-52 [8]. In BLISS-SC, patients were allocated to weekly s.c. injections of belimumab 200 mg or placebo for 48 weeks [7].
The BLISS studies comprised patients from multiple regions around the world. BLISS-52 enrolled patients from South America, Asia-Pacific and Eastern Europe; BLISS-76 enrolled from North America and Europe; BLISS-SC enrolled from South and North America, Europe and Asia-Pacific; and BLISS-NEA exclusively enrolled patients from Asia.
The similar study design and data collection across the BLISS studies allowed us to pool data from all studies to increase statistical power.
Ethics
Data from the BLISS trials were made available by GlaxoSmithKline (Uxbridge, UK) through the Clinical Study Data Request (CSDR) consortium. The trial protocols were approved by regional ethics review boards for all participating centres and complied with the ethical principles of the Declaration of Helsinki. Written informed consent was obtained from all study participants prior to enrolment. The present study was approved by the Swedish Ethical Review Authority (application reference: 2019–05498).
Main exposures
The main exposures of this study were use of antimalarials, and use of the different doses and pharmaceutical forms of belimumab. We classified patients as AMA users if they had received hydroxychloroquine, chloroquine, mepacrine or quinine sulphate in stable doses for at least 30 days prior to trial commencement. Furthermore, we compared all belimumab arms, i.e., i.v. belimumab 1 mg/kg (deriving from BLISS-52 and BLISS-76), i.v. belimumab 10 mg/kg (deriving from BLISS-52, BLISS-76, and BLISS-NEA), s.c. belimumab 200 mg (deriving from BLISS-SC) and placebo (deriving from all studies).
Outcome
The primary end point of the present analysis was the development of the first renal flare throughout follow-up. In line with previous reports from the BLISS programme [11], renal flare was defined as the occurrence of one or more of the following features at two or more consecutive visits: (i) increase in proteinuria to >1 g/day if the baseline value was <0.2 g/day, >2 g/day if the baseline value was 0.2–1 g/day, or >2 times the baseline value if this was >1 g/day; (ii) increase in serum creatinine by ≥20% or ≥0.3 mg/dL, accompanied by proteinuria >1 g/day, haematuria (≥4 red blood cells (RBCs) per high power field (hpf)), and/or RBC casts; (iii) treatment emergent reproducible haematuria (≥11–20 RBCs/hpf), or a reproducible increase in haematuria by two grades compared with baseline, associated with 25% dysmorphic RBCs, glomerular in origin, exclusive of menses, accompanied by either an ≥0.8 g increase in 24-h proteinuria (or equivalent amount measured by other means, such as the urinary protein to creatinine ratio (UPCR)), or new RBC casts. Urinalyses, including microscopic examination and spot UPCR, were assessed monthly. In case of signs of renal involvement, 24-h proteinuria was measured, as clinically indicated.
Clinical assessments
SLE disease activity was assessed using the SLEDAI-2K [17] and the BILAG [18] indices, whereas organ damage was assessed using the SLICC/ACR Damage Index (SDI) [19]. Serological markers evaluated at baseline included complement protein 3 (C3), C4, anti-dsDNA, anti-Smith and aCL antibodies.
Statistical analysis
Clinical and demographic characteristics of the different treatment groups are presented as frequencies (percentage), means (s.d.) or medians (interquartile range, IQR) in case of non-normally distributed data. Crude incidence rates (IRs) of renal flares were calculated for each treatment group. The hazard of renal flare for the different treatments was estimated using univariable and multivariable proportional hazards (Cox) regression models. We created models for use of AMA (reference: no use of AMA), and for the different belimumab doses and pharmaceutical forms (reference: placebo). Analyses were adjusted for age, sex, ethnicity, extra-renal clinical SLEDAI-2K score, SDI score, proteinuria, current or previous renal involvement (renal BILAG A–D vs BILAG E at baseline), anti-dsDNA positivity, low C3, low C4, use of glucocorticoids, and use of immunosuppressants. Furthermore, in adjusted models we accounted for the fact that each individual trial represents a cluster of observations and calculated a robust variance for the models.
Furthermore, we performed subgroup analyses based on whether the patients had experienced renal involvement until baseline (renal BILAG A–D) or not (renal BILAG E), as these two subgroups are expected to have substantially different risks for developing renal flares. Finally, we explored the potential synergistic effect of belimumab and AMA on prevention of renal flares. We performed analyses after stratification into patients who were or were not on AMA therapy and set patients who received placebo and were not on AMA as the reference group.
The R software version 4.2.1 (R Foundation for Statistical Computing, Vienna, Austria) was used for data management and statistical analyses. P values <0.05 were considered statistically significant.
Results
Patient characteristics at baseline
Baseline demographic and clinical characteristics for the pooled study population are displayed in Table 1. The proportion of patients with current or previous renal involvement at baseline according to BILAG (renal BILAG A–D) was 54.6%, whereas 44.3% had renal involvement at baseline according to the BILAG (renal BILAG A–C) and 26.1% according to the renal descriptors of SLEDAI-2K (urinary casts, haematuria, proteinuria, pyuria). Nearly a quarter of the study participants had proteinuria >0.5 g/day before treatment initiation, and 6.6% had an active urinary sediment. Detailed baseline characteristics of the different treatment arms in each trial have been reported previously [5–8].
Demographic and clinical characteristics of the pooled study population, stratified by belimumab treatment arm and AMA use
| All patients n = 3225 | BLM IV | BLM IV | BLM SC | Placebo n = 1077 | AMA users n = 2173 | AMA | |
|---|---|---|---|---|---|---|---|
| 1 mg/kg | 10 mg/kg | 200 mg | non-users | ||||
| n = 559 | n = 1033 | n = 556 | n = 1052 | ||||
| Patient characteristics | |||||||
| Age (years), mean (s.d.) | 36.7 (11.6) | 37.4 (11.3) | 35.3 (10.9) | 38.1 (12.1) | 37.1 (11.9) | 35.8 (11.4) | 38.6 (11.7) |
| Female sex, n (%) | 3030 (94.0) | 524 (93.7) | 977 (94.6) | 521 (93.7) | 1008 (93.6) | 2050 (94.3) | 980 (93.2) |
| Ancestry, n (%) | |||||||
| Asian | 1242 (38.5) | 112 (20.0) | 597 (57.8) | 119 (21.4) | 414 (38.4) | 850 (39.1) | 392 (37.3) |
| Black/African American | 234 (7.3) | 48 (8.6) | 50 (4.8) | 56 (10.1) | 80 (7.4) | 167 (7.7) | 67 (6.4) |
| Indigenous Americana | 449 (13.9) | 131 (23.4) | 126 (12.2) | 45 (8.1) | 147 (13.6) | 311 (14.3) | 138 (13.1) |
| White/Caucasian | 1300 (40.3) | 268 (47.9) | 260 (25.2) | 336 (60.4) | 436 (40.5) | 845 (38.9) | 455 (43.3) |
| BMI (kg/m2), mean (s.d.) | 25.0 (5.9) | 25.5 (6.0) | 24.1 (5.4) | 26.0 (6.3) | 25.0 (5.9) | 24.9 (6.0) | 25.1 (5.6) |
| Clinical data | |||||||
| SLE duration (years), median (IQR) | 4.5 (1.6–9.7) | 4.6 (1.5–9.5) | 4.5 (1.6–8.8) | 4.3 (1.4–8.9) | 4.7 (1.6–9.6) | 4.2 (1.4–8.4) | 5.4 (1.9–10.9) |
| SLEDAI-2K, mean (s.d.) | 10.3 (3.7) | 9.9 (3.8) | 10.3 (3.8) | 10.8 (3.4) | 10.3 (3.7) | 10.2 (3.7) | 10.5 (3.7) |
| SDI, median (IQR) | 0.0 (0.0–1.0) | 0.0 (0.0–1.0) | 0.0 (0.0–1.0) | 0.0 (0.0–1.0) | 0.0 (0.0–1.0) | 0.0 (0.0–1.0) | 0.0 (0.0–1.0) |
| SDI >0, n (%) | 2077 (64.4) | 243 (43.5) | 310 (30.0) | 201 (36.2) | 392 (36.4) | 1465 (67.4) | 612 (58.2) |
| anti-dsDNA positivity, n (%) | 2336 (72.4) | 392 (70.1) | 782 (75.7) | 404 (72.7) | 758 (70.4) | 1583 (72.8) | 753 (71.6) |
| anti-Sm positivity, n (%) | 776 (30.9) | 171 (30.6) | 184 (32.8) | 166 (30.2) | 255 (30.4) | 562 (33.6) | 214 (25.6) |
| Any aCL positivity, n (%) | 637 (20.7) | 147 (26.4) | 194 (20.6) | 94 (17.0) | 202 (19.6) | 413 (19.6) | 224 (22.9) |
| C3 (mg/dL), mean (s.d.) | 91.8 (31.2) | 94.3 (31.6) | 86.5 (29.9) | 97.8 (31.2) | 92.2 (31.3) | 91.7 (30.5) | 91.9 (32.5) |
| Low C3, n (%) | 1621 (50.3) | 248 (44.4) | 606 (58.7) | 245 (44.1) | 522 (48.5) | 1095 (50.4) | 526 (50.0) |
| C4 (mg/dL), mean (s.d.) | 16.0 (9.2) | 16.5 (9.6) | 15.5 (9.0) | 16.2 (9.2) | 16.0 (9.3) | 16.1 (9.3) | 15.8 (9.2) |
| Low C4, n (%) | 1377 (42.7) | 314 (56.2) | 466 (45.1) | 146 (26.3) | 451 (41.9) | 902 (41.5) | 475 (45.2) |
| Renal disease activity | |||||||
| Renal BILAG, n (%) | |||||||
| A | 46 (1.4) | 6 (1.1) | 15 (1.5) | 11 (2.0) | 14 (1.3) | 30 (1.4) | 16 (1.5) |
| B | 481 (14.9) | 56 (10.0) | 178 (17.2) | 88 (15.8) | 159 (14.8) | 302 (13.9) | 179 (17.0) |
| C | 903 (28.0) | 139 (24.9) | 314 (30.4) | 129 (23.2) | 321 (29.8) | 638 (29.4) | 265 (25.2) |
| D | 331 (10.3) | 37 (6.6) | 123 (11.9) | 61 (11.0) | 110 (10.2) | 239 (11.0) | 92 (8.8) |
| E | 1464 (45.4) | 321 (57.4) | 403 (39.0) | 267 (48.0) | 473 (43.9) | 964 (44.4) | 500 (47.5) |
| SLEDAI-2K haematuria, n (%) | 160 (5.0) | 23 (4.1) | 67 (6.5) | 17 (3.1) | 53 (4.9) | 104 (4.8) | 56 (5.3) |
| SLEDAI-2K proteinuria, n (%) | 791 (24.5) | 110 (19.7) | 318 (30.8) | 99 (17.8) | 264 (24.5) | 508 (23.4) | 283 (26.9) |
| SLEDAI-2K pyuria, n (%) | 69 (2.1) | 6 (1.1) | 31 (3.0) | 13 (2.3) | 19 (1.8) | 48 (2.2) | 21 (2.0) |
| SLEDAI-2K urinary casts, n (%) | 16 (0.5) | 1 (0.2) | 9 (0.9) | 0 | 6 (0.6) | 12 (0.6) | 4 (0.4) |
| UPCR (mg/mg), median (IQR) | 0.2 (0.1–0.5) | 0.1 (0.1–0.4) | 0.2 (0.1–0.8) | 0.1 (0.1–0.3) | 0.2 (0.1–0.5) | 0.2 (0.1–0.5) | 0.2 (0.1–0.5) |
| Serum creatinine (μmol/L), mean (s.d.) | 68.0 (20.5) | 72.1 (21.3) | 66.2 (21.0) | 67.3 (18.8) | 68.0 (20.1) | 67.1 (18.9) | 69.9 (23.3) |
| Therapy | |||||||
| Prednisone eq. dose (mg/day), mean (s.d.) | 12.1 (9.4) | 12.2 (9.5) | 10.8 (8.4) | 13.3 (10.1) | 10.8 (8.2) | 11.8 (9.5) | 12.6 (9.0) |
| Antimalarial agents, n (%) | 2173 (67.4) | 366 (65.5) | 683 (66.1) | 391 (70.3) | 733 (68.1) | N/A | N/A |
| Immunosuppressants, n (%) | |||||||
| Azathioprine | 621 (19.3) | 123 (22.0) | 194 (18.8) | 107 (19.2) | 197 (18.3) | 363 (16.7) | 258 (24.5) |
| Methotrexate | 366 (11.3) | 77 (13.8) | 88 (8.5) | 52 (9.4) | 149 (13.8) | 235 (10.8) | 131 (12.5) |
| Mycophenolate mofetil or sodium | 509 (15.8) | 61 (10.9) | 203 (19.7) | 70 (12.6) | 175 (16.2) | 337 (15.5) | 172 (16.3) |
Categorical data are presented as numbers (percentage). Continuous data are presented as means (s.d.) or medians (IQR) in case of non-normal distributions.
Alaska Native or American Indian from North, South or Central America.
aCL: anticardiolipin; anti-dsDNA: anti-double-stranded DNA; BILAG: British Isles Lupus Assessment Group; BLM: belimumab; BMI: body mass index; C3: complement protein 3; C4: complement protein 4; IQR: interquartile range; IV: intravenous; SC: subcutaneous; SDI: Systemic Lupus International Collaborating Clinics/American College of Rheumatology Damage Index; SLEDAI-2K: systemic lupus erythematosus disease activity index 2000; UPCR: urine protein to creatinine ratio.
In the pooled study population, 192 patients (6.0%) developed a renal flare after a median time of 197 (IQR: 85–330) days. Reasons for treatment discontinuation in patients who did not develop a renal flare are presented in Supplementary Table S1 (available at Rheumatology online).
Effect of belimumab use on renal flare prevention
The IR of renal flares was lowest among patients who received i.v. belimumab 1 mg/kg (24 per 1000 person-years), followed by s.c. belimumab 200 mg (52 per 1000 person-years), i.v. belimumab 10 mg/kg (70 per 1000 person-years) and placebo (84 per 1000 person-years).
Compared with patients who received placebo, the risk of renal flares was lower among patients receiving i.v. belimumab 1 mg/kg (HR: 0.30; 95% CI: 0.17, 0.52; P < 0.001) and s.c. belimumab 200 mg (HR: 0.61; 95% CI: 0.39, 0.94; P = 0.026), but did not differ in patients who received i.v. belimumab 10 mg/kg in univariable models (Fig. 1; Table 2). In multivariable Cox regression models, use of i.v. belimumab 10 mg/kg was associated with a 38% reduction in the risk of developing renal flares compared with placebo (HR: 0.62; 95% CI: 0.41, 0.92; P = 0.018), and use of i.v. belimumab 1 mg/kg yielded a 58% reduced risk (HR: 0.42; 95% CI: 0.22, 0.79; P = 0.007); no significant association was found for s.c. belimumab 200 mg. Post-hoc analyses comparing i.v. belimumab 1 mg/kg and i.v. belimumab 10 mg/kg are presented in Supplementary Table S2 (available at Rheumatology online).
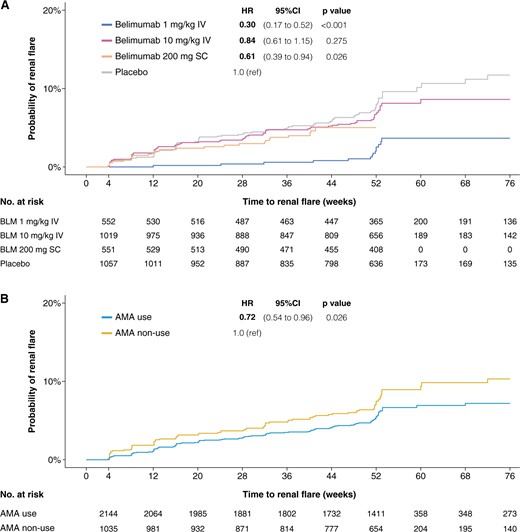
Time to first renal flare in the pooled study population. Survival curves and hazards ratios comparing patients who received different belimumab doses with placebo (A), as well as patients who were on antimalarial therapy with patients who were not (B). Patients from BLISS-52, BLISS-SC and BLISS-NEA were censored at week 52, whereas patients from BLISS-76 were censored at week 76. AMA: antimalarial agents; BLM: belimumab; IV: intravenous; SC: subcutaneous
Incidence rates of renal flares and hazard ratios comparing different belimumab doses with placebo
| Pooled study population (n = 3225) | ||||
|---|---|---|---|---|
| BLM IV 1 mg/kg | BLM IV 10 mg/kg | BLM SC 200 mg | Placebo | |
| n = 559 | n = 1033 | n = 556 | n = 1077 | |
| Renal flares during follow-up, n (%) | 14 (2.5) | 69 (6.7) | 26 (4.7) | 83 (7.7) |
| Person-years of follow-up | 581.8 | 989.1 | 496.4 | 987.3 |
| Rate of renal flares per 1000 person-years (95% CI) | 24.1 (13.2, 40.4) | 69.8 (54.3, 88.3) | 52.2 (34.2, 76.7) | 84.0 (66.9, 104.2) |
| Unadjusted HR (95% CI) | 0.3 (0.2, 0.5) P < 0.001 | 0.8 (0.6, 1.2) P = 0.275 | 0.6 (0.4, 0.9) P = 0.026 | 1.0 (reference) |
| Adjusted HR (95% CI) | 0.4 (0.2, 0.8) P = 0.007 | 0.6 (0.4, 0.9) P = 0.018 | 1.0 (0.6, 1.5) P = 0.862 | 1.0 (reference) |
| Renal BILAG A–D at baseline subgroup (n = 1761) | ||||
|---|---|---|---|---|
| BLM IV 1 mg/kg | BLM IV 10 mg/kg | BLM SC 200 mg | Placebo | |
| n = 238 | n = 630 | n = 289 | n = 604 | |
| Renal flares during follow-up, n (%) | 13 (5.5) | 67 (10.6) | 23 (8.0) | 78 (12.9) |
| Person-years of follow-up | 233.9 | 570.4 | 253.3 | 517.5 |
| Rate of renal flares per 1000 person-years (95% CI) | 55.6 (29.6, 95.1) | 117.5 (91.0, 149.2) | 90.8 (57.6, 136.3) | 150.7 (119.1, 188.1) |
| Unadjusted HR (95% CI) | 0.4 (0.2, 0.7) P = 0.001 | 0.8 (0.6, 1.1) P = 0.150 | 0.6 (0.4, 1.0) P = 0.030 | 1.0 (reference) |
| Adjusted HR (95% CI) | 0.4 (0.2, 0.9) P = 0.026 | 0.6 (0.4, 0.9) P = 0.016 | 0.9 (0.6, 1.5) P = 0.747 | 1.0 (reference) |
| Renal BILAG E at baseline subgroup (n = 1464) | ||||
|---|---|---|---|---|
| BLM IV 1 mg/kg | BLM IV 10 mg/kg | BLM SC 200 mg | Placebo | |
| n = 321 | n = 403 | n = 267 | n = 473 | |
| Renal flares during follow-up, n (%) | 1 (0.3) | 2 (0.5) | 3 (1.1) | 5 (1.1) |
| Person-years of follow-up | 347.9 | 418.7 | 243.2 | 469.8 |
| Rate of renal flares per 1000 person-years (95% CI) | 2.9 (0.1, 16.0) | 4.8 (0.6, 17.3) | 12.3 (2.5, 36.1) | 10.6 (3.5, 24.8) |
Incidence rate and hazard rations are presented for the pooled study population, and for the subgroups of patients with renal BILAG A–D and renal BILAG E at baseline.
Cox regression models were adjusted for age, sex, ethnicity, extra-renal clinical SLEDAI-2K score, SDI score, proteinuria, anti-dsDNA positivity, low C3, low C4, use of glucocorticoids, and use of immunosuppressants. The model for the pooled population was additionally adjusted for current or previous renal involvement (renal BILAG A–D vs BILAG E at baseline).
BILAG: British Isles Lupus Assessment Group; BLM: belimumab; IV: intravenous; SC: subcutaneous; SDI: SLICC/ACR Damage Index; SLEDAI-2K: systemic lupus erythematosus disease activity index 2000.
Effect of AMA use on renal flare prevention
In the pooled study population, 2173 (67.3%) individuals were classified as AMA users. The IR of renal flares was lower among patients who received AMA (56 per 1000 person-years) compared with individuals who did not (78 per 1000 person-years). The median time to the first renal flare was similar between groups, occurring after 197 (IQR: 86–328) days among AMA users, and 199 (IQR: 65–337) days among non-users of AMA (Fig. 1; Table 3).
Incidence rates of renal flares and hazard ratios comparing antimalarial users and non-users
| Pooled study population (n = 3225) | ||
|---|---|---|
| AMA use | AMA non-use | |
| n = 2173 | n = 1052 | |
| Renal flares during follow-up, n (%) | 116 (5.3) | 76 (7.2) |
| Person-years of follow-up | 2077.1 | 977.5 |
| Rate of renal flares per 1000 person-years (95% CI) | 55.8 (46.1, 67.0) | 77.7 (61.3, 97.3) |
| Unadjusted HR | 0.7 (0.5–1.0) P = 0.026 | 1.0 (reference) |
| Adjusted HR | 0.7 (0.6–0.8) P < 0.001 | 1.0 (reference) |
| Renal BILAG A–D at baseline subgroup (n = 1761) | ||
|---|---|---|
| AMA use | AMA non-use | |
| n = 1209 | n = 552 | |
| Renal flares during follow-up, n (%) | 111 (9.2) | 70 (12.7) |
| Person-years of follow-up | 1094.6 | 480.4 |
| Rate of renal flares per 1000 person-years (95% CI) | 101.4 (83.4, 122.1) | 145.7 (113.6, 184.1) |
| Unadjusted HR | 0.7 (0.5–0.9) P = 0.017 | 1.0 (reference) |
| Adjusted HR | 0.7 (0.6–0.8) P < 0.001 | 1.0 (reference) |
| Renal BILAG E at baseline subgroup (n = 1464) | ||
|---|---|---|
| AMA use | AMA non-use | |
| n = 964 | n = 500 | |
| Renal flares during follow-up, n (%) | 5 (0.5) | 6 (1.2) |
| Person-years of follow-up | 982.4 | 497.1 |
| Rate of renal flares per 1000 person-years (95% CI) | 5.1 (1.7, 11.9) | 12.1 (4.4, 26.3) |
Incidence rate and hazard rations are presented for the pooled study population, and for the subgroups of patients with renal BILAG A–D and renal BILAG E at baseline.
Cox regression models were adjusted for age, sex, ethnicity, extra-renal clinical SLEDAI-2K score, SDI score, proteinuria, anti-dsDNA positivity, low C3, low C4, use of glucocorticoids, and use of immunosuppressants. The model for the pooled population was additionally adjusted for current or previous renal involvement (renal BILAG A–D vs BILAG E at baseline).
BILAG: British Isles Lupus Assessment Group; BLM: belimumab; IV: intravenous; SC: subcutaneous; SDI: SLICC/ACR Damage Index; SLEDAI-2K: systemic lupus erythematosus disease activity index 2000.
Use of AMA yielded a lower risk of renal flares in both univariable (HR: 0.72; 95% CI: 0.54, 0.96; P = 0.026) and multivariable (HR: 0.66; 95% CI: 0.55, 0.78; P < 0.001) Cox regression analysis.
Subgroup analyses
We next performed subgroup analyses in patients with renal BILAG A–D and patients with renal BILAG E at baseline.
Demographic and clinical characteristics for both subgroups are displayed in Supplementary Tables S3–S7 (available at Rheumatology online). Compared with patients with renal BILAG E at baseline, those with renal BILAG A–D were younger and more frequently of Asian origin. They also had higher SLEDAI-2K scores, were more frequently serologically active, and received higher doses of glucocorticoids.
Among patients with renal BILAG A–D at baseline (n = 1761), 181 patients (10.3%) developed at least one renal flare, with the first one occurring after a median of 173 (IQR: 85–334) days.
The IR of renal flares was lowest among patients treated with i.v. belimumab 1 mg/kg (56 per 1000 person-years) and highest for patients treated with placebo (151 per 1000 person-years; Supplementary Fig. S1, available at Rheumatology online; Table 2). In multivariable Cox regression models, we observed similar HRs for the different doses and pharmaceutical forms of belimumab to those obtained from the analysis in the pooled study population. Compared with placebo, i.v. belimumab 10 mg/kg yielded a 37% reduced risk for developing renal flares (HR: 0.63; 95% CI: 0.43–0.92; P = 0.016) and use of i.v. belimumab 1 mg/kg was associated with lower risk by 57% (HR: 0.43; 95% CI: 0.21, 0.90; P = 0.026), whereas there was no significant association for s.c. belimumab 200 mg.
As observed in the pooled study population, patients who received AMA developed renal flares less frequently (Supplementary Fig. S1, available at Rheumatology online; Table 3) and had a nearly 30% reduction in hazards of renal flare compared with AMA non-users in adjusted models (HR: 0.68; 95% CI: 0.55, 0.84; P < 0.001).
Among patients with renal BILAG E at baseline (n = 1464), only 11 (0.8%) developed renal flares. Within those individuals, five (1.1%) had received placebo, one (0.3%) had received i.v. belimumab 1 mg/kg, two (0.5%) had received i.v. belimumab 10 mg/kg and three (1.1%) had received s.c. belimumab 200 mg (Table 2). Additionally, five (0.5%) were on AMA therapy and six (1.2%) were not (Table 3). The low number of events prevented us from performing statistical tests in this subgroup.
Investigation of the potential joint effect of belimumab and AMA use on renal flare prevention
The IR of renal flares was lowest among individuals who received i.v. belimumab 1 mg/kg in combination with AMA (19 cases per 1000 person-years), followed by those who received i.v. belimumab 1 mg/kg but not AMA (34 cases per 1000 person-years) and those who received s.c. belimumab 200 mg in combination with AMA (45 cases per 1000 person-years). Patients receiving placebo but not AMA (89 cases per 1000 person-years) and i.v. belimumab 10 mg/kg without AMA (97 cases per 1000 person-years) had the highest incidence of renal flares (Table 4; Fig. 2).
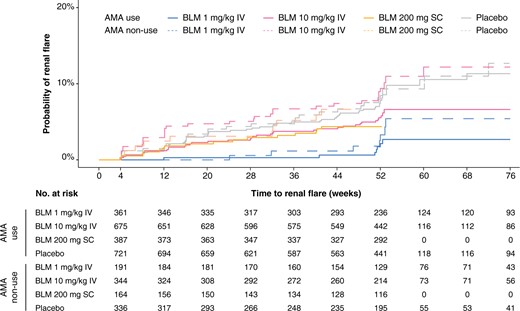
Time to first renal flare for combinations of belimumab and AMA in the pooled study population. Survival curves and hazards ratios comparing patients receiving different belimumab doses in combination with AMA (solid lines) and without AMA (dashed lines). Patients from BLISS-52, BLISS-SC and BLISS-NEA were censored at week 52, whereas patients from BLISS-76 were censored at week 76. AMA: antimalarial agents; BLM: belimumab; IV: intravenous; SC: subcutaneous
Incidence rates of renal flares and hazard ratios comparing different belimumab doses with and without antimalarials.
| Pooled study population (n = 3225) | ||||||||
|---|---|---|---|---|---|---|---|---|
| BLM IV 1 mg/kg | BLM IV 10 mg/kg | BLM SC 200 mg | Placebo | |||||
| AMA (+) | AMA (−) | AMA (+) | AMA (−) | AMA (+) | AMA (−) | AMA (+) | AMA (−) | |
| n = 366 | n = 193 | n = 683 | n = 350 | n = 391 | n = 165 | n = 733 | n = 344 | |
| Renal flares during follow-up, n (%) | 7 | 7 | 37 | 32 | 16 | 10 | 56 | 27 |
| Person-years of follow-up | 378.6 | 204.9 | 657.3 | 328.7 | 352.7 | 143.8 | 685.6 | 302.1 |
| Rate of renal flares per 1000 person-years (95% CI) | 18.5 (7.4, 38.1) | 34.2 (13.7, 70.4) | 56.3 (39.6, 77.6) | 97.4 (66.6, 137.4) | 45.4 (25.9, 73.7) | 69.6 (33.4, 127.9) | 81.7 (61.7, 106.1) | 89.4 (58.9, 130.0) |
| Unadjusted HR (95% CI) | 0.2 | 0.4 | 0.6 | 1.1 | 0.5 | 0.8 | 0.9 | 1.0 (reference) |
| (0.1, 0.5) P < 0.001 | (0.2, 0.9) P = 0.032 | (0.4, 1.0) P = 0.071 | (0.7, 1.9) P = 0.664 | (0.3, 0.9) P = 0.027 | (0.4, 1.6) P = 0.456 | (0.6, 1.5) P = 0.736 | ||
| Adjusted HR (95% CI) | 0.3 | 0.6 | 0.4 | 1.0 | 0.8 | 1.2 | 1.0 | 1.0 (reference) |
| (0.2, 0.5) P < 0.001 | (0.3, 1.2) P = 0.173 | (0.3, 0.7) P = 0.002 | (0.5, 1.9) P = 0.936 | (0.6, 1.2) P = 0.348 | (1.0, 1.5) P = 0.020 | (0.7, 1.4) P = 0.959 | ||
| Renal BILAG A, D at baseline subgroup (n = 1761) | ||||||||
|---|---|---|---|---|---|---|---|---|
| BLM IV 1 mg/kg | BLM IV 10 mg/kg | BLM SC 200 mg | Placebo | |||||
| AMA (+) | AMA (−) | AMA (+) | AMA (−) | AMA (+) | AMA (−) | AMA (+) | AMA (−) | |
| n = 159 | n = 79 | n = 437 | n = 193 | n = 203 | n = 86 | n = 410 | n = 194 | |
| Renal flares during follow-up, n (%) | 7 | 6 | 37 | 30 | 14 | 9 | 53 | 25 |
| Person-years of follow-up | 157.0 | 80.3 | 399.0 | 169.9 | 180.0 | 73.3 | 357.5 | 161.6 |
| Rate of renal flares per 1000 person-years (95% CI) | 44.6 (17.9, 91.9) | 74.8 (27.4, 162.7) | 92.7 (65.3, 127.8) | 176.5 (119.1, 252.0) | 77.8 (42.5, 130.5) | 122.8 (56.2, 233.2) | 148.2 (111.0, 193.9) | 154.7 (100.1, 228.3) |
| Unadjusted HR (95% CI) | 0.3 | 0.5 | 0.6 | 1.2 | 0.5 | 0.8 | 0.9 | 1.0 (reference) |
| (0.1, 0.7) P = 0.004 | (0.2, 1.2) P = 0.140 | (0.4, 1.0) P = 0.044 | (0.7, 2.0) P = 0.603 | (0.3, 1.0) P = 0.035 | (0.4, 1.7) P = 0.512 | (0.6, 1.5) P = 0.829 | ||
| Adjusted HR (95% CI) | 0.4 | 0.6 | 0.5 | 1.1 | 0.8 | 1.2 | 1.0 | 1.0 (reference) |
| (0.2, 0.5) P < 0.001 | (0.3, 1.5) P = 0.282 | (0.3, 0.7) P = 0.001 | (0.6, 1.7) P = 0.830 | (0.6, 1.2) P = 0.329 | (0.9, 1.6) P = 0.130 | (0.8, 1.4) P = 0.756 | ||
| Renal BILAG E at baseline subgroup (n = 1464) | ||||||||
|---|---|---|---|---|---|---|---|---|
| BLM IV 1 mg/kg | BLM IV 10 mg/kg | BLM SC 200 mg | Placebo | |||||
| AMA (+) | AMA (−) | AMA (+) | AMA (−) | AMA (+) | AMA (−) | AMA (+) | AMA (−) | |
| n = 207 | n = 114 | n = 246 | n = 157 | n = 188 | n = 79 | n = 323 | n = 150 | |
| Renal flares during follow-up, n (%) | 0 | 1 | 0 | 2 | 2 | 1 | 3 | 2 |
| Person-years of follow-up | 221.6 | 124.6 | 258.3 | 158.7 | 172.7 | 70.5 | 328.1 | 140.5 |
| Rate of renal flares per 1000 person-years (95% CI) | 2.8 | 0.0 | 4.8 | 0.0 | 12.3 | 11.6 | 9.1 | 14.2 |
| (0.1, 16.1) | (0.0, 16.6) | (0.6, 17.3) | (0.0, 14.3) | (2.5, 36.1) | (1.4, 41.8) | (1.9, 26.7) | (1.7, 51.4) | |
Incidence rate and hazard rations are presented for the pooled study population, and for the subgroups of patients with renal BILAG A–D and renal BILAG E at baseline.
Cox regression models were adjusted for age, sex, ethnicity, extra-renal clinical SLEDAI-2K score, SDI score, proteinuria, anti-dsDNA positivity, low C3, low C4, use of glucocorticoids, and use of immunosuppressants. The model for the pooled population was additionally adjusted for current or previous renal involvement (renal BILAG A–D vs BILAG E at baseline).
BLM: belimumab; IV: intravenous; SC: subcutaneous; SDI: SLICC/ACR Damage Index; SLEDAI-2K: SLEDAI 2000.
Compared with patients receiving placebo without AMA, the risk of renal flares was lower for patients receiving i.v. belimumab 1 mg/kg in combination with AMA (HR: 0.21; 95% CI: 0.09, 0.49; P < 0.001), s.c. belimumab 200 mg in combination with AMA (HR: 0.50; 95% CI: 0.27, 0.92; P = 0.027), and i.v. belimumab 1 mg/kg but not AMA (HR: 0.40; 95% CI: 0.18, 0.93; P = 0.032) in unadjusted models. In multivariable models, i.v. belimumab 1 mg/kg in combination with AMA yielded a nearly 70% reduction in the risk of renal flares compared with placebo without AMA (HR: 0.31; 95% CI: 0.18, 0.54; P < 0.001), and use of i.v. belimumab 10 mg/kg in combination with AMA yielded a 56% reduction in the risk to develop renal flares (HR: 0.44; 95% CI: 0.26, 0.74; P = 0.002). Similar estimates were found in the subgroup analysis of the baseline renal BILAG A–D population (Table 4). We further confirmed the joint effect of AMA and (i) i.v. belimumab 1 mg/kg and (ii) i.v. belimumab 10 mg/kg by testing the interaction between these medications. Results from this analysis are detailed in Supplementary Table S8, available at Rheumatology online.
Discussion
We investigated the effect of different doses and pharmaceutical forms of belimumab as well as that of AMA on the development of renal flares in patients who received therapy for active extra-renal SLE from four RCTs. Overall, we observed a low risk of renal flares in patients with no prior renal involvement, irrespective of therapy. Among belimumab doses and forms, i.v. belimumab 1 mg/kg yielded the lowest incidence of renal flares. In multivariable Cox regression analysis, patients receiving i.v. belimumab 1 mg/kg and i.v. belimumab 10 mg/kg had a lower risk of renal flare development compared with those receiving placebo. Furthermore, use of AMA was independently associated with a protection against renal flares. The protection conferred was enhanced when belimumab and AMA were administered in a combined regimen.
Previous investigations have reported favourable effects of belimumab on renal outcomes [9, 11, 20]. In the phase III BLISS-LN trial, which enrolled patients with active, biopsy-proven LN, patients who received add-on i.v. belimumab 10 mg/kg more frequently attained renal response and had a lower risk of renal-related events or death compared with patients who received placebo [9]. In a post-hoc analysis of the BLISS-52 and BLISS-76 trials, patients allocated to i.v. belimumab 1 mg/kg and 10 mg/kg achieved renal improvement and remission more frequently, and experienced fewer renal flares than patients who received placebo; however, the frequency of these renal outcomes was low, and the investigation was presumably underpowered to yield statistically significant differences [11]. Encouraging results were documented in the Italian BeRLiSS-LN cohort of SLE patients with renal involvement treated with belimumab [20], and reductions in proteinuria were seen in patients with active renal disease who received belimumab in a Swedish cohort [21].
In our analysis, patients allocated to i.v. belimumab 1 mg/kg exhibited the lowest incidence rate of renal flares as well as the most consistent and pronounced protective effect in survival analysis across the different belimumab formulations. It could be hypothesized that belimumab pharmacokinetics and pharmacodynamics lie under this observation. In the subgroup of patients with active LN and elevated proteinuria levels, in whom belimumab clearance is expected to be higher, high-dose i.v. belimumab (10 mg/kg) has been shown to be effective. In contrast, in the subgroup of patients with active extra-renal SLE and lower proteinuria levels, in whom belimumab clearance is comparatively lower [22], lower doses of belimumab may exert an optimal protection against renal flares. In this respect, one investigator-initiated RCT testing the efficacy of i.v. belimumab doses lower than 10 mg/kg (120 mg as a fixed dose) on flare prevention is currently ongoing in China [23].
Several cases of de novo LN in patients treated with the approved dose of belimumab for reasons other than nephritis have been reported [12–16]. It has been speculated that these observations may be due to potential suppressive effects of belimumab on B cells that acquire regulatory properties at active SLE [12, 24], partly based on observations that serum levels of IL-10 decreased prominently and rapidly upon belimumab treatment in SLE patients from Sweden [25]. Nevertheless, despite an increasing understanding of the immunological effects exerted by belimumab [24, 26–29], its influence on regulatory B-cell populations remains unknown. Differential effects of different belimumab doses on B-cell subpopulations may shed light on the mechanisms underlying our observations.
In our subgroup analysis of patients with renal BILAG E at baseline (i.e. no current or prior renal involvement), <1% of the study participants developed renal flares during the study period, and no signals of elevated risk for renal flares among patients receiving belimumab were detected. There are several differences between the aforementioned real-world observational studies and the RCT population of the present study regarding patient populations, definitions of outcomes, and study design, including the lack of a placebo-receiving control group in the reported case series. Nevertheless, in the highly selected RCT population of the present study, patients receiving belimumab for active extra-renal SLE were not found to be at an increased risk of developing de novo LN during the first 52–76 weeks of treatment.
Use of AMA is associated with many beneficial effects in patients with SLE, including protection against organ damage accrual, overall flares, cardiovascular events and progression to ESKD. Moreover, AMA use has been associated with lower serum levels of BAFF [30] and a more favourable experience of health-related quality of life (HRQoL) [31]. Still, evidence on the effects of AMA on prevention of renal flares is not conclusive, as previous studies comprised relatively small populations and were often in the context of therapy withdrawal after achieving remission [12, 32–35]. We herein found a robust protective effect against development of renal flares in a multi-ethnic population with active SLE, both in the entire study population and in the subgroup of patients with current or prior renal involvement. Our findings provide further support for the use of AMA in all patients with SLE unless contraindicated, as recommended [2, 3, 36–38].
Our exploratory analysis of the joint effect of belimumab and AMA suggests that the protection against renal flares conferred from belimumab is enhanced when belimumab is co-administered with AMA. Within each belimumab arm, the risk of renal flares was lower when AMA was co-administered, and the group presenting the overall lowest risk was the one who received combination of i.v. low-dose belimumab and AMA. Such synergistic effects have been reported previously, regarding increased protection against the development of LN [12], greater reductions in IgA and IgG aCL titres [39], and greater benefits in HRQoL [40]. AMA therapy has been shown to be associated with lower BAFF levels in SLE patients [30], likely due to reduced type I IFN-mediated BAFF excretion. This consequence of AMA therapy may lie under an enhanced biological effect of belimumab and, subsequently, an enhanced clinical benefit.
Our analyses are not exempt from limitations. Exposure to AMA was based on prescriptions during a 30-day period prior to the trial initiation. Considering that non-adherence to AMA is common in SLE [41], there exists a risk of misclassification in our analysis. Unfortunately, we lacked information on hydroxychloroquine blood concentrations or adherence estimates by other means to account for this potential bias. Nevertheless, we expect to have underestimated the true effect of AMA on renal flare prevention due to this potential non-differential misclassification. Because belimumab was the drug under investigation in the BLISS trials, and considering the closely monitored RCT setting, the risk for misclassification does not apply to this medication. Furthermore, the RCTs had different eligibility cut-offs for disease activity at screening (SELENA-SLEDAI score ≥6 for BLISS-52 and BLISS-76, and ≥8 for BLISS-SC and BLISS-NEA), which we addressed through adjustment for baseline disease activity in Cox regression models. Finally, our findings cannot be generalized to the entire SLE population, as the BLISS trials comprised patients with moderate-to-high disease activity but excluded patients with severe active LN and NPSLE.
Strengths of this investigation included the largest-to-date study population for investigating the effect of belimumab and AMA on renal flare prevention, participation of patients of diverse ethnic origins, and the completeness and homogeneity of data across the trials, which conferred power in statistical analyses and allowed subgroup analyses as well as adjustments for multiple factors in regression models.
Conclusion
We found that the benefit conferred from belimumab against renal flare development in SLE patients treated for active extra-renal disease was enhanced in the presence of AMA. The more consistent protective effects seen in the low-dose i.v. belimumab arm warrant mechanistic investigation of the differential effects of different belimumab doses on B-cell subsets with regulatory properties. Our findings also corroborated the beneficial effects of AMA against the development of renal flares, and support its use in all SLE patients, irrespective of activity state or organ involvement, unless contraindicated. In an era of rapidly evolving drug research enriching the therapeutic repertoire for LN, drugs of older generations should not be neglected. In this regard, combination regimens may constitute optimal therapeutical approaches towards favourable renal outcomes in SLE.
Supplementary material
Supplementary material is available at Rheumatology online.
Data availability
The datasets used and analysed during the current study can be made available through the Clinical Study Data Request (CSDR) consortium.
Contribution statement
Conception and design of the work: A.G., I.P. Data management: A.G., I.P. Statistical analysis and interpretation of data: all authors. Critical revision of the manuscript for important intellectual content: all authors. All authors reviewed and approved the final version of the manuscript prior to submission and agree to be accountable for all aspects of the work.
Funding
This work was supported by grants from the Swedish Rheumatism Association (R-941095 to I.P. and R-939149 to C.S.); King Gustaf V’s 80-year Foundation (FAI-2020–0741 to I.P. and FAI-2020–0663 to C.S.); Professor Nanna Svartz Foundation (2020–00368); Swedish Society of Medicine (SLS-974449); Nyckelfonden (OLL-974804); Ulla and Roland Gustafsson Foundation (2021–26); Region Östergötland (ALF Grants; RÖ-932055); Region Stockholm (FoUI-955483); and Karolinska Institutet. The funders were not involved in the study design, collection, analysis, interpretation of data, the writing of this article, or the decision to submit it for publication.
Disclosure statement: I.P. has received research funding and/or honoraria from Amgen, AstraZeneca, Aurinia Pharmaceuticals, Elli Lilly and Company, Gilead Sciences, GlaxoSmithKline, Janssen Pharmaceuticals, Novartis, Otsuka Pharmaceutical and F. Hoffmann-La Roche AG. The authors declare no other conflicts of interest.
Acknowledgements
The authors would like to thank GlaxoSmithKline (Uxbridge, UK) for sharing the data from the BLISS-52 (NCT00424476), BLISS-76 (NCT00410384), BLISS-SC (NCT01484496) and BLISS-NEA (NCT01345253) trials with the CSDR consortium, as well as all participating patients.

Comments