


Abstract
The management of neuropsychiatric systemic lupus erythematosus (NPSLE) poses considerable challenges due to limited clinical trials. Therapeutic decisions are customized based on suspected pathogenic mechanisms and symptoms severity. This study aimed to investigate therapeutic strategies and disease outcome for patients with NPSLE experiencing their first neuropsychiatric (NP) manifestation.
This retrospective cohort study defined NP events according to the American College of Rheumatology case definition, categorizing them into three clusters: central/diffuse, central/focal and peripheral. Clinical judgment and a validated attribution algorithm were used for NP event attribution. Data included demographic variables, SLE disease activity index, cumulative organ damage, and NP manifestation treatments. The clinical outcome of all NP events was determined by a physician seven-point Likert scale. Predictors of clinical improvement/resolution were investigated in a multivariable logistic regression analysis.
The analysis included 350 events. Immunosuppressants and corticosteroids were more frequently initiated/escalated for SLE-attributed central diffuse or focal NP manifestations. At 12 months of follow-up, 64% of patients showed a clinical improvement in NP manifestations. Focal central events and SLE-attributed manifestations correlated with higher rates of clinical improvement. Patients with NP manifestations attributed to SLE according to clinical judgment and treated with immunosuppressants had a significantly higher probability of achieving clinical response (OR 2.55, 95%CI 1.06–6.41, P = 0.04). Age at diagnosis and focal central events emerged as additional response predictors.
NP manifestations attributed to SLE by clinical judgment and treated with immunosuppressants demonstrated improved 12-month outcomes. This underscores the importance of accurate attribution and timely diagnosis of NPSLE.
Tailoring therapeutic approaches in neuropsychiatric systemic lupus erythematosus is crucial, with treatment choices guided by the clinical phenotype.
Strategic integration of clinical judgment and validated algorithms improves decision-making in neuropsychiatric systemic lupus erythematosus treatment.
Accurate attribution and timely immunosuppressant use improve 12-month outcomes in neuropsychiatric systemic lupus erythematosus.
Introduction
Neuropsychiatric (NP) involvement in systemic lupus erythematosus (SLE) is still a difficult and challenging manifestation of the disease, including diverse clinical syndromes, and associates with a significant impact on patients’ quality of life and survival [1–4]. The 1999 American College of Rheumatology (ACR) nomenclature and case definitions for NPSLE remain the milestone for classification and reporting purposes, consisting of 19 different clinical syndromes [4]. Besides, treatment of NPSLE is particularly insidious for clinicians, and therapeutic decisions are made per individual patients, and based on the suspected pathogenic mechanism and the severity of manifestations [5, 6]. The complex and heterogeneous nature of NPSLE deprives this complication of validated disease activity instruments supporting specific interventions, and such a lack of standardization for defining NPSLE involvement and activity is one of the most important barriers to testing new therapeutic strategies or drugs in controlled clinical trials (RCTs) [7, 8]. In addition, reliable biomarkers for diagnosis and response to treatment (e.g. outcome measurement instruments) are still not available, and the definition of ‘meaningful changes’ remains based on physician judgement [9].
Given these limitations, treatment decisions in clinical practice are primarily informed by expert opinion in accordance with available international recommendations [10–12], mostly derived from cohort studies [13–15]. After a correct diagnosis and attribution process, clinicians aim to subdivide events according to the hypothesized pathogenic mechanism that is thought to drive the clinical manifestation [5]. This diagnostic/therapeutic process is not easy. A clear phenotypic differentiation between inflammatory and thrombotic events is not universally clear-cut, as the true pathogenic mechanism might be equivocal in some cases [11, 14, 16, 17]. The need for a continuous re-assessment, ideally in multidisciplinary teams, of patients with NP events deemed to be SLE-related has been advocated by some authors [18, 19], and this is an option for clinicians to avoid misclassification and over- or under-treatment [18].
To facilitate understanding of the implications of immunosuppressive treatment in patients with NPSLE, we took advantage of a large international multicentre retrospective cohort, aiming to estimate the probability of immunosuppressive treatment and its impact on 12-month disease outcomes in SLE patients with their initial ACR-defined NP event (overall and by NP cluster). Our secondary objectives were: (i) to estimate the probability of immunosuppressive treatment in SLE patients with the first ACR-NP event, based on treating physician and Italian algorithm attribution [20, 21]; (ii) to analyse the associations between clinical variables and immunosuppressive therapy; and (iii) to explore clinical variables for prediction of response to immunosuppressive therapy in patients experiencing ACR-defined NP events stratified for clinical judgment and attribution algorithm.
Materials and methods
Study design
This study follows a retrospective cohort design. Patients were selected from a large retrospective database of SLE patients attending nine tertiary care clinics from Italy (six centres), Greece, Brazil and Canada. Patients from each centre were eligible if they satisfied the 1997 revised ACR classification criteria for SLE [22] and had their first-ever NP events, as defined in the ACR case definitions of 19 NP syndromes [4]. The study was conducted in accordance with the Declaration of Helsinki and approved by the Ethics Committee of Azienda Ospedaliera Universitaria di Ferrara. Informed consent was obtained from all subjects involved in the study.
Participants
Data were retrospectively collected for all patients by reviewing their clinical charts from 1999 up to 2015. Access to medical records, particularly from earlier time periods, was primarily in physical format. For completeness and quality of the data collected, we retrieved from the original dataset only NP events observed after 1999, corresponding to the year of publication of ACR nomenclature. Demographic variables registered for each patient included sex, ethnicity, age at diagnosis of SLE and disease duration at the first NP event, SLE Disease Activity Index–2000 (SLEDAI-2K) and Systemic Lupus International Collaborating Clinics/American College of Rheumatology (SLICC/ACR) Damage Index (SDI) at the first NP event [23, 24]. The study started on 1 January 2012 and was approved by the Review Board of the Coordinator Centre.
Exposure
For the purposes of this study, we recorded the therapeutic approach adopted for each NP event including (i) immunosuppressants; (ii) antiaggregant and/or anticoagulant; (iii) corticosteroids: medium or low dose (5–7.5 mg/day up to 0.5 mg/kg/day), high dosage (1–2 mg/kg/day) or pulse therapy with intravenous (IV) methylprednisolone (MP; 500–1000 mg on one to three administrations) for moderate/severe disease; (iv) conservative, symptomatic or supportive therapy (i.e. anticonvulsant, antidepressant, antipsychotic, analgesic); and (v) antimalarials. The immunosuppressants considered for the NP complication included cyclophosphamide (Euro-lupus low-dose regimen or National Institute of Health lupus regimen), azathioprine, mycophenolate mofetil, ciclosporin A, methotrexate, leflunomide, rituximab or belimumab. Cycles of intravenous immunoglobulin (IVIG) and plasmapheresis (PEX), used as possible induction therapy, were also considered. All treatment modifications, defined as starting (new course) therapy or increasing (posology augmentation) ongoing treatment, required for the NP were recorded. Induction therapy was defined in the presence of a high dosage of corticosteroids and/or immunosuppressive therapy started or increased for the ongoing NP manifestation.
Clustering of events
NP manifestations were clustered into three subgroups for additional analysis: focal central nervous system (CNS), diffuse CNS and peripheral nervous system (PNS) manifestations categorized per ACR recommendations (Supplementary Table S1, available at Rheumatology online) [4]. Focal central events were cerebrovascular disease, movement disorder, myelopathy, and seizure disorders; diffuse central events were aseptic meningitis, demyelinating syndrome, headache, acute confusional state, anxiety disorder, cognitive dysfunction, mood disorder, psychosis; peripheral events were Guillain Barre syndrome, autonomic neuropathy, mononeuropathy, myasthenia gravis, cranial neuropathy, plexopathy, polyneuropathy.
Attribution of NP event
The attribution of NP event to SLE was established dually, and as described elsewhere, employing both clinical judgment and a validated algorithm, the latter applied retrospectively to the cohort [20, 21]. The algorithm included four items: (i) the timing of onset of the NP event (i.e. before, >6 months; concurrent, within 6 months or after SLE diagnosis); (ii) the type of NP event (major vs minor or common, according to Ainiala et al. [25]); (iii) the presence of confounding non-SLE factors (i.e. ‘associations’ suggested in the glossary for the 1999 ACR case definitions); and (iv) the presence of ‘favouring factors’ (i.e. supporting attribution) [25]. Considering that ‘response to immunosuppression’ was initially part of the favoring factors in the original algorithm, we removed this item to avoid circular reasoning. Subsequently, we recalculated the algorithm across the entire cohort.
Outcome of NP event
We adopted a physician global assessment tool, specifically the 7-point Likert scale, to retrospectively evaluate clinical outcomes extracted from medical records. At each participating centre, a designated experienced clinician, familiar with the case, consistently employed this scale to assess the outcomes of the manifestations and document the assessments in the clinical chart. The outcome was defined comparing the change in NP status between the onset of the event and the time of study assessment: 1 = patient demise, 2 = much worse, 3 = worse, 4 = no change, 5 = improved, 6 = much improved, 7 = resolved [9, 26]. A score greater or equal to 5 was considered a positive outcome.
Statistical methods
Descriptive analyses were used to summarize all data with mean and standard deviation or median and interquartile range where appropriate. Comparison of continuous data with a normal distribution was performed using the t test; continuous data with a non-parametric distribution were analysed using Wilcoxon's rank-sum test. A comparison of categorical data was performed using the χ2 test or Fisher's exact test if appropriate. To explore potential selection bias, we first compared baseline characteristics between participants included in the analytical sample and those excluded. The performance of the revised algorithm compared with the original one was evaluated with linear regression, logistic regression for the classification of NPSLE and an estimating ROC curve.
An explorative univariable logistic regression analysis was performed to find candidate predictors of immunosuppressive treatment. Then, a multivariable analysis was performed including age, sex, clinical judgment attribution, Italian algorithm attribution, event type, SLEDAI-2k and SDI. SLEDAI and SDI were dichotomized according to clinical significance (SLEDAI-2k ≥6 for active disease, SDI ≥ 1 for damage accrual).
In an alternative logistic regression analysis, we explored the role of candidate variables in the prediction of response after the NP event (12 months), defined as Likert scale ≥5. The following variables were considered in the univariable analysis: age, sex, age at SLE onset, disease duration, event type, timing of NP event, antiphospholipid (aPL) status, SLEDAI-2K, SDI, clinical judgment attribution, Italian attribution algorithm, type of organ involvement, immunosuppressants, corticosteroids, hydroxychloroquine, antiplatelet and anticoagulant. The immunosuppressive therapy variable was stratified for attribution to SLE. Two multivariable logistic regression models for prediction of response to immunosuppressive therapy (respectively stratified for clinical judgment and algorithm attribution) were fitted with age at SLE diagnosis, sex, type of NP event, SLEDAI-2K and SDI as potential confounders. All analyses were performed with RStudio© [27].
Results
Flowchart, dropouts and performance of revised algorithm
From 446 patients with a diagnosis of SLE and a first NP event, 362 patients completed the 12-month follow-up and 350 were included in the final analysis (Supplementary Fig. S1, available at Rheumatology online). The main reason for dropout was lost-to-follow-up (n = 75). Dropout patients had significantly lower frequencies of some ACR manifestations (renal, haematological, immunological, ANA, arthritis, discoid lupus and malar rash), higher mean age and comparable disease activity and damage with respect to included patients (Supplementary Table S2, available at Rheumatology online). The application of the revised algorithm showed strong correlation with the original (r = 0.99), and only seven patients previously classified as NPSLE by the original score were not classified as NPSLE by the reviewed algorithm, resulting in an AUC of 0.98 (Supplementary Fig. S2, available at Rheumatology online).
Baseline characteristics
Baseline characteristics of included patients are presented in Table 1 and Supplementary Table S2 (available at Rheumatology online). Patients with attributed NP manifestation based on clinical judgment were younger, with a higher percentage of males and with higher average SLEDAI-2K. Moreover, they had higher frequencies of aPL antibody positivity and aPL syndrome. Similarly, patients with NPSLE attributed with the Italian algorithm had higher percentages of male patients and higher mean SLEDAI. In most cases, the NP event occurred after SLE diagnosis.
Baseline characteristics of SLE patients with NP manifestations categorized according to attribution by clinical judgment and the Italian algorithm
| Clinical judgement | Algorithm attribution | ||||||
|---|---|---|---|---|---|---|---|
| Overall, N = 350 | No, N = 165 | Yes, N = 185 | P-valuea | No, N = 194 | Yes, N = 155 | P-valuea | |
| General and disease-related variables | |||||||
| Male, n (%) | 33 (9.4) | 8 (4.8) | 25 (14) | ** | 9 (4.6) | 24 (15) | *** |
| Age at diagnosis (years), mean (SD) | 35 (13) | 36 (13) | 34 (14) | ** | 35 (13) | 35 (14) | — |
| Age at NP event (years), mean (SD) | 40 (13) | 43 (13) | 38 (13) | ** | 41 (13) | 39 (14) | — |
| Timing of NP event, n (%) | *** | *** | |||||
| After SLE diagnosis | 249 (71) | 131 (79.4) | 118 (64) | 156 (80) | 92 (59.4) | ||
| Before SLE diagnosis | 27 (8) | 17 (10.3) | 10 (5) | 25 (13) | 2 (1.3) | ||
| Concurrent to SLE diagnosis | 74 (21) | 17 (10.3) | 57 (31) | 13 (7) | 61 (39.4) | ||
| aPL syndrome, n (%) | 40 (11) | 13 (7.9) | 27 (15) | * | 15 (7.7) | 25 (16) | * |
| aPL positivity, n (%) | 151 (44) | 60 (37) | 91 (51) | ** | 79 (42) | 72 (48) | — |
| SLEDAI-2K, mean (SD) | 9 (8) | 6 (6) | 12 (9) | *** | 7 (7) | 12 (9) | *** |
| SDI, mean (SD) | 0.74 (1.11) | 0.68 (0.96) | 0.80 (1.23) | — | 0.77 (1.11) | 0.71 (1.12) | — |
| Event type, n (%) | *** | *** | |||||
| Diffuse central | 218 (62) | 130 (79) | 88 (48) | 167 (86) | 50 (32) | ||
| Focal central | 79 (23) | 21 (13) | 58 (31) | 15 (7.7) | 64 (41) | ||
| Peripheral | 53 (15) | 14 (8.5) | 39 (21) | 12 (6.2) | 41 (26) | ||
| ACR manifestations | |||||||
| Malar rash, n (%) | 164 (47) | 71 (43) | 93 (50) | — | 87 (45) | 77 (50) | — |
| Discoid rash, n (%) | 44 (13) | 24 (15) | 20 (11) | — | 21 (11) | 23 (15) | — |
| Photosensitivity, n (%) | 161 (46) | 80 (48) | 81 (44) | — | 89 (46) | 71 (46) | — |
| Oral nasal ulcers, n (%) | 80 (23) | 41 (25) | 39 (21) | — | 42 (22) | 38 (25) | — |
| Serositis, n (%) | 69 (20) | 32 (19) | 37 (20) | — | 31 (16) | 38 (25) | * |
| Arthritis, n (%) | 240 (69) | 126 (76) | 114 (62) | ** | 137 (71) | 102 (66) | — |
| Glomerulonephritis, n (%) | 67 (19) | 27 (16) | 40 (22) | — | 32 (16) | 35 (23) | — |
| Hematologic disorder, n (%) | 155 (44) | 66 (40) | 89 (48) | — | 78 (40) | 77 (50) | * |
| Immunologic disorder, n (%) | 231 (66) | 94 (57) | 137 (74) | *** | 116 (60) | 115 (74) | ** |
| Antinuclear antibodies, n (%) | 323 (92) | 155 (94) | 168 (91) | — | 178 (92) | 144 (93) | — |
| Ongoing treatments | |||||||
| Antiaggregant, n (%) | 71 (20) | 37 (22) | 34 (18) | — | 53 (27) | 18 (12) | *** |
| Anticoagulant, n (%) | 23 (6.6) | 7 (4.2) | 16 (8.6) | — | 8 (4.1) | 15 (9.7) | * |
| Hydroxychloroquine, n (%) | 192 (55) | 112 (68) | 80 (43) | *** | 124 (64) | 68 (44) | *** |
| Immunosuppressant, n (%) | 62 (18) | 33 (20) | 29 (16) | — | 37 (19) | 25 (16) | — |
| Glucocorticoids, n (%) | 149 (43) | 82 (50) | 67 (36) | * | 103 (53) | 45 (29) | *** |
| Anticonvulsant, n (%) | 28 (8.4) | 2 (1.3) | 26 (15) | *** | 3 (1.6) | 25 (17) | *** |
| Antidepressant, n (%) | 92 (27) | 64 (41) | 28 (16) | *** | 68 (37) | 24 (16) | *** |
| Antipsychotic, n (%) | 17 (5.1) | 4 (2.5) | 13 (7.3) | * | 5 (2.7) | 12 (8.1) | * |
| Analgesic, n (%) | 55 (16) | 31 (20) | 24 (13) | — | 42 (23) | 13 (8.7) | *** |
Pearson’s Chi-squared test; Wilcoxon rank sum test.
P-values codes: ***P < 0.001; **0.001 ≤ P ≤ 0.01; * 0.01 < P ≤ 0.05; –P > 0.05.
ACR: American College of Rheumatology; aPL: anti-phospholipid; NP: neuropsychiatric; SDI: SLICC damage index; SLE: systemic lupus erythematosus; SLEDAI-2k: Systemic Lupus Erythematosus Disease Activity Index 2000.
Patterns of treatment
Patients with NP diffuse or focal (central) events attributed with the algorithm were treated more frequently with immunosuppressants and corticosteroids, initiated or escalated at the time of the NP event (Table 2). For events attributed with clinical judgment a similar pattern of treatment was observed (Supplementary Table S4, available at Rheumatology online). Hydroxychloroquine was started more often in patients with NP-attributed manifestations. In univariable logistic regression analysis, attribution to SLE by clinical judgment (OR 5.06, 95%CI 3.08–8.55, P < 0.001) or algorithm (OR 5.29, 95%CI 3.28–8.68, P < 0.001), SLEDAI-2k ≥6 (OR 6.15, 95%CI 3.43–11.69, P < 0.001), focal central (OR 2.81, 95%CI 1.64–4.83, P < 0.001) or peripheral events (OR 2.51, 95%CI 1.34–4.69, P = 0.004), NP events concurrent with SLE diagnosis (OR 4.15 95%CI 2.42–7.21, P < 0.001), all associated with an increased probability of starting (escalating) an immunosuppressant for the NP manifestation. Conversely, age at SLE diagnosis (OR 0.98, 95%CI 0.96–1.00, P = 0.020), age at NP event (OR 0.97, 95%CI 0.95–0.99, P < 0.001), aPL positivity (OR 0.48, 95%CI 0.30–0.76, P = 0.002) and SDI ≥1 (OR 0.26, 95%CI 0.15–0.43, P < 0.001) associated with a reduced probability of immunosuppressive treatment. In multivariable analysis, algorithm attribution (OR 4.32, 95%CI 1.94–9.85, P < 0.001) and SLEDAI-2k ≥ 6 (OR 5.64, 95%CI 2.69–12.64, P < 0.001) were predictors of immunosuppressant administration for NP event. Conversely SDI ≥ 1 (OR 0.17, 95%CI 0.08–0.33, P < 0.001) was negatively associated with immunosuppressive therapy (Fig. 1).
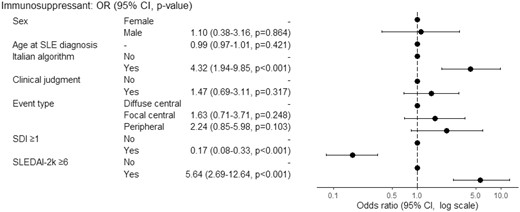
Multivariable logistic regression analysis for association between immunosuppressive therapy and clinical variables. OR > 1 means favour to immunosuppressive therapy, OR< 1 means against to immunosuppressive therapy, OR = 1 means no effect. OR: odds ratio; SDI: SLICC damage index; SLE: systemic lupus erythematosus; SLEDAI-2k: Systemic Lupus Erythematosus Disease Activity Index 2000
Pattern of treatment, started or increased for NP event, between patients with and without NP events attributed to SLE with the Italian algorithm
| Diffuse central | Focal central | Peripheral | ||||||||||
|---|---|---|---|---|---|---|---|---|---|---|---|---|
| Overall, N = 217 | Not AA, N = 167 | AA, N = 50 | P-valueb | Overall, N = 79 | Not AA, N = 15 | AA, N = 64 | P-valueb | Overall, N = 53 | Not AA, N = 12 | AA N = 41 | P-valueb | |
| ISsa | 24.9 | 16.8 (11.4, 23.3) | 52.0 (37.4, 66.3) | <0.001 | 48.1 | 20.0 (4.3, 48.1) | 54.7 (41.7, 67.2) | 0.02 | 45.3 | 25.0 (5.5, 57.2) | 51.2 (35.1, 67.1) | 0.2 |
| Antiaggregant | 7.4 | 5.4 (2.49, 10,0) | 14.0 (5.8, 26.7) | 0.06 | 39.2 | 40.0 (16.3, 67.7) | 39.1 (27.1, 52.1) | >0.9 | 15.1 | 0.0 | 19.5 (8.8, 34.9) | 0.2 |
| Anticoagulanta | 1.4 | 1.8 (0.37, 5.2) | 0.0 | >0.9 | 16.5 | 13.3 (1.7, 40.5) | 17.2 (8.9, 28.7) | >0.9 | 0.0 | 0.0 | 0.0 | — |
| HCQa | 11.5 | 7.2 (3.8, 12.2) | 26.0 (14.6, 40.3) | <0.001 | 32.9 | 13.3 (1.7, 40.5) | 37.5 (25.7, 50.5) | 0.1 | 18.9 | 8.3 (0.2, 38.5) | 22.0 (10.6, 37.6) | 0.4 |
| GCsa | 31.8 | 21.6 (15.6, 28.6) | 66.0 (51.2, 78.8) | <0.001 | 46.8 | 13.3 (1.7, 40.5) | 54.7 (41.7, 67.2) | 0.004 | 50.9 | 25.0 (5.5, 57.2) | 58.5 (42.1, 73.7) | 0.054 |
% (95% CI).
Fisher's exact test.
AA: attribution algorithm; GCs: glucocorticoids; HCQ: hydroxychloroquine; ISs: immunosuppressants.
Outcome
At 12 months of follow-up, 224/350 (64%) patients showed a clinical improvement of NP manifestations (Fig. 2). Patients with focal central events, mainly represented by cerebrovascular events, showed more frequently a clinical improvement (66/79, 83%) as well as patients with attributed events (algorithm 113/155, 72.9%; clinical judgment 135/85, 73.0%). A patient with cerebrovascular disease, one with cognitive dysfunction and one with cranial neuropathy died during follow-up. Two of these had a NPSLE and one had been treated with cyclophosphamide.
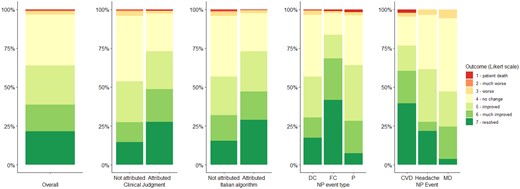
Outcome at 12 months of follow-up grouped by attribution to SLE and event type. Individual manifestations are displayed only for a numerical threshold ≥40 events. CVD: cerebrovascular disease; DC: diffuse central; FC: focal central; MD: mood disorder; NP: neuropsychiatric; P: peripheral; SLE: systemic lupus erythematosus
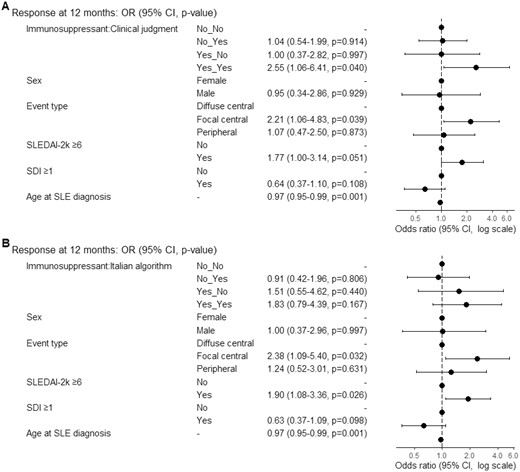
Multivariable logistic regression models for prediction of response. OR > 1 means favour to response, OR< 1 means against to response, OR = 1 means no effect. (A) The model was fitted with immunosuppressant therapy, clinical judgment attribution, sex, age at diagnosis, event type, SLEDAI-2k≥6 and SDI≥1. N in model=282, Missing=68, AIC=349, C-statistic=0.725. (B) The model was fitted with immunosuppressant therapy, Italian algorithm attribution, sex, age at diagnosis, event type, SLEDAI-2k≥6 and SDI≥1. N in model=281, Missing=69, AIC=350.3, C-statistic=0.719. OR: odds ratio; SDI: SLICC damage index; SLEDAI-2k: Systemic Lupus Erythematosus Disease Activity Index 2000
Predictors of response at univariable and multivariable analysis
In univariable analysis (Table 3), age at NP event, age at SLE diagnosis and SDI ≥1 were associated with a reduced probability of response (Likert scale ≥5) at 12 months of follow-up. Instead, SLEDAI-2K ≥6, focal central event, attribution to SLE (based on clinical judgment or Italian algorithm), events concurrent with SLE diagnosis, corticosteroids, induction and immunosuppressive treatment were predictive of response. Moreover, the combination of immunosuppressive therapy and clinical judgment attribution was associated with a higher probability of response.
Univariable logistic regression analysis for prediction of response (Likert scale ≥5) at 12 months of follow-up
| Variables | Non-responders | Responders | OR (95%CI, P-value) | |
|---|---|---|---|---|
| Sex, n (%) | Female | 116 (36.6) | 201 (63.4) | — |
| Male | 8 (25.8) | 23 (74.2) | 1.66 (0.75–4.07, P = 0.235) | |
| Age at diagnosis (years), mean (SD) | 38.6 (13.1) | 32.6 (13.1) | 0.97 (0.95–0.98, P < 0.001) | |
| Age at NP event (years), mean (SD) | 44.4 (12.4) | 37.3 (12.9) | 0.96 (0.94–0.98, P < 0.001) | |
| Timing of NP event, n (%) | After | 96 (38.7) | 152 (61.3) | — |
| Before | 9 (34.6) | 17 (65.4) | 1.19 (0.52–2.90, P = 0.683) | |
| Concurrent | 19 (25.7) | 55 (74.3) | 1.83 (1.04–3.33, P = 0.042) | |
| AA, n (%) | No | 83 (43.0) | 110 (57.0) | — |
| Yes | 41 (26.6) | 113 (73.4) | 2.08 (1.32–3.30, P = 0.002) | |
| CJ, n (%) | No | 75 (45.7) | 89 (54.3) | — |
| Yes | 49 (26.6) | 135 (73.4) | 2.32 (1.49–3.65, P < 0.001) | |
| Event type, n (%) | Diffuse central | 93 (42.9) | 124 (57.1) | — |
| Focal central | 13 (16.5) | 66 (83.5) | 3.81 (2.04–7.59, P < 0.001) | |
| Peripheral | 18 (34.6) | 34 (65.4) | 1.42 (0.76–2.71, P = 0.280) | |
| aPL syndrome, n (%) | No | 113 (36.6) | 196 (63.4) | — |
| Yes | 11 (28.2) | 28 (71.8) | 1.47 (0.72–3.18, P = 0.306) | |
| aPL positivity, n (%) | No | 69 (36.3) | 121 (63.7) | — |
| Yes | 52 (34.7) | 98 (65.3) | 1.07 (0.69–1.69, P = 0.753) | |
| SDI ≥ 1, n (%) | No | 51 (29.3) | 123 (70.7) | — |
| Yes | 58 (44.6) | 72 (55.4) | 0.51 (0.32–0.83, P = 0.006) | |
| SLEDAI2K ≥ 6, n (%) | No | 60 (48.4) | 64 (51.6) | — |
| Yes | 56 (29.5) | 134 (70.5) | 2.24 (1.40–3.60, P = 0.001) | |
| Antiaggregant, n (%) | No | 110 (37.5) | 183 (62.5) | — |
| Yes | 14 (25.5) | 41 (74.5) | 1.76 (0.94–3.48, P = 0.089) | |
| Anticoagulant, n (%) | No | 119 (35.8) | 213 (64.2) | — |
| Yes | 5 (31.2) | 11 (68.8) | 1.23 (0.44–3.98, P = 0.708) | |
| Hydroxychloroquine, n (%) | No | 108 (37.6) | 179 (62.4) | — |
| Yes | 16 (26.2) | 45 (73.8) | 1.70 (0.93–3.23, P = 0.094) | |
| Immunosuppressant, n (%) | No | 100 (43.1) | 132 (56.9) | — |
| Yes | 24 (20.7) | 92 (79.3) | 2.90 (1.75–4.96, P < 0.001) | |
| Glucocorticoids, n (%) | No | 91 (42.3) | 124 (57.7) | — |
| Yes | 33 (24.8) | 100 (75.2) | 2.22 (1.39–3.62, P = 0.001) | |
| Induction therapy, n (%) | No | 108 (42.0) | 149 (58.0) | — |
| Yes | 16 (17.6) | 75 (82.4) | 3.40 (1.92–6.34, P < 0.001) | |
| Immunosuppressant + CJ, n (%) | No+No | 66 (47.8) | 72 (52.2) | — |
| No+Yes | 34 (36.2) | 60 (63.8) | 1.62 (0.95–2.78, P = 0.079) | |
| Yes+No | 9 (34.6) | 17 (65.4) | 1.73 (0.74–4.31, P = 0.218) | |
| Yes+Yes | 15 (16.7) | 75 (83.3) | 4.58 (2.45–9.01, P < 0.001) | |
| Immunosuppressant + AA, n (%) | No+No | 75 (47.2) | 84 (52.8) | — |
| No+Yes | 25 (34.7) | 47 (65.3) | 1.68 (0.95–3.02, P = 0.078) | |
| Yes+No | 8 (23.5) | 26 (76.5) | 2.90 (1.29–7.21, P = 0.014) | |
| Yes+Yes | 16 (19.5) | 66 (80.5) | 3.68 (2.00–7.09, P < 0.001) |
AA: Italian attribution algorithm; CJ: clinical judgement; NP: neuropsychiatric; SDI: SLICC damage index; SLEDAI–2k: Systemic Lupus Erythematosus Disease Activity Index 2000.
A logistic regression model for prediction of response at 12 months was fitted with age at diagnosis, sex, event type, SDI ≥1, SLEDAI-2K ≥6. Patients with NP attributed to SLE according to CJ, who started immunosuppressants for NPSLE, had a significantly higher probability of achieving clinical response. Other significant predictors of response were age at diagnosis and the presence of focal central events.
A second model was fitted with algorithm attribution. The combination of immunosuppressant and algorithm attribution did not predict the response at 12 months (OR 1.83, 95%CI 0.79–4.39, P = 0.167) (Fig. 3).
Discussion
Our study demonstrated that patients with NP manifestations attributed to SLE based on clinical assessment and treated with immunosuppressants exhibited a significantly greater probability of achieving clinical response at the 12-month follow-up. We observed that the phenotype influenced the patterns of treatment, and specifically, in either attributed (according to clinical judgment or attribution algorithm) focal or diffuse manifestations, there was a stronger tendency to use conventional immunosuppressants and glucocorticoids as part of the initial treatment approach. Regarding the use of hydroxychloroquine, the timeframe of our study (spanning from 1999 to 2015) might have influenced prescription patterns due to the lack of specific recommendations for its widespread use among all individuals with SLE. In our patient cohort, a substantial number did not receive hydroxychloroquine, while we noted a higher frequency of its initiation at the time of NP manifestation, especially among patients experiencing NP-attributed events. Overall, our findings assume substantial relevance within the overarching therapeutic landscape of NPSLE, where there is a notable absence of relevant data, given that these patients are usually excluded from clinical trials. This exclusion is driven by the complexity and heterogeneity of clinical manifestations, further compounded by the lack of well-defined and standardized outcome measures for NP symptoms [26]. Our investigation addresses a critical gap in understanding potential treatment strategies. Current recommendations advocate for a therapeutic approach aimed at targeting the underlying pathophysiological mechanisms in NPSLE differentiating inflammatory or embolic/thrombotic/ischemic process. In the presence of inflammation, the use of glucocorticoids and/or immunosuppressive agents is warranted, whereas the presence of aPL antibodies leans towards a preference for anticoagulant/antithrombotic interventions [6, 28]. However, such theoretical propositions often face practical limitations when translated into clinical practice, especially in scenarios in which a precise etiological understanding remains elusive. This is particularly evident in the case of focal manifestations, such as cerebrovascular events, where an intricate collusion of ischemic and inflammatory mechanisms may confound the recognition of a univocal pathophysiological basis. The observations derived from tertiary referral centres specialized in patients with SLE and NP involvement reaffirm the intricate challenges in the management of cerebrovascular manifestations. In the study of Pamfil et al., within a cohort of 94 patients, 52% of cerebrovascular events necessitated a combined approach of immunosuppressive and antithrombotic therapy, owing to the presence of either concurrent generalized lupus activity or recurrence despite prior antithrombotic treatment [14]. In a further recent report limited to patients exhibiting NP inflammatory manifestations, cerebrovascular disease was evident in 30% of cases, sometimes alongside other manifestations [29]. These combined presentations, attributed to inflammation, required immunosuppressive treatment [29]. In this context, our experience of tailoring treatment based on the clinical phenotype of the manifestation—focal or diffuse, as long as it is attributed to lupus—while seemingly an oversimplification, could indeed serve as a robust and easy support for daily clinical practice.
Among the factors linked to immunosuppressant use for NP manifestations, we observed a positive association with both disease activity and attribution. These data align with existing literature and with the experts’ perspective that underscores the use of immunosuppressive agents in specific clinical contexts such as when there is an escalation of generalized (non-neurological) lupus disease activity or a flare in the presence of neurological manifestations that are presumed to arise from an inflammatory mechanism and, as a result, exhibiting high scores in NPSLE attribution algorithms [28]. Furthermore, in our analysis, we observed an inverse correlation between the initiation of immunosuppressive therapy and the extent of organ damage. This observation highlights the intricate interplay within the clinical milieu. In fact, the situations in which patients experience more pronounced organ impairment, possibly coupled with increased comorbidity, require a meticulous evaluation to balance risk and benefit of the treatment strategy. This is particularly true given the association between higher SDI values and NPSLE flares borrowed from the literature [30].
In terms of outcomes, we observed that a considerable portion of the patients showed improvement (64% of the cases) of the NP manifestation at the 12-month follow-up. This observation is in agreement with published data [31, 32]. Regardless of the clinical phenotype, attributing the NP event to SLE using both expert assessment and attribution algorithms was found to be associated with improved outcomes. Our findings are in line with the pivotal study conducted by the SLICC group, which revealed that patients with NP events attributed to SLE exhibited markedly superior outcomes in comparison to those with NP events not attributed to lupus [32]. Also in the prospective data from the Leiden NPSLE cohort, the proportion of NP manifestations considered related to SLE, according to a multidisciplinary assessment, showed better clinical outcome and meaningful improvement (38.3% improved and 29.2% resolved) than non-NP SLE (26.8% improved and 8% resolved) [1, 19]. Furthermore, we observed that the clinical phenotype played a crucial role in determining the treatment outcomes. In particular, patients with focal manifestations showed notably better treatment outcomes compared with those with other types of manifestations. This suggests that the specific pattern and localization of different NP events influenced the response to treatment positively, leading to more favourable results for this subgroup of patients. Our results further support previous research indicating that focal events tend to yield more favourable clinical outcomes and greater resolution when compared with diffuse NP events (Fig. 3) [33, 34]. Finally, in our study, we aimed to elucidate the impact of the interplay between attribution and immunosuppressive intervention. The multivariate analysis demonstrated that, irrespective of disease activity and damage, the use of immunosuppressants in patients diagnosed with NP manifestations clinically attributed to SLE, associated with a more favorable outcome. This finding can be reasonably justified by the fact that, when the expert clinician discerns an underlying inflammatory pathogenic mechanism, the utilization of immunosuppressants positively affects the disease course. The use of the algorithm instead of clinical judgment did not reproduce the association at the same significance level. This might be due to the different performance of the two approaches, particularly in attributing central diffuse events (lower using the algorithm compared with clinical judgment). Notably, the attribution algorithm was applied to the sample a posteriori and, consequently, the events attributed to SLE only by the algorithm (and not by clinical judgment) were not influenced by the potential confounding by expectation of improvement with treatment, when events were classified by clinical judgement.
There are some limitations to the present study. Our study exclusively focused on patients diagnosed with SLE and experiencing their initial NP. Consequently, this subset may not fully represent the broader spectrum of SLE patients, particularly considering the severity and distinct prognostic implications associated with the NP manifestation compared with other manifestations of the disease. In addition, our cohort predominantly consisted of Caucasian patients, which restricts the generalizability of the findings to other ethnicities. For instance, this limitation prevented us from confirming the observed more favorable course of NPSLE (with attributed manifestations) to individuals of Asian ethnicity [35]. The retrospective design may have impacted the accurate attribution and assessment of outcomes for certain NP events, potentially introducing bias due to incomplete data collection, particularly regarding disease activity, damage and cumulative glucocorticoid dosage. Additionally, the absence of a validated outcome tool for NPSLE led us to utilize a physician global assessment tool (the Likert scale) for evaluating clinical outcomes. The retrospective nature of the study precluded the inclusion of patient’s reported outcomes, such as the health-related quality of life, as well as the complete analysis of patients’ reported symptoms or function. This analysis might have influenced the overall assessment of outcomes, particularly for specific events burdened by relevant neurological sequelae (e.g. cerebrovascular manifestations). A further limitation lies in the scarcity of rare NP events, limiting the generalizability of our findings to encompass the entire spectrum of NP events within the ACR glossary. Finally, by exclusively assessing the 12-month follow-up outcome, we lack longer-term data regarding the impact of NP manifestations on morbidity and mortality.
Notwithstanding its inherent limitations, our study makes a pivotal contribution to refining the treatment strategies for NP events in SLE. Our meticulous approach involved the characterization and precise attribution of these manifestations through the synergy of the expert clinical judgment and a validated attribution algorithm. Exploring the treatment and outcomes of NP dimension in SLE, we provided deeper insights into the predictive factors and short-term evolution over the course of follow-up.
Supplementary material
Supplementary material is available at Rheumatology online.
Data availability
The authors have full control of all primary data and agree to allow the journal to review data if requested.
Contribution statement
All the authors have made substantial contributions to the conception or design of the work, or acquisition, analysis, interpretation of data; have drafted the work or revised it critically for important intellectual content; finally approved the version to be published; and agree to be accountable for all aspects of the work in ensuring that questions related to the accuracy or integrity of any part of the work are appropriately investigated and resolved.
Funding
No specific funding was received from any bodies in the public, commercial or not-for-profit sectors to carry out the work described in this article.
Disclosure statement: The authors declare no conflicts of interest with the present work.
Acknowledgements
This study was conducted on behalf of the Study Group of the Italian Society of Rheumatology for Neuropsychiatric Lupus.
References
R: The R project for statistical computing. https://www.r-project.org/.

Comments