


Abstract
Idiopathic inflammatory myopathies (IIMs) are autoimmune disorders significantly impacting skeletal muscles; however, the precise correlation between muscle magnetic resonance imaging (MRI) findings, muscle pathology, disease subtypes and clinical characteristics remains uncertain. Thus, we investigated the association of muscle MRI findings in IIMs with muscle pathology and clinical features.
New-onset IIM patients underwent proximal upper and/or lower limb muscle MRI. Patterns of muscle oedema on MRI were categorised into fascial, honeycomb, peripheral, foggy, dense, or coarse dot patterns and compared with inflammatory cell infiltration sites in corresponding muscle biopsies. The incidence of MRI patterns was examined in patient subgroups using myositis-specific antibodies (MSAs) and 2017 EULAR/ACR classification criteria. Univariate and multivariate analyses were conducted to determine the odds ratios (ORs) of MRI findings for clinical characteristics.
Fifty-six of 85 patients underwent muscle biopsy. Foggy, honeycomb and fascial patterns at biopsy sites correlated with inflammatory cell infiltration in the endomysium (OR 11.9, P = 0.005), perimysium (OR 6.0, P = 0.014) and fascia (OR 16.9, P < 0.001), respectively. Honeycomb and foggy patterns were characteristic of patients with anti-TIF1γ or anti-Mi2 antibodies and MSA-negative dermatomyositis, and those with anti-SRP or anti-HMGCR antibodies and MSA-negative polymyositis (PM), respectively. The honeycomb pattern positively correlated with malignancy (OR 6.87, P < 0.001) and Gottron sign (OR 8.05, P = 0.002); the foggy pattern correlated with muscle weakness (OR 11.24, P = 0.005). The dense dot pattern was associated with dysphagia (OR 6.27, P = 0.006) and malignancy (OR 8.49, P = 0.002).
Muscle MRI holds promise in predicting muscle pathology, disease subtypes and clinical manifestations of IIMs.
Muscle MRI can help predict histological sites infiltrated by inflammatory cells in IIMs.
Muscle MRI shows distinct radiographic findings according to MSAs.
Muscle MRI is potentially helpful in assessing the risk of clinical manifestations.
Introduction
Idiopathic inflammatory myopathies (IIMs) represent autoimmune disorders characterised by persistent inflammation primarily affecting skeletal muscles. With an enhanced understanding of myositis-specific autoantibodies (MSAs), muscle pathology and clinical symptoms, IIMs have been classified into subsets [1, 2], including dermatomyositis (DM), anti-synthetase syndrome (ASS) [3–5], immune-mediated necrotising myopathy (IMNM) [6, 7], and inclusion body myositis (IBM) [8, 9], whereas polymyositis (PM) [6] is considered to encompass heterogeneous myositis and is currently a subject of controversy [10]. Each subset exhibits distinct muscular pathological features, including sites (e.g. endomysium, perimysium and perivascular sites) of inflammatory cell infiltration, immune cell types and the presence of muscle fibre necrosis or atrophy [6]. Accurately classifying these pathological characteristics is crucial for precise diagnosis and effective treatment strategies.
Muscle biopsy, the gold standard for evaluating myopathies, is invasive and time-consuming. To address this limitation, magnetic resonance imaging (MRI), which has emerged as a valuable noninvasive tool for evaluating muscle lesions in IIMs [11], can effectively differentiate between muscle lesions associated with DM and PM by analysing the distribution and patterns of muscle oedema [12]. Nonetheless, despite the potential of muscle MRI to reflect pathological findings [13], studies exploring the association between MRI results and detailed pathological features, such as the inflammatory cell infiltration site in IIMs, are lacking; this complicates the interpretation of MRI findings and hinders its clinical applicability in evaluating IIMs. Furthermore, previous research on the characteristics of muscle MRI findings in IIMs has predominantly focused on specific IIM subsets determined through clinical diagnoses [12, 14] (e.g. DM, PM, IMNM) or on limited types of MSAs [15, 16].
Therefore, we conducted a cross-sectional study on a cohort of consecutive patients with new-onset IIMs to evaluate the relationship between skeletal muscle MRI findings and the distribution of inflammatory cell infiltration within the muscle tissue. Additionally, we assessed the clinical applicability of muscle MRI by examining the associations between each MRI finding and disease subtypes, classified using a relatively broad spectrum of MSAs with univariate and multivariate analyses. A combination of MRI findings was also assessed for the association with IIM subgroups with principal component analysis (PCA). Finally, we investigated whether MRI findings were linked to clinical manifestations.
Methods
Study design and participants
In this observational study, we reviewed the medical records from a cohort of adult patients diagnosed with new-onset IIMs. The patients were admitted to the Division of Rheumatology at The Jikei University Hospital in Tokyo, Japan, and The Jikei University Kashiwa Hospital in Chiba, Japan. Prospective recruitment was conducted between April 2010 and February 2011, and between October 2013 and December 2021. Inclusion criteria were (i) new-onset IIMs and (ii) taking ≤10 mg/day prednisolone equivalent on admission. The timing of skeletal muscle MRI and muscle biopsy was pre-specified to be performed at the time of initial admission on the diagnosis and before treatment in this cohort.
We defined the following exclusion criteria: (i) presence of concomitant neuromuscular diseases, (ii) insufficient or poor-quality skeletal muscle MRI data, (iii) diagnosis of IBM, (iv) failure to meet the 2017 EULAR/ACR classification criteria [17] (possible IIM or non-IIM), and (v) taking >10 mg/day prednisolone equivalent or immunosuppressants during skeletal muscle MRI and muscle biopsies. IBM was diagnosed by clinical symptoms and the presence of rimmed vacuoles on Gomori staining of muscle tissue.
Ethical approval was obtained from The Jikei University School of Medicine Ethics Committee (Approval Number 21–155 [6033], 28–049 [8292]), and written informed consent was obtained from all participants. Some patients in this study were also part of a previous study [12]. The analysis involved exploring associations between muscle MRI findings at biopsy sites and pathological findings and the relationships between MRI findings and clinical data, including detailed MSAs and clinical manifestations.
Imaging acquisition
MRI scans were performed on both the proximal upper and lower extremities, except in patients who lacked time to undergo both examinations before treatment. Some patients also underwent additional MRI scans for the lower legs based on the location of muscle symptoms. MRI scans were performed using either 1.5-T (MAGNETOM Symphony or Avanto; Siemens Healthineers, Erlangen, Germany) or 3-T MRI (MAGNETOM Skyra or Vida; Siemens Healthineers, Erlangen, Germany) scanners. In this study, only axial short TI inversion recovery (STIR) images were evaluated for muscle oedema (slice thickness: 5 mm; slice gap: 5 mm; flip angle: 160°; inversion time: 1.5-T: upper limb and lower limb, 180 ms; 3-T: upper limb, 220 ms; lower limb, 230 ms). This study did not assess structural changes (e.g. fat deposition and atrophy).
Evaluation of skeletal muscle MRI
Axial STIR images were assessed for areas of high signal intensity (HSI), indicating oedema in the muscle parenchyma, fasciae and subcutaneous adipose tissues. Subcutaneous and fascial patterns were defined based on HSI areas in the respective tissues, whereas honeycomb, foggy, peripheral, coarse or dense dot patterns were identified in the muscle parenchyma. Coarse and dense dot patterns were newly defined in this study, whereas other MRI patterns were classified as described previously [12]. Fig. 1 illustrates typical images of these patterns.
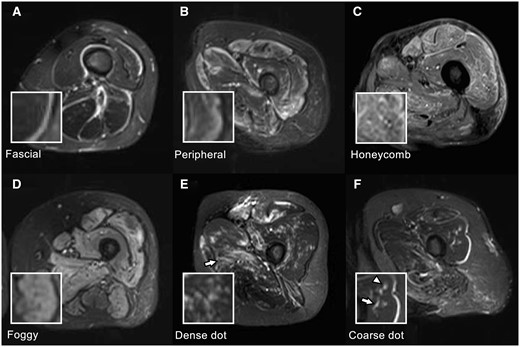
MRI findings in IIMs. All images are axial STIR images of the left thigh, and the small boxes in the lower left are magnified images of the corresponding MRI findings. (A) Fascial pattern: Linear HSI localises to the fasciae. Fascial patterns can be distinguished from chemical shift artefacts, generally localised to only one side of the fasciae. (B) Peripheral pattern: HSI areas are observed in the marginal zone of the muscles, and the signal intensity continuously decreases inward. (C) Honeycomb pattern: HSI areas are mainly observed in the rectus femoris and vastus lateralis with reticular HSI. (D) Foggy pattern: Relatively homogeneous HSI areas are observed in the muscle parenchyma. In this case, HSI areas occupy >50% of muscle parenchyma, and the distribution is diffuse. (E) Dense dot pattern: punctate HSI is densely clustered in the muscle parenchyma. A patchy honeycomb pattern is also observed in the adductor magnus (arrow). (F) Coarse dot pattern: Punctate HSI is sparsely scattered in the muscle parenchyma (arrowhead). The adjacent linear HSI (arrow) represents a small vessel and can be traced in continuous axial sections (image not shown). IIMs: idiopathic inflammatory myopathies; STIR: short TI inversion recovery
‘Honeycomb pattern’ was defined as heterogeneous reticular HSI in the parenchyma, whereas the ‘foggy pattern’ was relatively homogeneous HSI without a predominant distribution at the marginal part of the muscle. Honeycomb and foggy patterns were classified based on their distribution in skeletal muscle sections, with >50% or <50% occupancy resulting in a diffuse or patchy distribution, respectively. The MRI finding was classified as ‘peripheral pattern’ when HSI was stronger at the muscle’s marginal part than at the central part. ‘Coarse dot pattern’ and ‘dense dot pattern’ were characterised by punctate areas with a 2–3 mm diameter in the muscle parenchyma. The ‘coarse’ and ‘dense’ dot patterns were characterised by <10 sparsely scattered and ≥10 densely scattered dots across one slice of the extremity, respectively. We excluded the HSI areas that could be traced in consecutive axial images to distinguish coarse or dense dot patterns from HSI areas representing blood vessels. ‘Fascial pattern’ was defined as linear HSI along the fasciae, and chemical shift artefacts were carefully excluded.
MRI images were evaluated in two steps: recording findings at biopsy sites in patients who underwent muscle biopsy and analysing the association with the muscle pathological findings at corresponding sites. Next, MRI findings from axial images of the extremities were evaluated in all patients, including those who did not undergo a muscle biopsy. The presence or absence of each MRI pattern in the limb was recorded in all patients.
Two authors (K.Y. and T.S.) independently evaluated MRI findings, with the investigators blinded to clinical information except for the biopsy site. Consensus was reached in cases of conflicting results.
Muscle biopsies and histological analyses
Muscle biopsies were performed at the Jikei University Hospital and Kashiwa Hospitals in patients with muscle symptoms or muscle oedema on MRI, except for those with time constraints due to urgent treatment or lack of consent. Based on observed muscle oedema on MRI, planned muscle biopsy sites were selected and marked by measuring distances from anatomical landmarks using coronal and axial MR images. Biopsy specimens were obtained continuously from the skin to the muscle parenchyma using the en-bloc biopsy technique. The presence of inflammatory cell infiltration was examined for each of the fascia, perimysium and endomysium in the muscle tissues by HE staining and immunohistochemical staining with anti-CD3, anti-CD20 and anti-CD68 antibodies. HE staining was initially evaluated with positivity criteria of inflammatory cell infiltration with ≥10 cells in the perivascular area of the fascia or perimysium and clusters or abnormal distribution of inflammatory cells in the endomysium. When inflammation was difficult to discern, immunohistochemical staining for CD3, CD20 or CD68 positive cells was evaluated with positivity criteria of ≥10 cells in the perivascular area of the fascia or perimysium and a minimum of four cells in the endomysium per ×200 field. Two investigators (K.Y. and T.S.), blinded to clinical information including MRI findings and MSAs evaluated all histopathological findings on different occasions from the MRI evaluation, and consensus was reached when the reading results differed by two investigators. Examples of inflammatory infiltrates in each histological site are presented in Supplementary Fig. S1, available at Rheumatology online.
Data analyses
In patients with muscle biopsy, we evaluated the association between MRI patterns observed at the biopsy sites and the localisation of inflammatory cell infiltration in the biopsied tissues. Next, we analysed all patients, including those who did not undergo muscle biopsy, to investigate MRI pattern characteristics in subgroups classified according to MSAs and the 2017 EULAR/ACR classification criteria. Subgrouping by MSAs was based on previously reported similarities in muscle pathology for each MSA [1, 18–20]. Patients with anti-TIF1γ, anti-Mi2, or anti-NXP2 antibodies were classified as Group 1; those with anti-MDA5 antibodies were classified as Group 2; patients with anti-ARS antibodies were classified as Group 3; patients with anti-SRP or anti-HMGCR antibodies were classified as Group 4. Patients without identified MSAs were classified according to subgrouping by the 2017 EULAR/ACR criteria. Those with a typical skin rash were classified as Group 5 [DM or amyopathic DM (ADM) subgroup], whereas those without a typical skin rash were classified as Group 6 (PM subgroup). In this study, we utilised the term ‘PM’ based on IIM subgroups defined by the 2017 EULAR/ACR classification criteria.
MSAs were measured using commercially available enzyme-linked immunosorbent assay (ELISA) kits for anti-TIF1γ, anti-Mi2, anti-MDA5 and anti-ARS (Jo1, PL7, PL12, EJ, KS) antibodies (MESACUP anti-TIF1γ test, anti-Mi2 test, anti-MDA5 test, anti-ARS test; Medical & Biological Laboratories, Tokyo, Japan). Additionally, the CLEIA method was utilised for detecting anti-Jo1 antibody (STACIA MEBLux test Jo1; Medical & Biological Laboratories, Tokyo, Japan), and a line blot assay was employed for anti-ARS (Jo1, PL7, PL12, EJ, KS) and anti-SRP antibodies (Euroline Myositis Profile 3; EUROIMMUN, Luebeck, Germany or BlueDiver Dot, D-tek, Mons, Belgium). Positivity for anti-HMGCR [21], anti-OJ [22] and anti-NXP2 [23] antibodies was confirmed using an in-house ELISA.
The incidence of each MRI pattern was calculated for the IIM subgroups. Principal component analysis (PCA) was performed on binary data of MRI patterns (presence or absence of MRI patterns was described as ‘1’ or ‘0’, respectively) using the R function ‘prcomp()’.
Evaluation of muscle weakness with manual muscle testing-8, interstitial lung disease (ILD) with chest computed tomography (CT) and skin rush was pre-specified to be assessed on the first admission. The presence of dysphagia at diagnosis, first or recurrent malignant diseases within 3 years of IIM diagnosis, and the duration from onset to MRI examination were retrospectively reviewed from medical records.
Statistical analyses
Quantitative data were presented as medians (first and third quartiles), and qualitative data were assessed using frequencies or binary data. The Kruskal–Wallis and Fisher’s exact tests were used to analyse quantitative and qualitative data, respectively. Multiple comparisons between frequency of MRI patterns in IIM subgroups were corrected using the Bonferroni method where the P-values were multiplied by the number of hypotheses. Statistical significance was set at a P-value of <0.05. Statistical analyses and graphing were performed using R version 3.4.0. A binary logistic regression analysis with Firth's method was performed to correct potential confounding by MRI patterns. Odds ratios (ORs) and 95% confidence intervals (CI) were calculated by the R function ‘Fisher.test()’, based on conditional maximum likelihood estimation. Cohen’s kappa statistics and 95% CIs were calculated to indicate inter-observer agreement in the evaluation of muscle MRI patterns.
Results
Patients
Among the 101 patients who met the inclusion criteria, 85 were included in the analyses, and 56 underwent muscle biopsy. The proportion of biopsy sites was presented in Supplementary Fig. S2, available at Rheumatology online. We excluded 16 for the following reasons: three patients had insufficient MRI data, two were diagnosed with IBM, nine did not fulfil the 2017 EULAR/ACR classification criteria, one received immunosuppressants, and one had a comorbid neuromuscular disease. Patient characteristics are presented in Table 1. Fifty-eight patients tested positive for MSAs, including 14 with anti-TIF1γ, three with anti-Mi2, one with anti-NXP2, 12 with anti-MDA5, 18 with anti-ARS (seven with anti-Jo1, six with anti-PL7, two with anti-OJ, two with anti-EJ, and one with anti-PL12 antibodies), eight with anti-SRP, and two with anti-HMGCR antibodies. MSAs were not detected in 27 patients, of whom 11 were classified as having DM or ADM and 16 as having PM.
Clinical characteristics of the patients
| Group 1 | Group 2 | Group 3 | Group 4 | Group 5 | Group 6 | ||||||||
|---|---|---|---|---|---|---|---|---|---|---|---|---|---|
| n = 18 | n = 12 | n = 18 | n = 10 | n = 11 | n = 16 | P value | |||||||
| Myositis specific Antibody, n (%) | anti-TIF1γ | 14 (77.8) | anti-MDA5 | 12 (100) | anti-ARS | 18 (100) | anti-SRP | 8 (80.0) | NA | NA | |||
| anti-Mi2 | 3 (16.7) | anti-HMGCR | 2 (20.0) | ||||||||||
| anti-NXP2 | 1 (5.5) | ||||||||||||
| Muscle biopsy, n (%) | 10 | (55.5) | 4 | (33.3) | 10 | (55.6) | 9 | (90.0) | 8 | (72.7) | 15 | (93.8) | 0.006 |
| MRI | |||||||||||||
| Upper arm, n (%) | 17 | (94.4) | 12 | (100) | 18 | (100) | 9 | (90) | 10 | (90.9) | 16 | (100) | |
| Thigh, n (%) | 16 | (88.9) | 10 | (83.3) | 17 | (94.4) | 10 | (100) | 8 | (72.7) | 15 | (93.8) | |
| Lower leg, n (%) | 0 | (0) | 0 | (0) | 0 | (0) | 2 | (20.0) | 1 | (9.1) | 1 | (6.2) | |
| EULAR/ACR classification | |||||||||||||
| DM, n (%) | 17 | (94.4) | 4 | (33.3) | 11 | (61.1) | 1 | (10.0) | 7 | (63.6) | 0 | (0) | |
| ADM, n (%) | 1 | (5.55) | 8 | (66.7) | 4 | (22.2) | 1 | (10.0) | 4 | (36.4) | 0 | (0) | |
| PM, n (%) | 0 | (0) | 0 | (0) | 3 | (16.7) | 8 | (80.0) | 0 | (0) | 16 | (100) | |
| Age at diagnosis, years (IQR) | 62.5 | (54.3–68.5) | 53 | (44.3-62.3) | 53 | (44.7–63.3) | 62 | (44.5–67.0) | 64 | (55.0–70.0) | 69 | (58.3–73.5) | 0.046 |
| Sex (male/female) | 5/13 | 2/10 | 2/16 | 2/8 | 3/8 | 3/13 | 0.84 | ||||||
| CK, U/L (IQR) | 885 | (308.8–2770) | 185 | (50.50-308.5) | 654 | (215.0–1606) | 5736 | (1638–6303) | 712 | (164.0–1746) | 1096 | (623.8–1945) | <0.001 |
| Time from onset, months (IQR) | 3.1 | (1.89–5.89) | 2.2 | (1.70–3.31) | 4.8 | (2.58–8.02) | 6.6 | (4.77–10.9) | 5.1 | (3.07–6.75) | 6.8 | (5.48–17.3) | 0.002 |
| Gottron sign, n (%) | 18 | (100) | 12 | (100) | 15 | (83.3) | 2 | (20.0) | 11 | (100) | 0 | (0.0) | |
| Dysphagia, n (%) | 8 | (44.4) | 0 | (0) | 1 | (5.6) | 6 | (60.0) | 2 | (18.2) | 3 | (18.8) | 0.001 |
| Interstitial lung disease, n (%) | 1 | (5.56) | 12 | (100) | 18 | (100) | 6 | (60) | 9 | (81.8) | 2 | (12.5) | <0.001 |
| Malignancy, n (%) | 8 | (44.4) | 0 | (0.0) | 3 | (16.7) | 1 | (10) | 4 | (36.4) | 1 | (6.2) | 0.014 |
| Muscle weakness, n (%) | 17 | (94.4) | 4 | (33.3) | 14 | (77.8) | 9 | (90.0) | 7 | 63.6) | 16 | (100) | <0.001 |
The P values were derived from Fisher’s exact test or Kruskal–Wallis test across groups.
ADM: amyopathic dermatomyositis; DM: dermatomyositis; IQR: interquartile range; PM: polymyositis.
Forty-eight patients had ILD and 20 had dysphagia at diagnosis. Seventeen patients were diagnosed with the malignant disease or relapsed within three years before or after IIM diagnosis. ILD was less common in Groups 1 and 6, whereas dysphagia was more common in Groups 1 and 4.
Relationships between MRI findings and histopathological findings
Fig. 2 illustrates the percentages of patients with inflammatory cell infiltration in each histological region categorised by the presence or absence of MRI patterns in the biopsied muscles. Inflammatory cell infiltration in the endomysium was observed in 69.6% (n = 39) of the patients. Among those with a foggy pattern on MRI, 94.4% (17 patients) showed inflammatory cell infiltration in the endomysium, whereas 57.9% (22 patients) without a foggy pattern exhibited inflammatory cell infiltration. There was a significant association between the foggy pattern on MRI and inflammatory cell infiltration in the endomysium [odds ratio (OR) 11.9, P = 0.005]. Among the 22 patients with inflammatory cell infiltration in the endomysium but without a foggy pattern, 59.1% (13 patients) showed inflammatory cell infiltration in the perimysium, and 72.7% (16 patients) showed inflammatory cell infiltration in the fascia. Moreover, in MRI findings on biopsied muscles, 45.5% (10 patients) and 13.6% (three patients) showed honeycomb and peripheral patterns, respectively.
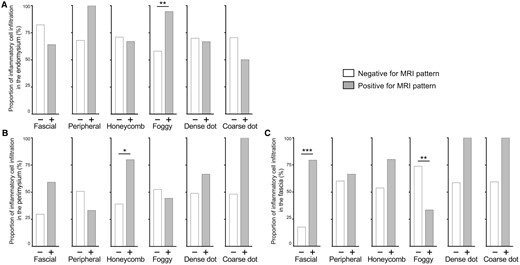
Relationships between MRI findings and inflammatory cell infiltration in (A) the endomysium, (B) the perimysium, and (C) the fasciae. The grey bar or white bar represents the percentage of patients presenting inflammatory cell infiltration with or without corresponding MRI patterns indicated below, respectively. The P-values are derived from Fisher’s exact test. *P < 0.05, **P < 0.01, ***P < 0.001
Inflammatory cell infiltration in the perimysium was observed in 50.0% (n = 28) of all patients. Among those with honeycomb patterns on MRI, 80% (12 patients) showed inflammatory cell infiltration in the perimysium, whereas 39.0% (16 patients) without honeycomb patterns exhibited inflammatory cell infiltration. The honeycomb pattern on MRI significantly correlated with inflammatory cell infiltration in the perimysium (OR 6.0, P = 0.014). Patients with dense or coarse dot patterns showed a more frequent inflammatory cell infiltration in the perimysium than those without these patterns; however, the differences were not statistically significant.
Inflammatory cell infiltration in the fascia was found in 60.7% (n = 34) of all patients; seven showed inflammatory cell infiltration neither in perimysium nor endomysium. Among patients with fascial patterns, 79.5% (31 patients) showed inflammatory cell infiltration in the fascia, whereas only 17.6% (3 patients) of patients without fascial patterns showed inflammatory cell infiltration. There was a significant correlation between the fascial pattern on MRI and inflammatory cell infiltration in the fascia (OR 16.9, P < 0.001). The sensitivity and specificity of the fascial pattern for inflammatory cell infiltration in the fascia were 91.2% and 63.6%, respectively. Furthermore, foggy patterns and inflammatory cell infiltration in the fascia were inversely associated. This association disappeared in multivariate analyses (Supplementary Fig. S3, available at Rheumatology online), suggesting potential confounding between MRI patterns. The remaining results of multivariate analyses were consistent with univariate analyses.
Relationships between MRI findings and subgroups in IIMs
Fig. 3 illustrates the percentages of MRI patterns in all 85 patients divided into six subgroups. Inter-observer agreement for the MRI evaluation was substantial (Supplementary Table S1, available at Rheumatology online). The fascial pattern was found in all groups, with the highest frequency in Group 1 (94.4%) and the lowest in Group 6 (43.8%). A peripheral pattern was observed at a relatively high frequency in Groups 1 and 5 but revealed no significant difference. The honeycomb pattern showed a significantly higher frequency in Group 1 than in the other groups except Group 5 and was not observed in Group 4. A foggy pattern was observed at a significantly higher frequency in Groups 4 and 6 than in the other groups. A dense dot pattern was found in Group 1. A coarse dot pattern was more frequently observed in Group 2 than in the other groups; however, the difference was not statistically significant. The patchy distribution did not show significant differences among the groups; however, the diffuse pattern showed a slightly higher frequency in Group 1 than in Groups 2 and 3. Furthermore, the subcutaneous pattern showed a significantly lower frequency in Groups 4 and 6, where most patients were classified as PM in 2017 EULAR/ACR criteria.
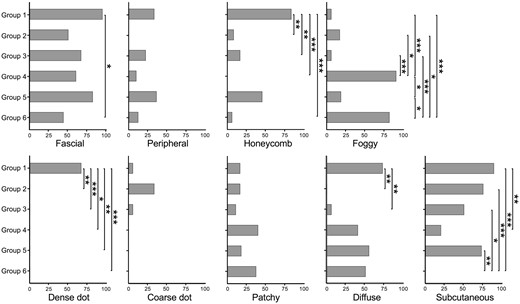
Percentages of MRI findings in IIM patients. Black bars represent the percentages of patients with the corresponding MRI patterns indicated in each IIM subgroup. Honeycomb, fascial, peripheral, foggy, dense dot, coarse dot, patchy, diffuse and subcutaneous patterns are analysed. The P-values are derived using Fisher’s exact test with Bonferroni correction across groups. *P < 0.05, **P < 0.01, ***P < 0.001
Notably, the sensitivity and specificity of the dense dot pattern for patients with anti-TIF1γ antibodies were 78.6% and 98.6%, respectively. The foggy pattern also demonstrated a sensitivity of 84.6% and a specificity of 89.8% to identify patients in Groups 4 and 6. It is important to note that there was a correlation between the presence of MRI patterns. Therefore, we calculated Yule's coefficient of association for MRI patterns in Supplementary Fig. S4, available at Rheumatology online as a correlation measure. We performed multivariate analyses in Supplementary Fig. S5, available at Rheumatology online to address the potential confounding. Multivariate analyses also showed a significant association of Group 1 with honeycomb and dense dot patterns, Group 2 with coarse dot patterns and Group 4 and 6 with foggy patterns.
PCA on skeletal muscle MRI
PCA was employed on muscle MRI patterns of 58 MSA-positive patients (Fig. 4A) and all patients (Fig. 4B) to assess whether the combinations of MRI findings improve the differentiation of muscle lesions in various IIM subgroups. The results revealed that MRI findings in Groups 1 and 4 were well distinguished, whereas those in Groups 2 and 3 were located in almost the same region (Fig. 4A). Fig. 4B reveals distinctive distributions for DM and PM patients, with partial overlap of ADM patients with DM patients. Therefore, the combination of MRI findings effectively captured variations in muscle lesions across IIM subgroups. Supplementary Table S2, available at Rheumatology online contains the linear coefficients for PC1 and PC2.
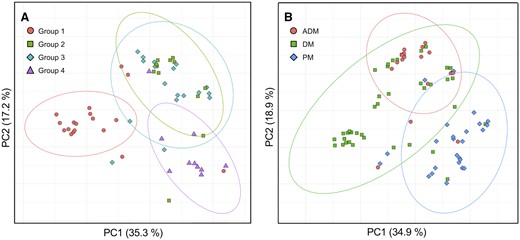
Principal component analysis of MRI findings. PC plots of (A) 58 patients in Groups 1–4 and (B) all 85 patients classified according to the 2017 EULAR/ACR classification criteria are presented. Each point represents each patient and is colour-coded for the subgroups. 95% probability ellipses are shown according to the subgroups. The percentage of variance explained by each component is indicated on the axis labels
Association between MRI findings and clinical manifestations
Table 2 shows ORs of MRI patterns for clinical manifestations. Muscle weakness was associated with a foggy pattern [OR 11.2, 95% confidence interval (CI), 1.58–495.82; P = 0.005]. Dysphagia was associated with a dense dot pattern (OR 6.27, 95% CI 1.46–29.47, P = 0.006). The ORs for malignancy were significantly higher in patients with dense dot (OR 8.49, 95% CI, 1.91–41.47; P = 0.002) and honeycomb patterns (OR 6.87, 95% CI, 1.94–26.98; P < 0.001). The ORs for ILD were lower in patients with dense dot (OR 0.05, 95% CI, <0.01–0.39; P < 0.001), honeycomb (OR 0.31, 95% CI, 0.10–0.89; P = 0.017) and foggy patterns (OR 0.35, 95% CI, 0.12–0.98; P = 0.036). High ORs for Gottron’s sign were observed in patients with honeycomb (OR 8.05, 95% CI, 1.72–76.60; P = 0.002), fascial (OR 3.33, 95% CI, 1.15–9.90; P = 0.015) and dense dot patterns (OR infinity, 95% CI, 1.47–inf.; P = 0.008), in contrast to a low OR observed in patients with foggy patterns (OR 0.03, 95% CI, 0.01–0.11; P < 0.001). Results of multivariate analyses (Supplementary Fig. S6, available at Rheumatology online) suggested a potential association of dysphagia with the foggy pattern and some of the association observed in univariate analyses (e.g. the association between malignancy and MRI patterns) disappeared.
Odds ratios of MRI patterns in skeletal muscles for clinical manifestations
| MRI pattern | Gottron sign | Dysphagia | Interstitial lung disease | Malignancy | Muscle weakness | ||||||||||
|---|---|---|---|---|---|---|---|---|---|---|---|---|---|---|---|
| OR | (95 % CI) | P value | OR | (95 % CI) | P value | OR | (95 % CI) | P value | OR | (95 % CI) | P value | OR | (95 % CI) | P value | |
| Honeycomb | 8.05** | (1.72–76.60) | 0.002 | 2.48 | (0.76–8.02) | 0.097 | 0.31* | (0.10–0.89) | 0.017 | 6.87*** | (1.94–26.98) | <0.001 | 4.12 | (0.85–40.09) | 0.08 |
| Fascial | 3.33* | (1.15–9.90) | 0.015 | 0.89 | (0.28–3.03) | 1 | 0.77 | (0.27–2.12) | 0.646 | 4.57* | (0.94–44.47) | 0.045 | 1.02 | (0.28–3.44) | 1 |
| Peripheral | 2.52 | (0.61–15.02) | 0.245 | 0.65 | (0.11–2.74) | 0.751 | 0.84 | (0.25–2.83) | 0.789 | 1.93 | (0.45–7.40) | 0.315 | 5.26 | (0.71–236.36) | 0.106 |
| Foggy | 0.03*** | (0.01–0.11) | <0.001 | 1.96 | (0.61–6.23) | 0.276 | 0.35* | (0.12–0.98) | 0.036 | 0.37 | (0.06–1.52) | 0.16 | 11.24** | (1.58–495.82) | 0.005 |
| Dense dot | Inf.** | (1.47–Inf.) | 0.008 | 6.27** | (1.46–29.47) | 0.006 | 0.05*** | (<0.01–0.39) | <0.001 | 8.49** | (1.91–41.47) | 0.002 | 3.3 | (0.42–151.97) | 0.446 |
| Coarse dot | Inf. | (0.56–Inf.) | 0.17 | 0.63 | (0.01–6.2) | 1 | 4.13 | (0.43–203.18) | 0.226 | 0 | (<0.01–3.43) | 0.342 | 0.51 | (0.07–6.14) | 0.603 |
ORs and 95% CI were calculated based on conditional maximum likelihood estimation.
The P-values were derived from Fisher’s exact test.
P < 0.05,
P < 0.01,
P < 0.001.
CI: confidence interval; inf.: infinity; OR: odds ratio.
Discussion
We investigated the correlation between skeletal muscle MRI findings and the location of inflammatory cell infiltration within biopsied muscle tissues to gain valuable insights into the underlying pathological basis of observed MRI abnormalities in IIMs. The MRI-based fascial pattern demonstrated exceptional sensitivity in detecting inflammatory cell infiltration within the fasciae. This finding holds particular significance as muscle biopsies do not routinely assess the fascial regions, potentially missing early inflammation in IIMs [24–27].
Conversely, the honeycomb pattern correlated with inflammatory cell infiltration in the perimysium, with the reticular HSI in the STIR images possibly reflecting interstitial oedema resulting from perimysial inflammation. A strong association was observed between the foggy pattern and inflammatory cell infiltration in the endomysium. The percentage of foggy patterns was high in patients with anti-SRP/HMGCR antibodies (Group 4) and those with PM without MSAs (Group 6), which may include MSA-negative IMNM [7, 28]. This aligns with the pathological findings of IMNM, characterised by necrotic and regenerating muscle fibres with inflammatory cells, mainly macrophages that infiltrate the endomysium and phagocytose necrotic fibres. In contrast, inflammation in the perimysium is relatively weak [7]. Patients with inflammatory cell infiltration in the endomysium but without a foggy pattern exhibited a honeycomb or peripheral pattern in the biopsied muscle, with concomitant inflammatory cell infiltration in the perimysium or fascia, respectively. Thus, a dominant endomysial inflammatory cell infiltration may result in a foggy pattern on MRI. Notably, extensive muscle oedema is frequently observed in IMNM on muscle MRI [15, 29], and this study demonstrated a causal association between these MRI findings and endomysial pathology.
Furthermore, the IIM subgroups classified based on MSAs displayed distinct characteristics on skeletal muscle MRI. Patients with anti-Mi2 or anti-TIF1γ antibodies showed honeycomb and dense dot patterns, whereas only the fascial pattern was observed at a high frequency in patients with anti-ARS antibodies, highlighting the importance of evaluating fascial lesions as target organs of IIMs. This finding is consistent with previous reports of a moderate proportion of patients with ASS accompanied by fascial HSI [14, 16]. Distinct MRI patterns were also observed for patients in Group 5 and 6, partially resembling those in Groups 1 and 4, respectively. However, Groups 5 and 6, comprising patients in whom MSAs were not detected, were considered a rather heterogeneous group that might include patients with MSAs not routinely measured, such as anti-NXP2 or anti-SAE antibodies in Group 5 and patients with MSA-negative IMNM, pathologically defined PM [6], overlapping myositis, and undiagnosed IBMs in Group 6.
Significant correlations were also observed between MRI findings and clinical manifestations, including dysphagia, malignancy, and muscle weakness. Thus, skeletal muscle MRI in patients with IIMs may enable physicians to predict clinical manifestations and manage the risk of complications through early intervention. Future studies are required to address whether this prediction by MRI findings is superior to that by MSAs alone or whether a combination of MSA and MRI findings would provide a better prediction of clinical characteristics. Notably, ILD was frequently observed in this study population including Group 3 and 4, and this may be related to reported high incidence of ILD in Japanese ASS patients [30] and high proportion of anti-SRP antibody-positive patients [31, 32] in Group 4 in addition to high sensitivity for detecting ILD due to screening with chest CT in all patients.
The study has some limitations. First, the pathological evaluations of muscle biopsies were limited to the presence of inflammatory cell infiltration to ensure clear-cut pathological analyses, and the evaluation of muscle tissues was not standardised for sample size. Further investigations into the relationships between MRI findings and additional pathological features of IIMs, such as peri-fascicular atrophy/necrosis and necrotic and regenerating fibres with standardised methods, are warranted. Second, the diagnostic measurement of MSAs has evolved over the past decade, and we could include false-negative cases of MSAs that were not routinely measured, such as anti-SAE, anti-NXP2, anti-HMGCR and certain ARS antibodies. Third, whereas qualitative evaluation of MRI findings in this study is readily applicable to clinical practice, assessing the degree of inflammation or changes in inflammation over time is challenging. Therefore, analysis of MRI patterns with quantitative MR imaging methods is important for future study.
Conclusion
In IIM patients, characteristic muscle oedema on MRI reflects the histopathologic sites of inflammation in biopsied muscles and holds promise in predicting clinical characteristics. Muscle MRI could be an alternative method to infer muscle pathology and accurately diagnose patients with suspected IIMs, particularly in cases where muscle biopsies may not be feasible. These findings highlight the patient heterogeneity and underscore the extensive clinical applicability of muscle MRI in IIMs.
Supplementary material
Supplementary material is available at Rheumatology online.
Data availability
All the data in the present study are available from the corresponding author upon reasonable request.
Contribution statement
T.S. and K.Y. contributed equally to this study. T.S. contributed to the study design, reading of MR images, reading of pathological findings, data acquisition, analysis, interpretation, drafting and critical revision of the manuscript. K.Y. was involved in the study design, reading of MR images and pathological findings, data acquisition and interpretation, and drafting and critical revision of the manuscript. Y.M. was involved in detecting myositis-specific antibodies using ELISA, data acquisition, and manuscript revision. H.I., T.M., Y.O., K.N., T.U. and D.K. acquired data and revised the manuscript. All the authors have read and approved the final version of the manuscript.
Funding
This work was supported by the Japan Society for the Promotion of Science KAKENHI Grant Number JP22K16365.
Disclosure statement: All authors declare that they have no conflicts of interest.
Acknowledgements
A part of this work was presented as an oral presentation at the Japan College of Rheumatology Annual Conference in 2023.
References
Author notes
T.S. and K.Y. contributed equally.

Comments