


Abstract
To evaluate the relationship of thigh MRI (t-MRI) with manual muscle testing-8 (MMT-8), muscle enzymes and autoantibodies. To determine the causal and mediating factors resulting in poor recovery of MMT-8 in inflammatory myositis (IIM).
This was a single-centre retrospective study in IIM patients. t-MRI was semi-quantitatively scored for muscle oedema, fascial oedema, muscle atrophy and fatty infiltration. Spearman correlation of t-MRI scores was done with muscle enzymes at baseline, and MMT-8 at baseline and on follow-up. Causal mediation analysis was performed with age, sex, symptom duration, autoantibodies, diabetes and BMI as independent variables, follow-up MMT-8 as dependent and t-MRI scores as mediating variables.
Baseline evaluation was done on 59 and follow-up on 38 patients. Median follow-up of the cohort was 31 (10–57) months. Baseline MMT-8 negatively correlated with muscle oedema (r = –0755), fascial oedema (r = –0.443) and muscle atrophy (r = –0.343). Creatinine kinase (r = 0.422) and aspartate transaminase (r = 0.480) positively correlated with muscle oedema. Follow-up MMT-8 correlated negatively with baseline atrophy (r = –0.497) and fatty infiltration (r = –0.531). On follow-up, MMT-8 males had positive total effect (estimate (95%CI)) via atrophy [2.93 (0.44, 4.89)] and fatty infiltration [2.08 (0.54, 3.71)]. Antisynthetase antibody had a positive total effect via fatty infiltration [4.50 (0.37, 7.59)]. Age had a negative total effect via atrophy [–0.09 (0.19, –0.01)] and fatty infiltration [–0.07 (–0.15, –0.01)]. Disease duration had a negative total effect via fatty infiltration [–0.18 (–0.27, –0.02)].
Baseline fatty infiltration and muscle atrophy resulting from older age, female sex, longer disease duration and absent anti-synthetase antibodies, partly mediate muscle recovery in IIM.
Muscle edema and fascial edema t-MRI scores correlate with baseline MMT-8.
Muscle atrophy and fatty infiltration t-MRI scores correlate with follow-up MMT-8.
Older age, female sex, absence of antisynthetase antibodies and longer disease duration resulted in poor muscle recovery partly mediated by muscle atrophy and fatty infiltration.
Introduction
Idiopathic inflammatory myopathies (IIMs) are a heterogeneous group of systemic autoimmune disorders, which predominantly includes DM, PM, anti-synthetase syndrome (ASyS), IBM, immune-mediated necrotizing myopathy (IMNM), and overlap myositis [1]. Muscle weakness, one of the frequently encountered manifestations of IIM determines the treatment strategy in the majority of these patients. The pathophysiology of skeletal muscle weakness in myositis is poorly understood and may be a result of either muscle inflammation, muscle atrophy, sarcopenia or steroid usage [2]. Currently, the core set measures, myositis damage index and the response criteria by the International Myositis Assessment & Clinical Studies Group (IMACS) are commonly used measures in assessing disease activity and treatment outcomes in IIM [3–5]. Though these measures, which are a combination of clinical, laboratory and self-reported scores have shown prognostic implications, muscle MRI which is a commonly used modality in the evaluation of IIM has not been explored as a marker of long-term outcome.
MRI has good soft tissue contrast and provides detailed anatomical and structural information [6]. MRI aids IIM diagnosis by enabling targeted muscle biopsy and differentiating IIM mimics by accurately determining muscle involvement patterns and distribution [7–9]. MRI can non-invasively discriminate between muscle oedema (indicating activity) using short-tau inversion recovery (STIR) sequences and chronic processes such as fatty infiltration or atrophy (indicating damage) using T1-weighted sequences [10]. The signal intensity of oedema was shown to be directly proportional to the inflammation detected on muscle biopsy [11]. However, currently, there are no standardized or validated protocols for the evaluation of IIM patients with thigh-MRI (t-MRI).
In studies conducted to-date, semi-quantitative scoring of t-MRI has shown contradictory results in associating muscle inflammation and damage with skeletal muscle weakness [12–14]. Besides, the effects of MRI changes relating to damage on the long-term clinical outcomes of individuals with IIM are not yet explored. There is also a scarcity of data assessing the relationship of demographic, serological and clinical variables that might be associated with t-MRI changes. Identifying the clinical, demographic and serological factors associated with intramuscular fatty infiltration and muscle atrophy, which in turn would have an impact on clinical outcome may provide us with important clinical and mechanistic insights into the pathophysiology of muscle weakness.
Therefore, the objectives of this study are to evaluate the relationship of thigh magnetic resonance imaging (t-MRI) with MMT-8, muscle enzymes and autoantibodies and to determine the causal and mediating factors resulting in poor recovery of MMT-8 in inflammatory myositis.
Materials and methods
Study population
This is a single-centre retrospective study conducted in a tertiary care hospital in southern India. All patients enrolled in the departmental myositis cohort from 2010 to 2021 were screened. Adult IIM patients satisfying 2017 ACR-EULAR classification criteria [15], with t-MRI, muscle enzymes and clinical parameters documented at first visit were included in the study. Patients with cutaneous manifestations like heliotrope rash, Gottron’s papules or Gottron’s sign were classified as DM. Patients with positive anti-synthetase antibody with at least two of the following including interstitial lung disease, myositis, non-erosive arthritis, Raynaud’s phenomenon, fever, and mechanic’s hands were classified as AsyS [16]. Patients satisfying ENMC criteria for IMNM were classified as IMNM [17]. Patients satisfying ACR-EULAR classification criteria, not classifiable as DM, IBM, AsyS and IMNM were classified as PM.
Demographic and clinical parameters
Baseline demographic parameters, clinical parameters, Manual Muscle Testing-8 (MMT-8) performed on the dominant side, serological parameters including antibody profile tested using line immunoassay (Myositis profile 4 Euroline immunoblot) and muscle enzymes were noted through hospital records review. Disease duration is defined as the time from onset of the first symptom to the time the patient underwent baseline t-MRI. Follow-up MMT-8 value was recorded for all patients in stable remission. Stable remission was defined as myositis disease activity assessment tool (MDAAT) muscle activity recorded as zero at two visits at least six months apart or if maximum muscle strength (MMT-8 of 80) was achieved at the time of assessment. The patients should not have had any muscular or extra-muscular flare between the two evaluations and had to be continued on glucocorticoid dose ≤10 mg prednisolone equivalent per day and on a stable dose of immunosuppressive medication.
MRI image acquisition
All patients underwent t-MRI on Magnetom Avanto 1.5 Tesla MRI (Siemens, Germany) with a standardized protocol of coronal and axial T1-weighted and short-tau inversion recovery (STIR) sequences. The field of view was from the hips to the knees. Axial images were contiguously acquired throughout the thigh to evaluate the full extent of each muscle.
Image evaluation
Two individual assessors unaware of patients’ clinical disease activity and IIM subgroups scored t-MRI images using the semiquantitative scoring system adapted from a study done by Pinal-Fernandez et al. [9] The two evaluators were trained by a radiologist who had over 10 years of experience in reporting musculoskeletal MRI. The training was conducted using 15 cases, of which five were IIM, five were normal individuals and five were congenital myopathies. Fifteen muscles on each side including glutaeus maximus, obturator internus, obturator externus, sartorius, rectus femoris, vastus lateralis, vastus medialis, vastus intermedius, adductor longus, adductor brevis, and adductor magnus were scored. Each of these muscles was scored individually for four parameters including muscle oedema intensity, extent of muscle oedema, extent of fascial oedema, muscle atrophy and fatty infiltration (Fig. 1). Muscle oedema score for each muscle was calculated by multiplying muscle oedema intensity with the muscle oedema extent. For each of the t-MRI variables, a cumulative score was obtained by adding the scores of all 15 muscles in each thigh. Cumulative scores from both the thighs for every MRI variable were averaged and taken as the final score. The calculation was repeated by the two independent assessors. Scores from the two assessors were averaged, converted to a percentage of the maximum score (135 for muscle oedema and 45 each for fascial oedema, muscle atrophy and fatty infiltration) and considered for the final analysis.
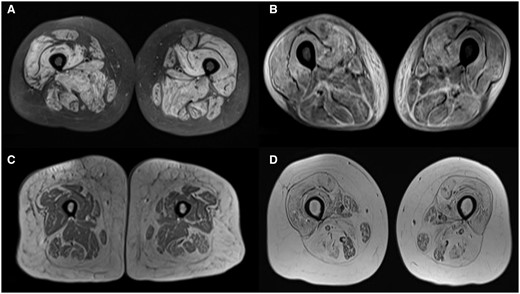
(A) STIR sequence showing muscle oedema in anterior medial and posterior compartments. (B) STIR sequence showing fascial oedema predominantly in posterior compartment. (C) T1-weighted sequence showing muscle atrophy in anterior medial and posterior compartments. (D) T1-weighted sequence showing fatty infiltration in anterior medial and posterior compartments
Ethical approval for the study was obtained from the Institutional Ethics Committee (JIP/IEC/2021/194) and the study was conducted in accordance with the Indian Council for Medical Research (ICMR) Guidelines for Biomedical Research on Human Participants and in accordance with the ethical standards as laid down in the 1964 Declaration of Helsinki and its later amendments.
Statistical analysis
Categorical variables were expressed as percentages and absolute frequencies, and continuous variables were reported as mean and standard deviation or median with the interquartile range depending on normality of data.
Inter-rater reliability of MRI scoring
Intraclass correlation coefficient was done to determine inter-rater reliability of MRI scores. The scores with an intraclass correlation coefficient of <0.8 were considered inconsistent and were re-scored by the radiologist.
Analysis to evaluate the relationship of baseline t-MRI scores with muscle strength, muscle enzymes and autoantibodies
All continuous variables were checked for normality using the Kolmogorov–Smirnov test. Spearman’s rank correlation was used to correlate between MMT-8 baseline and follow-up, muscle enzymes at baseline, with t-MRI scores. Correlation coefficient of >0.70 is considered very strong correlation, 0.40–0.69 is considered strong correlation, 0.30–0.39 is moderate correlation, 0.20–0.29 is weak correlation and <0.20 is no correlation. Kruskal–Wallis test and post-hoc analysis with pairwise comparisons were done to determine the association of various clinical and autoantibody-defined subgroups of patients with t-MRI parameters.
Causal mediation analysis
Causal mediation analysis was carried out to determine the effect of sociodemographic, clinical and serological variables on follow-up MMT-8 score through mediating t-MRI changes. Age and sex of the patient, body mass index, presence of diabetes, disease duration and myositis-specific antibody (MSA) subgroup were considered independent variables as all these factors determine intramuscular fatty infiltration. Fatty infiltration and muscle atrophy scores were considered mediating variables. Follow-up MMT-8 was the dependent variable.
Step one: We tested the total effect of the independent variables on the follow-up MMT-8 score with multiple linear regression model.
Step two: The effect of independent variables on the mediating variables, atrophy and fatty infiltration was tested using multiple linear regression model.
Step three: We simultaneously tested the effect of mediating and independent variables on follow-up MMT-8 score using multiple linear regression model.
Step four: The unstandardized direct and indirect effects of the independent variables, along with their total effect were estimated using 1000 bootstrapped samples. The 95% confidence interval for each of the estimates were also calculated.
The indirect effect was estimated as average causal mediation and the direct estimates were estimated as average direct effect from bootstrapped samples. The proportion of mediating effect was also estimated for each variable through both the mediating variables. The conceptual causal mediating model from the analysis is given as Supplementary Fig. S1, available at Rheumatology online. All the analysis was carried out at 5% level of significance and a P-value <0.05 was considered statistically significant.
All the analysis in the study was carried out in SPSS 22.0 (SPSS for Windows, Version 22.0, Chicago, USA, SPSS Inc.), RStudio and Stata Version 13.0. The correlation graphs were generated using StataSE 13.
Results
A total of 182 patients were screened for the study out of which 59 patients had baseline t-MRI and satisfied inclusion criteria. All the baseline characteristics except the proportion of AsyS patients were comparable between study cohort and patients excluded from the study. Proportion of AsyS patients was higher in study cohort (31.7%) compared with patients excluded (7.3%) (Supplementary Table S1, available at Rheumatology online). Follow-up MMT-8 was available for 38 patients. Figure 2 depicts the disposition of the study participants. DM, PM, ASyS and IMNM comprised 32, 5, 19 and 3 cases, respectively. The female-to-male ratio was 3:1 and the median age was 38 (IQR, 30–47) years. The median duration of disease at presentation was 4 (IQR, 2–12) months, and the median duration of follow-up was 31 (IQR, 10–57) months. Anti-Mi-2 (27.6%), anti-Jo-1(22%) followed by anti-PL-12 (12.1%) were the most prevalent MSA and anti-Ro-52 (17.2%) was the most prevalent myositis associated antibody (MAA) in our cohort. The median baseline MMT-8 was 60 (IQR, 48–70). Table 1 summarizes the baseline parameters of the study participants. Out of 59 patients, 50 patients (84.74%) had muscle oedema and fascial oedema at baseline. Twenty-four patients (40.67%) had atrophy and 36 patients (61.01%) had fatty infiltration at baseline.Eighteen patients (30.5%) had all four findings. Only three patients had normal MRI.
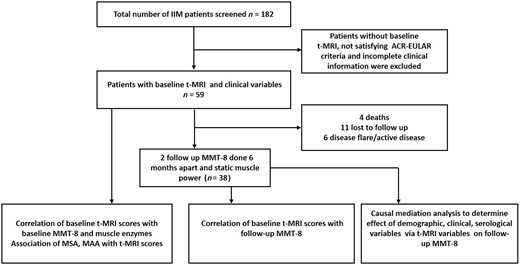
Consort diagram depicting an overview of the study
Baseline characteristics of the study participants
| Parameter | Frequency (%)/median (IQR) | |
|---|---|---|
| Demographic characteristics | Total patients | 59 |
| Female | 44 (74.60) | |
| Age (in years) | 38 (30–47) | |
| Disease duration (in months) | 4 (2–12) | |
| Diabetes | 12 (20.3) | |
| Obesity (BMI ≥25) | 13 (24.1) | |
| Disease subtype (n, %) | DM | 32 (56.7) |
| PM | 5 (8.3) | |
| ASyS | 19 (31.7) | |
| IMNM | 3 (1.9) | |
| MSA (n, %) | Mi-2 | 16 (27.6) |
| Jo-1 | 12 (20.7) | |
| PL-12 | 7 (12.1) | |
| NXP-2 | 3 (5.2) | |
| MDA-5 | 4 (6.9) | |
| SRP | 1 (1.7) | |
| Negative | 12 (20.7) | |
| MAA (n, %) | PM/Scl | 1 (1.7) |
| Ro-52 | 10 (17.2) | |
| Sm RNP | 2 (5.1) | |
| Ku | 3 (5.2) | |
| Baseline enzyme levels in IU/ul (median, IQR) | CPK | 1322 (125–3695.50) |
| LDH | 648 (448.50–985.50) | |
| AST | 91(55–223) | |
| ALT | 66 (37–140) | |
| Baseline clinical disease activity measures (median, IQR) | Baseline MMT-8 (n = 59) | 60 (48–70) |
| Median (IQR) t-MRI scores of the whole cohort | Muscle oedema | 17.40 (1.85–38.88) |
| Fascial oedema | 40 (13.33–60.00) | |
| Muscle atrophy | 2.22 (0–6.66) | |
| Fatty infiltration | 0 (0–3.33) |
AST: aspartate transaminase; ASyS: antisynthetase syndrome; ALT: alanine transaminase; CPK: creatinine phosphokinase; IMNM: immune-mediated necrotizing myopathy; IQR: interquartile range; LDH: lactate dehydrogenase; MAA: myositis-associated antibodies; MMT-8: manual muscle testing-8; MSA: myositis-specific antibodies; t-MRI: thigh MRI.
Inter-rater reliability
Intraclass correlation coefficient (ICC) between the two observers was >0.85 for all the independently assessed MRI parameters which included muscle oedema (ICC = 0.97), fascial oedema (ICC= 0.92), muscle atrophy (ICC = 0.87) and fatty infiltration (ICC = 0.97). Inter-rater reliability using Cohen’s kappa was also calculated for categorical scores for 15 individual muscles on the right side (Supplementary Table S2, available at Rheumatology online).
Correlation between t-MRI parameters and clinical parameters
Baseline MMT-8 had a significant (P < 0.05) negative correlation with t-MRI scores for muscle oedema (r = -0.755), fascial oedema (r = -0.443) and muscle atrophy (r = -0.343), but not with fatty infiltration. Baseline creatinine kinase (CPK) (r = 0.422) and aspartate transaminase (AST) (r = 0.480) had a significant (P < 0.05) positive correlation and lactate dehydrogenase (LDH) (r = 0.237, P = 0.102) had no correlation with t-MRI scores for muscle oedema. Fatty infiltration showed a moderate positive correlation with age (r = 0.435, P = 0.001). None of the t-MRI parameters correlated with disease duration.
On follow-up, the maximum MMT-8 negatively correlated with baseline t-MRI scores for muscle atrophy (r = -0.497, P = 0.001) and fatty infiltration (r = -0.531, P = 0.001) (Fig. 3 and Supplementary Table S3, available at Rheumatology online) but did not correlate with muscle and fascial oedema scores.
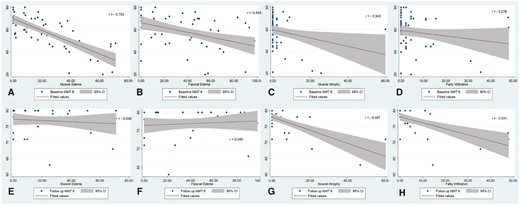
Correlation of baseline and follow-up MMT-8 with tMRI scores. (A) Correlation of baseline MMT-8 with t-MRI muscle oedema. (B) Correlation of baseline MMT-8 with t-MRI fascial oedema. (C) Correlation of baseline MMT-8 with t-MRI muscle atrophy. (D) Correlation of baseline MMT-8 with t-MRI fatty infiltration. (E) Correlation of follow-up MMT-8 with t-MRI muscle oedema. (F) Correlation of follow-up MMT-8 with t-MRI fascial oedema. (G) Correlation of follow-up MMT-8 with t-MRI muscle atrophy. (H) Correlation of follow-up MMT-8 with t-MRI fatty infiltration
Association of baseline t-MRI scores with demographic, clinical and disease subgroups
t-MRI scores between males and females, those with and without diabetes, with and without obesity were similar (P >0.05). Because the 75th centile for age in our cohort was 47 years, we compared t-MRI scores between those above and below 47 years. Those above 47 years of age had a significantly higher fatty infiltration [median (IQR)] [5.55(2.22–11.38)] (P = 0.014) compared with those <47 years [1.11(0.00–4.44)]. All the other parameters were similar across the two age groups (Supplementary Table S4, available at Rheumatology online).
On evaluating t-MRI scores across the clinical phenotypes, muscle oedema [median (IQR)] was maximum in PM + IMNM [43.70(28.61–53.14)] followed by DM [19.07(7.59–40.83)] and least in ASyS [7.77(0.00–20.37)] (P = 0.001). Muscle atrophy and fatty infiltration were similar across the three groups. On classifying the patients based on autoantibodies, muscle oedema [median (IQR)] was significantly higher among those with MSA positive DM [27.41(9.29–47.41)] when compared with those with anti-synthetase antibodies [7.77(0.00–20.37)] (P = 0.002). The presence of anti-Ro-52 was associated with significantly less muscle oedema [median (IQR)] when compared with the rest of the cohort [4.81(0.00–17.12)] (P = 0.013). Patients with both MSA and MAA positivity had less median muscle oedema [1.48(0.00–12.22)] compared with patients with only MSA positivity [22.22(8.15–38.88)] and patients without autoantibodies [20.55(3.42–44.62)]. Patients with positive MSA had higher muscle atrophy [median (IQR)] compared with those without autoantibodies [2.22(0.00–11.66)] (P = 0.021) (Table 2).
Association of baseline t-MRI scores with clinical and antibody-based subgroups
| t-MRI scores (median, IQR) | ||||
|---|---|---|---|---|
| Clinical subgroups | DM (n = 32) | AsyS (n = 19) | Others (n = 8) | P-value |
| Muscle oedema | 19.07(7.59–40.83) | 7.77*(0.00–20.37) | 43.70(28.61–53.14) | 0.001 |
| Fascial oedema | 46.56(22.22–79.46) | 23.33*(10.00–43.33) | 32.22(5.27–56.38) | 0.035 |
| Muscle atrophy | 0.00(0.00–2.22) | 0.00(0.00–3.33) | 3.33(0.00–27.91) | 0.262 |
| Fatty infiltration | 2.22(0.22–4.44) | 2.22(0.00–11.11) | 4.44(0.55–31.88) | 0.402 |
| Myositis-specific antibody subgroups | ||||
| MSA-positive DM (n = 19) | Antisynthetase (n = 19) | MSA-negative DM (n = 12) | P-value | |
| Muscle oedema | 27.41(9.29–47.41) | 7.77(0.00–20.37) | 17.97(3.43–37.50) | 0.037 |
| Fascial oedema | 44.44(17.78–86.67) | 23.33(10.00–43.33) | 55.00(36.94–79.47) | 0.004 |
| Muscle atrophy | 2.22(0.00–8.89) | 0.00(0.00–3.33) | 0.00(0.00–0.00) | 0.240 |
| Fatty infiltration | 2.22(0.00–8.89) | 2.22(0.00–11.11) | 0.56(0.00–3.03) | 0.069 |
| Myositis-associated antibody status | ||||
| Only MSA+(n = 32) | MSA+ and MAA+ (n = 11) | No autoantibodies (n = 12) | P-value | |
| Muscle oedema | 22.22(8.15–38.88) | 1.48(0.00–12.22) | 20.55(3.42–44.62) | 0.013 |
| Fascial oedema | 37.89(14.44–56.30) | 12.22(0.00–44.44) | 55.00(27.77–80.27) | 0.018 |
| Muscle atrophy | 2.22(0.00–11.66) | 0.00(0.00–2.22) | 0.00(0.00–0.00) | 0.023 |
| Fatty infiltration | 4.44(0.00–11.94) | 2.22(0.00–8.89) | 0.55(0.00–3.05) | 0.193 |
AsyS: antisynthetase syndrome; MSA: myositis-specific antibodies; MAA: myositis-associated antibodies; Others, PM and IMNM. Bold text indicates P < 0.05.
Factors determining follow-up MMT-8 by multiple linear regression and causal mediation analysis
Baseline t-MRI scores and follow-up MMT-8
Multiple regression analysis with t-MRI scores as independent variables and follow-up MMT-8 as the outcome variable showed that muscle atrophy (β = −0.552) (P = <0.001) score and fatty infiltration (β = −0.418) (P = <0.001) significantly predicted MMT-8. The model had an adjusted R2 of 0.614 for follow-up MMT-8 as the dependent variable.
Baseline t-MRI scores for muscle atrophy and intramuscular fatty infiltration as mediating variables determining follow-up MMT-8
Based on the previous regression model, muscle atrophy and fatty infiltration t-MRI scores were considered as mediating variables resulting in lower MMT-8 at follow-up. Age, sex, disease duration(months), diabetes, BMI and MSA subgroups were taken as independent variables for the outcome of follow-up MMT-8.
In step one, male sex (estimate=3.17) and disease duration (estimate=-0.20) had significant (P < 0.05) contributions towards follow-up MMT-8 score (Supplementary Table S5, available at Rheumatology online).
In step two, none of the independent variables had significant effects on atrophy (Supplementary Table S6a, available at Rheumatology online) or fatty infiltration (Supplementary Table S6b, available at Rheumatology online).
In step three, it was found that male sex (estimate = 1.84) MSA subgroup for anti-synthetase antibodies (estimate = 3.87), disease duration (estimate=-0.16), and t-MRI atrophy score (estimate = -0.16) was found to have a significant effect on follow-up MMT-8 score (Supplementary Table S7, available at Rheumatology online).
Upon evaluating the effect of all the independent variables on the follow-up MMT-8 score via t-MRI fatty infiltrate and muscle atrophy scores, none of the variables had a significant indirect effect or direct effect on the outcome. In terms of total effect, male sex had a significant positive total effect on follow up MMT-8 due to less atrophy [estimate +2.93 (95%CI: 0.44, 4.89); P = 0.014] and less fatty infiltration (estimate +2.08 (95%CI: 0.54, 3.71); P = 0.012]. Older age had a significant negative total effect due to more atrophy [estimate -0.09 (95% CI-0.19, -0.01); P = 0.032] and fatty infiltration [estimate -0.07 (95% CI: -0.15, -0.01); P = 0.016]. Anti-synthetase antibody positivity had a significant positive total effect on follow up MMT-8 due to less fatty infiltration [estimate +4.50 (95%CCI: 0.37, 7.59); P = 0.042] and longer disease duration had a significant negative total effect due to higher fatty infiltration [estimate -0.18 (95%CI: -0.27, -0.02); P = 0.036] (Table 3).
Direct, indirect and total effect of independent and mediating variables on MMT-8 scores from causal mediation analysis
| Independent variable | Mediator | ACME | ADE | Total effect | P-value | Proportion mediated |
|---|---|---|---|---|---|---|
| MSA subgroup | Atrophy | −0.41 (−3.07, 3.45) | 3.87 (0.13, 7.72) | 3.45 (−0.93, 8.56) | 0.144 | −0.12 (−5.14, 3.20) |
| Sex | Atrophy | 1.09 (−0.06, 2.84) | 1.84 (−0.12, 3.42) | 2.93 (0.44, 4.89) | 0.014 | 0.37 (−0.03, 1.07) |
| Diabetes | Atrophy | −0.77 (−3.10, 0.87) | 0.89 (−1.13, 3.28) | 0.12 (−1.83, 2.21) | 0.860 | −6.60 (−15.28, 13.65) |
| Age | Atrophy | −0.03 (−0.13, 0.04) | −0.06 (−0.14, 0.01) | −0.09 (−0.19, -0.01) | 0.032 | 0.37 (−1.01, 1.36) |
| BMI | Atrophy | 0.14 (−0.05, 0.42) | −0.11 (−0.30, 0.07) | 0.03 (−0.25, 0.33) | 0.830 | 4.94 (−12.26, 11.69) |
| Disease duration | Atrophy | −0.03 (−0.25, 0.05) | −0.16 (−0.26, 0.08) | −0.18 (−0.41, 0.07) | 0.110 | 0.14 (−0.83, 1.44) |
| MSA subgroup | Fatty infiltration | 0.63 (−0.98, 2.21) | 3.87 (−0.19, 7.91) | 4.50 (0.37, 7.59) | 0.042 | 0.14 (−0.32, 0.81) |
| Sex | Fatty infiltration | 0.24 (−0.24, 1.41) | 1.84 (−0.05, 3.68) | 2.08 (0.54, 3.71) | 0.012 | 0.11 (−0.15, 1.00) |
| Diabetes | Fatty infiltration | −0.05 (−0.76, 0.51) | 0.89 (−1.57, 3.15) | 0.84 (−1.52, 2.95) | 0.480 | −0.05 (−2.21, 1.82) |
| Age | Fatty infiltration | −0.01 (−0.07, 0.01) | −0.06 (−0.12, 0.01) | −0.07 (−0.15, -0.01) | 0.016 | 0.15 (−0.30, 1.18) |
| BMI | Fatty infiltration | −0.01 (−0.07, 0.06) | −0.11 (−0.31, 0.07) | −0.11 (−0.32, 0.06) | 0.190 | 0.04 (−1.75, 2.55) |
| Disease duration | Fatty infiltration | −0.02 (−0.16, 0.03) | −0.16 (−0.26, 0.05) | -0.18 (−0.27, -0.02) | 0.036 | 0.12 (−0.23, 1.37) |
ACME: average causal mediation effect; ADE: average direct effect; FI: fatty infiltration; MSA: myositis-specific antibody; MSA subgroup, Antisynthetase antibody. Bold text indicates P < 0.05.
Discussion
In this study, we found that t-MRI based muscle oedema and fascial oedema scores correlated well with muscle weakness and muscle enzymes (CPK and AST) at baseline evaluation. We then found that the maximum achievable follow-up MMT-8 correlated with the baseline muscle atrophy and fatty infiltration scores on t-MRI. Further, we found that older age, female sex, longer duration of illness, and absence of anti-synthetase antibodies resulted in lower recovery of skeletal muscle power and that these factors possibly act via pathways of muscle atrophy and fatty infiltration.
Our findings of correlation of oedema scores with baseline MMT-8 are in agreement with other studies which also have shown a good correlation of MRI oedema scores with global clinical activity and muscle visual analogue scale (VAS) [12]. The positive correlation of muscle oedema with muscle enzymes has also been demonstrated by other investigators, especially after exclusion of muscle fatty infiltration [13]. On the contrary, a retrospective study could not demonstrate any association between MMT-8, MDAAT-muscle, Patient Global VAS, Physician Global VAS and oedema grades [14]. This study had a mixture of various IIM subgroups including 18 IMNM, 28 DM/PM and 12 IBM patients. In subgroup analyses, they found that in IBM [18], muscle weakness correlated with fatty infiltration rather than muscle oedema and possibly the lack of correlation was due to the heterogeneity in IIM subtype. Our study focused majorly on DM, ASyS and a few PM patients and found that at the time of presentation, weakness was mainly due to inflammatory burden in the skeletal muscles as reflected by a high CPK and AST and that t-MRI may be a good tool to assess the overall burden.
Another key finding from our study is that patients with t-MRI detected fatty infiltration and muscle atrophy failed to achieve maximum muscle strength in the long term. This suggests that t-MRI is a good prognostic marker for skeletal muscle recovery. Skeletal muscle weakness irrespective of muscle mass and comorbidities is known to be an important risk factor for all-cause mortality in the elderly [19, 20]. Also, the presence of fatty infiltrate and atrophy at baseline may render these patients refractory to conventional therapy. This has been demonstrated in individuals with IMNM, where nearly 100% of them had fatty infiltration and atrophy and patients with severe fatty infiltration were refractory to therapy [21]. From previous and our studies, we know that the burden of fatty infiltration is large in IIM. Reports have suggested that up to 14% of patients have fatty infiltration at baseline and about half of PM, DM and ASyS patients progress to develop fatty infiltration over the course of the disease [8, 11, 22]. Pinal-Fernandez et al. showed that IMNM was associated with more oedema, fatty infiltration and atrophy and earlier onset of fatty infiltration when compared with DM and PM and anti-SRP myositis [9]. Our cohort had much less (n = 3) IMNM which did not allow us to do any meaningful analysis. We, on the other hand, found that individuals with anti-synthetase antibodies had less muscle and fascial oedema [23]. Presence of another important MAA Anti-Ro-52 also had less muscle oedema suggesting a protective role for these antibodies against muscle inflammation, or a predilection of these antibodies to cause pathology in extra muscular sites [24]. Also, it is possible that the organ predilection of these autoantibodies depends on the genetic and environmental factors of the patients and thus will need to be assess across various ethnically homogeneous cohorts.
The clinical subtypes including DM, PM and ASyS did not differ with respect to fatty infiltration. Among autoantibodies, MSA positivity had more muscle atrophy indicating that adaptive immune response mediated by MSAs might accelerate muscle damage in IIM. Previous studies showed that fatty infiltration increases with IIM disease duration [9, 11, 21, 25], but this was not seen in our study, possibly due to a shorter duration of illness as compared with the other studies.
Ageing, diabetes and obesity are well-known causes of skeletal muscle weakness and structural changes. Several studies have explored the role of fatty infiltration, muscle atrophy and underlying pathways in these conditions [26, 27]. In our study, older age and female sex led to poor muscle strength recovery and around 35% of this effect was mediated through muscle atrophy and <15% was mediated through fatty infiltration. Longer disease duration also decreased skeletal muscle recovery, 11% of which was mediated by fatty infiltration. The results from our study point to the occurrence of premature sarcopenia in an otherwise young population. All treatment protocols for IIM focus predominantly on optimizing immunosuppressive agents and physiotherapy [28]. But it is not known if these are sufficient to prevent the progress of muscle damage. In this context, it would be apt to explore pathways and triggers activating the fibro adipogenic progenitors and their response to muscle injury in IIM [29]. Apart from muscle weakness, fatty infiltration also has metabolic consequences and impacts endurance, which can affect long-term outcomes in IIM patients [27].
The strength of our study is that we have an ethnically homogeneous cohort with a uniform treatment protocol. We have used robust statistical methods to explore the causes and effects of muscle damage in IIM, which is a novel approach in IIM literature. The study has a few limitations. First, the small number of patients with IMNM and other rarer MSAs did not allow us to individually analyse the impact of these autoantibodies. The MRI score we have used is semi-quantitative and time consuming to score, hence making it available for clinical practice is difficult and better means of evaluating intramuscular fatty infiltration would be necessary for further research.
To conclude, baseline fatty infiltration and muscle atrophy determine the eventual skeletal muscle recovery. These changes resulting in low MMT-8 seem to be caused by older age, female sex, absence of antisynthetase antibodies, and longer disease duration. However, the effects of these variables do not completely explain the skeletal muscle damage and there seem to be other pathways for muscle damage in IIM which needs to be further explored.
Supplementary material
Supplementary material is available at Rheumatology online.
Data availability
The data underlying this article will be shared on reasonable request to the corresponding author.
Contribution statement
C.G.K. and M.M.T. designed the study. S.D., M.G., D.B., C.G.K., A.G. and V.S.N. recruited patients and were responsible for patient management. S.D., M.G. and C.G.K. collected clinical and serological data and M.G. collated the data. R.A. trained D.B. and M.G. in thigh MRI scoring and oversaw the semiquantitative scoring. D.B. and M.G. independently scored thigh MRI. M.G. and S.G. analysed the data with inputs from A.G. and C.G.K. M.G., D.B. and C.G.K. drafted the initial manuscript. V.S.N., M.M.T., A.G., S.G. and S.D. critically evaluated the manuscript and suggested edits. R.A. verified the section on MRI technique and scoring methods. All the authors agree and are equally responsible for the contents of the manuscript.
Funding
No specific funding was received from any bodies in the public, commercial or not-for-profit sectors to carry out the work described in this article.
Disclosure statement: The authors have declared no conflicts of interest.
References
Author notes
Present address for Devender Bairwa: Department of Medicine, All India Institute of Medical Sciences, Bilaspur, Himachal Pradesh, India
Present address for Saikumar Dunga: Consultant Rheumatologist and Clinical Immunologist Apollo Hospitals, Visakhapatnam, Andhra Pradesh, India
Present address for Vir Singh Negi: Executive Director, All India Institute of Medical Sciences, Bilaspur, Himachal Pradesh, India

Comments