


Abstract
To describe the incidence of Kawasaki Disease (kDa) between 2006 and 2021 in England.
We identified all cases in hospital episode statistics with an ICD-10 diagnostic code M303 (for kDa) between 1 April 2006 and 31 March 2021. We validated 83 diagnoses using hospital medical records and found >97% accuracy. We calculated incidence rate ratios (IRRs) using Poisson regression and assessed the influence of age, sex, ethnicity and index of multiple deprivation (IMD). We used Office for National Statistics population estimates for England as the denominator.
We identified a total of 5908 cases of kDa in all children under the age of 16 (mean age 3.8, s.d.=3.2, 95% CI: 3.7, 3.9). Incidence in children aged <5 years was 8.9 (95% CI: 8.6, 9.2)/100 000 person-years; in children aged 5–9, 2.4 (95% CI: 2.3, 2.6)/100 000 person-years; and in children aged 10–15, 0.6 (95% CI: 0.6, 0.7). Male : female ratio was 1.5 : 1. Incidence was higher among non-White than White ethnicities [adjusted IRR 2.1 (2.0–2.2) for Asian, 3.0 (2.8–3.3) for Black and 4.5 (4.2–4.8) for other ethnicities]. The incidence increased with socioeconomic deprivation; the adjusted IRR of the least deprived IMD quintile compared with the most deprived quintile was 0.81 (0.77–0.84).
Incidence rates of kDa derived from hospital admission data in England were higher than in studies relying on clinician reporting. We confirm previous findings on the influence of sex and ethnicity on kDa incidence and observe that there was a higher incidence of kDa within more deprived socioeconomic groups.
Incidence of KD in England was 8.9/100 000 in children <5 years; male : female ratio was 1.5 : 1.
KD incidence was higher in children of non-White ethnicity than White ethnicity.
KD incidence was higher in more deprived socioeconomic groups; the reasons for this are unknown.
Introduction
Kawasaki disease (kDa) is a self-limiting vasculitis that predominantly affects children <5 years. It progressively declines in incidence in older children and adolescents, and rarely affects adults [1]. It is associated with significant morbidity and the development of coronary artery aneurysms (CAA) in up to 19% of cases in the UK [1]. Patients with CAA have lifelong healthcare needs, with long-term impact on health service provision [2]. As such, kDa is the leading cause of acquired heart disease in developed countries [3, 4]. It is therefore important to ascertain accurate estimates of kDa incidence. Such data could inform understanding of the aetiology of kDa, facilitate planning of IVIG supplies (the mainstay of treatment for kDa), help to assess the efficacy of current therapeutic guidelines [5] and inform the design of clinical trials of additional treatments, e.g. the Kawasaki Disease Coronary Artery Aneurysm Prevention (KDCAAP) trial (ISRCTN71987471).
Previous UK studies of kDa incidence used prospective reporting of cases by clinicians, or unvalidated diagnoses of kDa in electronic healthcare records. The reported incidence among children <5 years has varied from 4.6 to 9.1/100 000 [1, 6] because of methodological differences. The incidence of CAA was reported in two British Paediatric Surveillance Unit (BPSU) studies in 1990 and 2013–15 [1], where rates were 29% and 19%, respectively. This is higher than reported in a multicentre trial in the USA (4.6%) [3], but consistent with epidemiological data from Europe [7, 8], Russia [9] and North America [10], which suggest high CAA rates despite treatment with IVIG.
The registration of rare diseases with the National Disease Registration Service (NDRS), in NHS Digital (NHSD), allows for the validation of cases recorded in electronic secondary healthcare records in England. This enables for the first time the study of rare diseases in the whole population of England (56 million, including 10.8 million children <16 years old) [11]. We hypothesized that that this innovation may provide a more accurate estimate of kDa incidence.
The aim of this study was to describe the incidence of kDa in the English population over the last 15 years, using routinely collected healthcare data available through the National Congenital Anomaly and Rare Disease Registration Service (NCARDRS) in NDRS [12]. The primary outcome is incidence rate of kDa in those <5 years of age, while secondary outcomes include incidence rates in those aged between 5 and 9, and 10 and 15 years. In addition, we describe the age, sex, ethnicity and socioeconomic status (SES) of the cohort, and their effect on incidence.
Methods
This study was conducted by the Registration of Complex Rare Diseases Exemplars in Rheumatology (RECORDER) project, which is a collaboration between the University of Nottingham, Nottingham University Hospitals NHS Trust and NCARDRS. The RECORDER project seeks to develop and validate novel methodologies to support national registration of rare rheumatological diseases using healthcare data. NCARDRS collects, collates, quality assures and analyses data on people with rare conditions to support high quality clinical practice and research, provide epidemiological data and empower patients [12].
NCARDRS has permission under Section 254 of the Health and Social Care Act 2012, under the National Disease Registries Directions 2021 [13], to perform this study. Working within NCARDRS, we accessed Hospital Episode Statistics (HES) data and detailed patient records at three hospital trusts.
HES Admitted Patient Care (APC) data contains details of all admissions at NHS hospitals in England. kDa is unlikely to be treated in primary or ambulatory care in England and therefore identification from HES APC is likely to capture most relevant data. We identified all HES APC episodes receiving the ICD-10 diagnostic code M303 (for kDa) as either the primary or co-morbid diagnosis between 1 April 2006 and 31 March 2021. We also identified all episodes coded with a diagnosis of CAA (I254) among people with a diagnosis of kDa. We included people resident in England only in keeping with NCARDRS legal permissions.
NCARDRS have data sharing agreements with acute NHS Trusts in England, which enabled us to confirm the diagnosis in a sample of medical records in order to validate our methodology. Records at four NHS Trusts were reviewed. These Trusts were geographically spread throughout England and included three teaching hospitals and one district general hospital. In one hospital Trust, the study team reviewed the medical records for every case identified from HES between 2003 and 2017. In three additional Trusts, registration staff at NCARDRS reviewed a random sample of 20 cases per Trust via remote access to local electronic health records. We calculated the positive predictive value (PPV) of a diagnostic code for kDa in HES for a clinical diagnosis of kDa, i.e. the proportion of people with a diagnosis of kDa recorded in HES who had a clinical diagnosis of kDa in their hospital notes for that admission. PPV is reported with binomial confidence intervals.
NICE guidance [14] recommends that children with a fever lasting 5 days or longer should be assessed for kDa. Other features of kDa may include the five cardinal features listed in the American Heart Association diagnostic criteria [3, 15]. Consideration was given to applying these diagnostic criteria to each case but, due to the time elapsed since diagnosis, the required information was no longer available in the records. A confirmed diagnosis was therefore defined as a clinical diagnosis of kDa made by a consultant paediatrician or physician. This approach conforms with NICE guidance and has been successfully used for derivation of international classification criteria for vasculitis of the young [16].
Age at diagnosis, sex and ethnicity data were extracted from HES. Ethnicity was categorized as Asian, Black, White, mixed, other and unknown based on NHS Business Service Authority ethnicity codes [17]. Where patients had >1 ethnicity recorded, the most common entry was used. In cases where one or more ethnicities were equally common, the most recent record was used. Socioeconomic status was measured by index of multiple deprivation quintiles [18], with 1 being the most deprived and 5 being the least deprived. Allocations were based on the geographical area [lower layer super output area (LSOA)] ascribed to each patient’s home postcode at the earliest date of the kDa ICD10 code (Supplementary Data S1, available at Rheumatology online).
Annual incidence of kDa in England was calculated for each year of the study. The Office for National Statistics (ONS) mid-year population estimates for each year 2006–2020 were used as the denominator [11]. A Poisson regression model was used to describe the trend of Kawasaki incidence cases through this period (Supplementary Data S2, available at Rheumatology online). To examine temporal and geographical trends, the frequency of hospital admissions was plotted by month of study and by month of year, and the incidence rate was calculated by region.
The majority of CAA cases are identified during outpatient encounters (follow-up echocardiograms are typically scheduled at 2 and 6 weeks) and outpatient HES data are not well coded, with diagnosis frequently lacking. We therefore only report the CAA cases identified during a hospital admission (and so recorded in HES APC).
We examined the association of age, sex, ethnicity and IMD on the incidence of kDa during the study period. We fitted each into a univariable Poisson regression model to calculate the unadjusted incidence rate ratio (IRR) for each category of age, sex, ethnicity and IMD. Due to denominator population data only being available stratified by age, sex and IMD or age, sex and ethnicity, we report the IRRs for age, sex and IMD all mutually adjusted, and the IRR for ethnicity adjusted for age and sex. We then fitted multivariable regression models to report adjusted IRRs.
‘Population by Index of Multiple Deprivation (IMD), England, 2001–2019’ [19] was used for the denominator data for age, sex and IMD. The data from 2019 was used for the study year 2020/21.
For ethnicity, ‘Population denominators by ethnic group, regions and countries: England and Wales, 2011–2018’ [20] was used for the denominator data. The data from 2011 were used for years 2006/7–2010/11, and from 2018 for years 2019/20 and 2020/21. As there is no gold standard denominator population for ethnicity in England, we tested our proposed method with secondary analyses to ensure it was robust. We also considered alternative general population datasets. Further details, including the results of secondary analyses, can be found in Supplementary Data S3, available at Rheumatology online.
Data for this study were collected and analysed under the National Disease Registries Directions 2021, made in accordance with sections 254(1) and 254(6) of the 2012 Health and Social Care Act. Further ethical approval for this study was not required per the definition of research according to the UK Policy Framework for Health and Social Care Research.
Results
Cohort identification
In total, 5908 individuals aged <16 and with a diagnostic code for kDa were identified. A flowchart demonstrating how the cohort was extracted from HES is shown in Supplementary Figure S1, available at Rheumatology online.
Confirmation of correct diagnosis
In Trust One, of the 37 patients coded as having a diagnosis of kDa, all were assessed as being accurately coded in that they had been given a diagnosis of and/or treated as kDa. There were 32/37 patients aged <16 years. The remaining 5/37 patients were diagnosed in adulthood based on pathognomonic coronary angiogram findings (isolated aneurysmal segments or diffuse ectactic disease). Of these, all were White males, mean age 57.2 years (range 54 to 62), and all had additional risk factors for coronary artery disease (such as smoking status, hypertension, etc).
Case confirmation in other trusts
A random sample of 20 patients each from three additional NHS Trusts had 11, 17 and 18 sets of notes available for review. The diagnosis was confirmed in 10/11 (90.9%), 17/17 (100%) and 17/18 (94.4%) of cases, respectively. Overall, in all four Trusts, 81/83 cases identified had kDa and thus the positive predictive value of a coded diagnosis for kDa was 97.6% (91.6–99.7%).
kDa Incidence
Children <5 years
We identified 4387 cases during the 15-year study period (1 April 2006 to 31 March 2021) in children aged <5, of which 1771 cases (40.4%) were female giving a male : female ratio of 1.5 : 1. Over the whole study period, the incidence of kDa in children aged <5 years was 8.9 (95% CI: 8.6, 9.2)/100 000 person-years (Table 1).
Annual incidence of Kawasaki disease in children under 5
| Financial Year (1 April to 31 March) | Number of incident cases of KD in England in children <5 | Population aged <5 (ONS mid-year estimate) [11] | Incidence per 100 000 children <5 years (95% CI) |
|---|---|---|---|
| 2006/7 | 203 | 2 963 115 | 6.9 (5.9, 7.8) |
| 2007/8 | 237 | 3 049 020 | 7.8 (6.8, 8.8) |
| 2008/9 | 247 | 3 142 705 | 7.9 (6.9, 8.8) |
| 2009/10 | 246 | 3 211 905 | 7.7 (6.7, 8.6) |
| 2010/11 | 293 | 3 280 494 | 8.9 (7.9, 10) |
| 2011/12 | 327 | 3 328 746 | 9.8 (8.8, 10.9) |
| 2012/13 | 291 | 3 393 356 | 8.6 (7.6, 9.6) |
| 2013/14 | 315 | 3 414 130 | 9.2 (8.2, 10.2) |
| 2014/15 | 330 | 3 430 957 | 9.6 (8.6, 10.7) |
| 2015/16 | 317 | 3 434 680 | 9.2 (8.2, 10.2) |
| 2016/17 | 404 | 3 429 046 | 11.8 (10.6, 12.9) |
| 2017/18 | 320 | 3 384 925 | 9.5 (8.4, 10.5) |
| 2018/19 | 287 | 3 346 727 | 8.6 (7.6, 9.6) |
| 2019/20 | 288 | 3 299 637 | 8.7 (7.7, 9.7) |
| 2020/21 | 282 | 3 239 447 | 8.7 (7.7, 9.7) |
| Total | 4387 | 49 348 890 | 8.9 (8.6, 9.2) |
Children and adolescents aged 5–9 and 10–15 years
In those aged 5–9 there were 1162 cases of kDa during the 15-year study period (1 April 2006–31 March 2021). A total of 435 (37.4%) were female giving a male : female ratio of 1.6 : 1. The incidence rate of kDa in those aged 5–9 was 2.4 (95% CI 2.3, 2.6)/100 000 person-years (Table 2).
Annual incidence of Kawasaki disease in children aged 5–9 and 10–15
| Financial year (1 April to 31 March) | Incident cases of KD in England in children aged 5–9 | Population aged 5–9 (ONS mid-year estimate) | Incidence per 100 000 children aged 5–9 years (95% CI) | Incident cases of KD in England in children aged 10–15 | Population aged 10–15 (ONS mid-year estimate) | Incidence per 100 000 children aged 10–15 years (95% CI) |
|---|---|---|---|---|---|---|
| 2006/7 | 76 | 2 987 103 | 2.5 (2.0, 3.1) | 27 | 3 852 719 | 0.7 (0.4, 1.0) |
| 2007/8 | 58 | 2 937 497 | 2.0 (1.5, 2.5) | 22 | 3 829 036 | 0.6 (0.3, 0.8) |
| 2008/9 | 71 | 2 912 054 | 2.4 (1.9, 3.0) | 20 | 3 798 108 | 0.5 (0.3, 0.8) |
| 2009/10 | 71 | 2 911 772 | 2.4 (1.9, 3.0) | 38 | 3 780 220 | 1.0 (0.7, 1.3) |
| 2010/11 | 72 | 2 934 351 | 2.5 (1.9, 3.0) | 34 | 3 745 947 | 0.9 (0.6, 1.2) |
| 2011/12 | 79 | 2 990 135 | 2.6 (2.1, 3.2) | 25 | 3 711 249 | 0.7 (0.4, 0.9) |
| 2012/13 | 87 | 3 083 582 | 2.8 (2.2, 3.4) | 21 | 3 653 288 | 0.6 (0.3, 0.8) |
| 2013/14 | 82 | 3 187 919 | 2.6 (2.0, 3.1) | 17 | 3 607 189 | 0.5 (0.2, 0.7) |
| 2014/15 | 74 | 3 272 365 | 2.3 (1.7, 2.8) | 20 | 3 600 234 | 0.6 (0.3, 0.8) |
| 2015/16 | 75 | 3 357 463 | 2.2 (1.7, 2.7) | 13 | 3 612 971 | 0.4 (0.2, 0.6) |
| 2016/17 | 70 | 3 428 266 | 2 (1.6, 2.5) | 17 | 3 671 788 | 0.5 (0.2, 0.7) |
| 2017/18 | 80 | 3 497 402 | 2.3 (1.8, 2.8) | 16 | 3 755 644 | 0.4 (0.2, 0.6) |
| 2018/19 | 69 | 3 523 866 | 2 (1.5, 2.4) | 21 | 3 877 865 | 0.5 (0.3, 0.8) |
| 2019/20 | 85 | 3 538 206 | 2.4 (1.9, 2.9) | 19 | 3 978 836 | 0.5 (0.3, 0.7) |
| 2020/21 | 113 | 3 539 458 | 3.2 (2.6, 3.8) | 49 | 4 073 335 | 1.2 (0.9, 1.5) |
| Total | 1162 | 48 101 439 | 2.4 (2.3, 2.6) | 359 | 56 548 429 | 0.6 (0.6, 0.7) |
In those aged 10–15 we found 359 cases of kDa of which 125 cases (34.8%) were female giving a male : female ratio of 1.8 : 1. The incidence rate of kDa in those aged 10–15 was 0.6 (95% CI 0.6, 0.7)/100 000 person-years (Table 2).
Younger age, male sex, lower socioeconomic group and non-White ethnicity were all associated with increased incidence of kDa (Table 3). Incidence in females was 32% lower than males (IRR 0.68, 95% CI 0.65, 0.71). Incidence in age 5–9 years and 10–14 years were 73% and 92%, respectively, lower than in 0–4-year-olds. Incidence in the least deprived quintile was 19% lower (IRR 0.81, 95% CI 0.77, 0.84) than the most deprived quintile. Incidence among Black or Black British ethnicity was 2.8 (95% CI 2.43, 3.22) times higher, among Asian or Asian British was 2.10 (95% CI 1.85, 2.34) times higher, among mixed ethnicity was 1.23 (95% CI 1.14, 1.33) times higher and among children from other ethnic groups was 4.40 (95% CI 3.81, 5.07) times higher than White children.
Demographics, incidence rates and Poisson regression modelling of Kawasaki disease in children aged <16 yearsb using data from 2006 to 2021
| Number of incident cases of KD in England | Denominator population | Crude incidence rates per 100 000 | Crude incidence rate ratio (95% CI) | Adjusted incidence rate ratio (95% CI)a | |
|---|---|---|---|---|---|
| Sexb | |||||
| Male | 3550 (60.6%) | 73 996 702 | 4.8 (4.6–5.0) | 1.00 | 1 |
| Female | 2309 (39.4%) | 70 494 756 | 3.3 (3.1–3.4) | 0.68 (0.68, 0.69) | 0.68 (0.65, 0.71) |
| Age in yearsb | |||||
| <5 | 4387 (74.9%) | 49 409 080 | 8.9 (8.6–9.1) | 1.00 | 1 |
| 5–9 | 1162 (19.8%) | 48 100 187 | 2.4 (2.3–2.6) | 0.27 (0.26, 0.28) | 0.27 (0.26, 0.29) |
| 10–14 | 310 (5.3%) | 46 982 191 | 0.7 (0.6–0.7) | 0.07 (0.07, 0.08) | 0.08 (0.07, 0.09) |
| Socioeconomic statusb | |||||
| 1 (most deprived) | 1608 (27.4%) | 34 846 218 | 4.6 (4.4–4.8) | 1.00 | 1 |
| 2 | 1393 (23.8%) | 29 554 575 | 4.7 (4.5–5.0) | 1.02 (1.01, 1.03) | 1.03 (0.99, 1.07) |
| 3 | 1049 (17.9%) | 26 927 138 | 3.9 (3.7–4.1) | 0.84 (0.83, 0.85) | 0.88 (0.84, 0.92) |
| 4 | 905 (15.4%) | 26 088 184 | 3.5 (3.2–3.7) | 0.75 (0.74, 0.76) | 0.81 (0.74, 0.87) |
| 5 (least deprived) | 904 (15.4%) | 27 075 343 | 3.3 (3.1–3.6) | 0.72 (0.71, 0.73) | 0.81 (0.77, 0.84) |
| Ethnicityc | |||||
| White | 3519 (59.6%) | 112 227 984 | 3.1 (3.0–3.2) | 1.00 | 1 |
| Asian or Asian British | 1012 (17.1%) | 15 144 220 | 6.7 (6.3–7.1) | 2.13 (2.07, 2.19) | 2.10 (1.85, 2.34) |
| Black or Black British | 659 (11.2%) | 7 378 055 | 8.9 (8.2–9.6) | 2.85 (2.72, 2.97) | 2.80 (2.43, 3.22) |
| Other [17] | 290 (4.9%) | 1 988 582 | 14.6 (12.9–16.3) | 4.65 (4.26, 5.02) | 4.40 (3.81, 5.07) |
| Mixed [17] | 360 (6.1%) | 8 521 044 | 4.2 (3.8–4.7) | 1.35 (1.25, 1.44) | 1.23 (1.14, 1.33) |
| Unknown [17] | 68 (1.2%) | — | — | — | — |
Adjusted rate ratios for age, sex and IMD are mutually adjusted, rate ratio for ethnicity is adjusted for age and sex.
The population denominator for age, sex and IMD calculations [19] was grouped by 5-year age bands. The number of incident cases were therefore adjusted to remove age ≥15 years.
Population denominator for ethnicity calculations [20].
Cases of kDa occurred unevenly during the 15-year period of study (Fig. 1) and were higher at the end of the study period than at the beginning (P < 0.001).
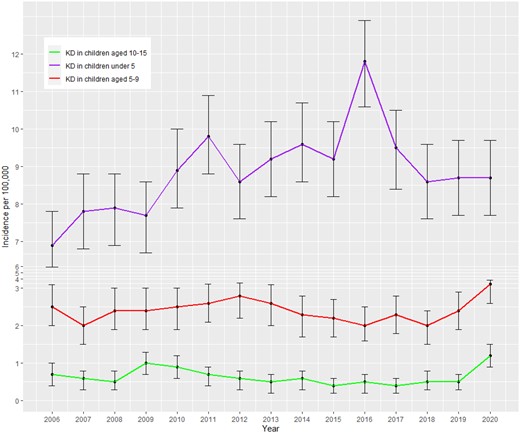
Annual incidence of Kawasaki disease at age <5, 5–9 and 10–15. *Error bars show 95% CI for incidence rates
Analysis of the monthly distribution of cases revealed an increase in the number of cases from October to January, followed by a reduction in cases between February and September (Fig. 2).
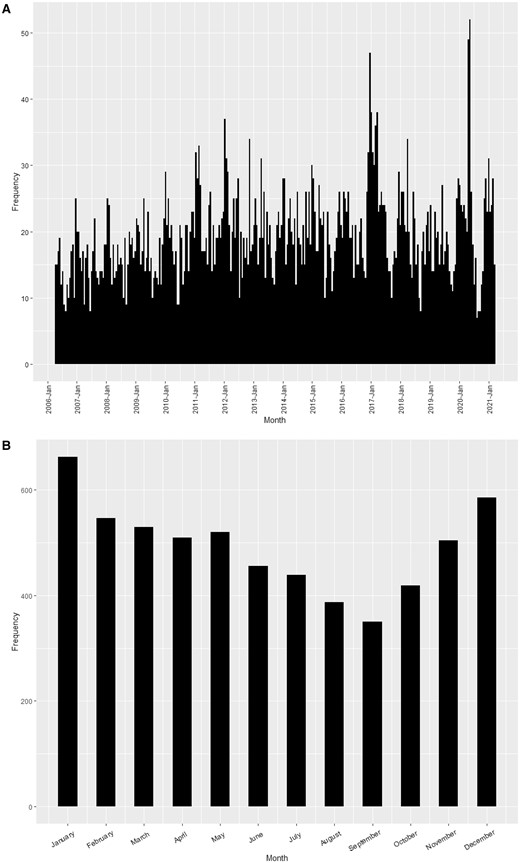
Kawasaki disease incidence age <16 years (i) by month and year and (ii) by month (2006–2021 combined). (A) The frequency of KD incident cases by month and year; (B) the frequency of KD incidence cases by month
A study of the regional distribution of cases showed that the East Midlands region had the lowest concentration of cases, while London had the highest (Fig. 3). Regional data including confidence intervals are shown in Supplementary Data S4, available at Rheumatology online.
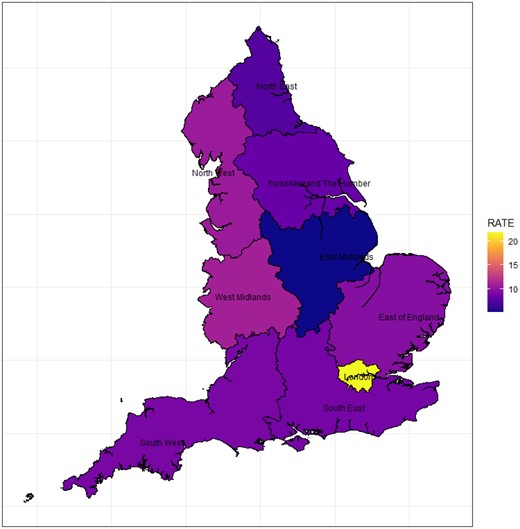
Choropleth map showing Kawasaki disease rates by region (rates per 100 000 patient-years). Colour version available online
Coronary artery aneurysms
We report the proportion of cases diagnosed with CAA during their initial hospital admission [median 5 days (IQR 5 days)]. Of the kDa cases identified (n = 5908), 420 (7.1%) cases had a diagnosis of CAA made during their initial acute hospital stay. As explained in the Methods section, CAA are often captured at follow-up 2-week and 6-week echocardiogram and so we anticipate that the true number will be higher, but these data were not collected in this study.
Discussion
Main findings
We have used a validated approach to identify cases of kDa from hospital admission data for the whole of England for the last 15 years. We estimate the overall incidence in children aged <5 years to be 8.9/100 000 person-years, with lower incidence rates in the 5–9 and 10–14 age groups. Whilst the incidence rate varied from year to year, there was a gradual increase with time. By the end of study period there was an estimated seven more patients diagnosed with kDa in England each year in children aged <5 years.
kDa was observed in all months of the year, albeit with lowest incidence in the summer months (July–September). There was a ratio of 1.5 : 1 males : females, in line with other studies [1, 3, 6]. Incidence was higher in non-White than White ethnicities. We observe for the first time in England an increase in kDa incidence with increasing socio-economic deprivation.
Strengths
Identifying cases of kDa among hospital admissions for the whole of England, using validated methodology, represents a more robust way to determine incidence of kDa than previous studies that have relied on clinician reporting. This method is known to under-report cases of kDa [21], with a previous study from Germany estimating under-reporting of 37–44% of cases [8].
Our population-based case ascertainment strategy from routinely collected healthcare records was made possible by collaboration with NCARDRS at NHS Digital. We found a positive predictive value of 97.6% (91.6–99.7%) for our case ascertainment strategy, which means that around 98 out of every 100 people we identified as having kDa for this study were actually being treated for kDa. This level of accuracy is very high for studies using national databases of routinely collected healthcare records.
To the best of our knowledge, this is the largest study of kDa incidence in England, allowing a more accurate estimate of the influence of age, sex and ethnicity. This is the first description of the impact of socioeconomic status.
Limitations
Our study has important methodological limitations. Using hospital admissions as our data source means that we would miss any cases of kDa diagnosed and treated in the community or as outpatients, or where the inpatient diagnosis was not coded into HES. However, as both national and international guidelines for kDa management require hospital admission for treatment, all patients with suspected kDa should be admitted to hospital. We also found the positive predictive value of the diagnosis validated across four Trusts was exceptionally high (97.6%). Accuracy of HES coding has improved since the introduction of ‘Payment By Results’ in 2002, meaning financial reimbursement of NHS trusts was linked to coded performance data, which created a drive to improve coding standards. Payment By Results improved primary diagnosis coding accuracy from 73.8% to 96% according to a systematic review in 2012 [22]. To ensure modern data standards, only patients receiving codes since 2006 were included in this study. Information governance, including accuracy of HES data, is a key element examined regularly by the Care Quality Commission, meaning HES coding is quality assured across England.
The denominator population data used were not available stratified by age, sex, ethnicity and socio-economic status (only age, sex and ethnicity; or age, sex and socioeconomic status). It was therefore not possible to mutually adjust the analysis for ethnicity and socio-economic status, meaning that there may be residual confounding of ethnicity on the adjusted IRRs for socioeconomic status and vice versa. This should be considered when interpretating the results. To our knowledge, this is the first analysis of the effect of socioeconomic status on incidence of kDa and provides novel information, despite this limitation.
There is no gold standard ONS population data stratified by ethnicity for the study period. We used three datasets of available denominator data and undertook a sensitivity analysis making ‘worst case’ assumptions to test the robustness of our findings (Supplementary Data). Across all possible datasets, and using ‘worst case’ assumptions for inaccuracies or categorisation of missing data for ethnicity, our findings are robust.
Our study includes the financial year 2020–2021, during the COVID-19 pandemic. Paediatric Multisystem Inflammatory Syndrome temporally associated with SARS-CoV-2 (PIMS-TS) was identified in April 2020, which includes a Kawasaki-like syndrome. This creates the potential for diagnostic uncertainty and some of the cases coded as kDa may have latterly transpired to be PIMS-TS, once the condition was identified and better understood.
Comparison to other literature
The incidence rate of kDa in children aged <5 years was 8.9/100 000 person-years in this study. This is higher than the most recent UK publication, a BPSU survey conducted between 2013 and 2015, which found an incidence of 4.6/100 000 person-years in children aged <5 years [1]. This study relied on clinician reporting of any cases of kDa seen in the past month, a method recognised to underestimate incidence [8].
Previous studies in routinely collected community and hospital records in the UK provide estimated incidence rates similar to our findings. A general practice database study using The Health Improvement Network (THIN) data found an incidence of 9.1/100 000 (95% CI: 7.3, 11.2) in children aged <5 years between 2008 and 2012 [6]. A study using HES data between 1999 and 2000 found an incidence rate of 8.1/100 000 (95% CI: 7.1, 9.2) in children aged <5 years [23]. Our study adds to this field as our ability to validate the diagnoses in a sample of hospital notes improves confidence that the included cases actually had kDa.
Our estimate is lower than most countries in Europe, where reported incidence rates are 10–15/100 000 children aged <5 years [24]. The reasons for this are unknown. Comparison to studies from outside Europe is limited by the differential incidence in different ethnic groups, as reported in our and other studies [24].
We have shown a kDa incidence gradient within socioeconomic status in England, with increasing incidence with increasing deprivation. This finding aligns with a previous study of kDa in England that also reported that deprivation was related to incidence of kDa, with the poorest areas having a pooled incidence of 9.48 compared with 7.09 in the least deprived areas [25]. This finding is in keeping with other work on social determinants of health [26], but seemingly at odds with a study from San Diego that reported kDa incidence to be positively associated with higher socioeconomic status [27]. Methodological heterogeneity regarding definitions of socio-economic status and variance in healthcare provision across different socio-economic groups in North America and England are likely to contribute to these apparently conflicting observations.
Like the 2013–15 BPSU survey [1], our study found only a small increase in incidence in males compared with females (ratio 1.5 : 1), and in keeping with most previous studies we found a seasonal pattern, with higher incidence in the winter months [28].
There is general consensus that kDa is more prevalent in people of Asian descent [24]. However, our study suggests that Black and other minority groups had an even higher incidence rate than Asians and all had a higher rate when compared with Whites.
Coronary artery aneurysms
We were not able to report incidence of CAA among cases of kDa as we had hoped. All diagnoses of CAA identified in this study were made during the initial hospital admission and we were not able to identify cases where CAA were diagnosed subsequent to this, including at 2-week and 6-week surveillance echocardiograms. Our report of the proportion of cases of kDa with CAA is therefore an under-estimate of the true CAA complication rate [7–10], as aneurysm formation is typically observed between weeks 2 and 6 of the disease [3].
Despite this, our finding of CAA occurring in 7.1% of children <16 with kDa during the initial hospital admission is higher than in clinical trials [3]. This supports the 19% found at 30 days after diagnosis in the 2013–15 BPSU survey [1], and in other emerging studies [6, 23, 24].
Clinical implications and conclusions
Our findings suggest that kDa is more common in England than previously reported. There may be underdiagnosis in lower socioeconomic groups, an issue that may be addressed by increasing awareness of this disease via patient support groups (https://www.societi.org.uk/).
We were not able to report true CAA rates, only the minority of CAA that were diagnosed during the initial hospital admission. Despite this, our findings showed a higher rate than suggested by clinical trials [3] and support recent findings of CAA in up to 19% of cases of kDa [1].
Given the resource implications in the management of kDa, particularly with regard to the lifelong care required for patients with CAA, determining the incidence of kDa with accuracy marks a vital step in allowing appropriate planning of services in the UK.
Supplementary material
Supplementary material is available at Rheumatology online.
Data availability
Due to legal and ethical considerations, supporting data cannot be made openly available. However, NCARDRS data are available to all who have a legal basis to access them. Further details about the data and conditions for access are available by application to the National Disease Registration Service (https://www.ndrs.nhs.uk/).
Funding
No specific funding was received from any bodies in the public, commercial or not-for-profit sectors to carry out the work described in this article.
Disclosure statement: M.O., F.A.P. and P.C.L. are recipients of a grant from Vifor pharma. Vifor pharma had no influence on the design, conduct or interpretation of this study. P.B. has received consultancy fees from Novartis, Sobi, Roche and Catalyst Biosciences.
Acknowledgements
This work uses data that has been provided by patients, the NHS and other health care organisations as part of patient care and support. The data is collated, maintained and quality assured by the National Congenital Anomaly and Rare Disease Registration Service, which is part of NHS Digital (NHSD). [Source: Hospital Episode Statistics (HES), NHS Digital Copyright © 2022, Re-used with the permission of NHS Digital. All rights reserved.] We would like to thank Joanna Snietura, Julie Battista and Matthew Bell who undertook the patient case validation for three additional Trusts. Special thanks to Jennifer Lai, who extracted updated indices of deprivation data for our cohort. M.R. is funded by a Versus Arthritis Clinical Research Fellowship (Award reference: 22727). F.A.P. is funded by the National Institute for Health Research (NIHR Advanced Fellow NIHR300863). The views expressed in this publication are those of the author(s) and not necessarily those of the NIHR, NHS or the UK Department of Health and Social Care.
References
NICE guideline [NG143]. Fever in under 5s: assessment and initial management.

Comments