


Abstract
Damage accrual in SSc can be tracked using the Scleroderma Clinical Trials Consortium Damage Index (DI). Our goal was to develop a prediction model for damage accrual in SSc patients with early disease.
Using patients with <2 years disease duration from Canada and Australia as a derivation cohort, and from the Netherlands as a validation cohort, we used group-based trajectory modelling (GBTM) to determine ‘good’ and ‘bad’ latent damage trajectories. We developed a prediction model from this analysis and applied it to patients from derivation and validation cohorts. We plotted the actual DI trajectories of the patients predicted to be in ‘good’ or ‘bad’ groups.
We found that the actual trajectories of damage accumulation for lcSSc and dcSSc were very different, so we studied each subset separately. GBTM found two distinct trajectories in lcSSc and three in dcSSc. We collapsed the two worse trajectories in the dcSSc into one group and developed a prediction model for inclusion in either ‘good’ or ‘bad’ trajectories. The performance of models using only baseline DI and sex was excellent with ROC AUC of 0.9313 for lcSSc and 0.9027 for dcSSc. Using this model, we determined whether patients would fall into ‘good’ or ‘bad’ trajectory groups and then plotted their actual trajectories which showed clear differences between the predicted ‘good’ and ‘bad’ cases in both derivation and validation cohorts.
A simple model using only cutaneous subset, baseline DI and sex can predict damage accumulation in early SSc.
Development of a damage index for SSc allows measurement and tracking of damage accumulation.
This study provides a simple model using cutaneous subset, baseline damage index and sex to predict damage trajectory.
Clinicians and researchers can predict who requires intensive treatment to limit damage accrual.
Introduction
Systemic sclerosis (SSc) is a rare systemic autoimmune disease associated with high mortality. It is characterized by immune dysregulation, vasculopathy and fibroblast dysfunction which ultimately leads to increased deposition of extracellular matrix, fibrosis and irreversible organ damage [1]. To measure damage in SSc, the Scleroderma Clinical Trials Consortium Damage Index (SCTC-DI) was developed and validated in 2019 [2]. As the first validated SSc damage measurement, the SCTC-DI may allow us to better study the natural evolution of the disease and be useful in both the clinical and trial design setting.
Group-based trajectory modelling (GBTM) is now increasingly used in clinical studies [3]. GBTM assumes a baseline patient population is heterogeneous and composed of clusters of individuals following similar disease courses. It classifies these individuals into groups (or trajectories) based on how they evolve over time and can identify defining characteristics of its members [4, 5]. These trajectories may be considered latent trajectories in that they are not directly observed but are rather inferred through a mathematical model from other variables that are observed.
In a cohort of 410 incident SSc cases (disease duration <2 years), we identified three distinct trajectories of damage accrual with approximately half (45.4%) of patients in the worse damage trajectories (medium and high damage) [6]. Diffuse cutaneous SSc (dcSSc), tendon friction rubs, diffuse disease, elevated baseline inflammatory markers, older age and male sex increased the odds of having the worst damage trajectory whereas anti-centromere antibodies (ACA) and Caucasian ethnicity decreased them.
This study aims to identify if there are distinct predictors of damage accrual early in the course of SSc. We hypothesized that we could find strong predictors of worse trajectories that would be useful to the clinician and perhaps valuable in case selection for clinical trials where damage prevention may be an outcome. As our previous work identified dcSSc as the strongest predictor of worse damage accrual, we decided a priori to determine whether it would be reasonable to divide our analyses into limited cutaneous SSc (lcSSc) and dcSSc separately. We also hypothesized that we could use the latent trajectories discovered using GBTM to develop a prediction model that would predict actual, rather than only latent, trajectories.
Methods
Study design
We decided a priori that our objectives were to allow clinicians or researchers to predict early in the disease course of SSc whether a patient would follow a ‘good’ or ‘bad’ trajectory of damage accrual. We first assessed whether we could divide the patients into dcSSc and lcSSc subsets and to study each group separately. Then, in each group, we used group-based trajectory analysis (GBTM) to identify latent SCTC-DI trajectories over 4 years in lcSSc and dcSSc patients with <2 years disease duration. We used the latent trajectories as a method to divide patients into the two types of trajectories, ‘good’ and ‘bad’, to allow us to develop the prediction models. We decided a priori that we would combine latent trajectories if necessary, such that for each model we would have only two trajectories.
As the purpose of this project was to develop models to predict the real, not latent, trajectories in patients, we next examined how well real trajectories were predicted by this model both in the derivation and validation cohorts.
Source population
Derivation cohort
The Canadian Scleroderma Research Group (CSRG) registry is an ongoing longitudinal study of adult SSc patients recruited by rheumatologists from 14 sites across Canada and one in Mexico. All sites have the approval of their institutional review boards and patients provide written consent. Data is collected at yearly visits using a standardized data collection protocol which includes clinical (both patient and physician reported) and laboratory data and is recorded in a customized database. The Australian Scleroderma Cohort Study (ASCS) is also an ongoing longitudinal study of SSc patients recruited from 12 centres across Australia and started in 2007. Their data collection protocols are comparable to the CSRG. Combined, the CSRG and ASCS registries comprise >3000 patients. In this study, we included incident SSc cases (disease duration <2 years) who met 2013 ACR-EULAR SSc classification criteria [7]. To be able to determine trajectories, only patients with at least two cohort visits and two SCTC-DI scores were included. The study was approved by the ethics committee at the Jewish General Hospital in Montreal, Canada.
Validation cohort
For validation, patients from the Leiden Combined Care in SSc (CCISS) cohort were used [8]. This observational cohort study comprises annual follow-up of all consecutive patients with SSc followed at the Leiden University Medical Center (LUMC). Patient data are collected annually following standardized procedures. For the current study, all patients who provided informed consent for sharing of anonymized data with other research groups and who met 2013 ACR-EULAR SSc classification criteria and with disease duration <2 years were included.
Scleroderma Clinical Trials Consortium – Damage Index (SCTC-DI)
The SCTC-DI measures global irreversible damage in SSc patients and was developed to be highly correlated with mortality and morbidity (measured by Short Form-36) [2]. Validated and published in 2019, its development was an international collaboration between 22 experts with input from patient partners using a combined approach of consensus and data driven methods. The index is composed of 23 differently weighted items in several organ systems (musculoskeletal, skin, vascular, gastrointestinal, respiratory, cardiovascular and renal). Low, medium and high SCTC-DI scores are defined as <5, 6–12 and ≥13 respectively, with a maximum score of 55. For the definition of the individual components of the SCTC-DI, please refer to the original paper [2].
In this study, the SCTC-DI was calculated using registry data, but three items (calcinosis complicated by infection or requiring surgery, GAVE and right ventricular dysfunction) were removed as they were not collected in the CSRG database, and one item (small joint contractures) was removed due to missing data (>20% of visits). The maximum SCTC-DI score possible was therefore 42.
Clinical variables
The patients’ baseline visit for this study was their first registry visit with a calculable SCTC-DI score which had to be within 2 years of the onset of the first non-Raynaud’s phenomenon. Other baseline variables were extracted from the databases. Demographic and lifestyle information (age, sex, ethnicity, postsecondary education, employment, smoking and environmental exposures) were obtained by patient self-reporting. Environment exposure was self-defined as exposure to silica, organic solvents, vinyl chloride and epoxy resins. SSc subtype (diffuse or limited), disease duration (years from first non-Raynaud’s manifestation), tendon friction rubs (TFR), synovitis, nailfold capillaroscopy abnormalities, and comorbidities (diabetes, atherosclerosis and non SSc-related lung disease) were determined by study physicians. Nailfold capillary abnormalities were defined as the presence of any abnormality (giant capillaries, dilated capillaries, capillary dropouts). They were assessed using the DermLite dermatoscope, a well validated clinical tool for nailfold capillaroscopic assessment [9]. Finally, baseline inflammatory markers (ESR, CRP) and autoantibodies were recorded.
Serology
Autoantibody serologies for CSRG cohort patients were analysed in a central laboratory at the University of Calgary. Samples were aliquoted and stored at −80°C until needed. Anti-centromere (ACA) (CENP-A and CENP-B), anti-topoisomerase I antibodies (ATA) and anti-RNA polymerase III (ARNAP) (RP11 and RP155) were assessed using Euroline SSC profile line immunoassay (Euroimmun, Luebeck, Germany) according to the manufacturer’s instructions. Autoantibodies for ASCS patients were conducted at local laboratories using local assays and protocols.
Statistical analysis
We first plotted the actual DI trajectories of lcSSc and dcSSc to determine whether they were distinct. We then performed GBTM to identify SCTC-DI trajectories over 4 years in lcSSc and dcSSc [10]. This approach applies a multinomial modelling strategy to identify homogeneous clusters of developmental trajectories within a sample population. In the modeling process, we considered 2,3,4,5 clusters in GBTM and chose three clusters for diffuse patients and two clusters for limited patients based on the BIC. When there are >2 groups, the membership is mutually exclusive, and they follow a multinomial distribution as a component of the likelihood function in the GBTM.
We determined the most appropriate numbers of trajectory groups by comparing Bayesian Information Criteria. We required that trajectory groups each include at least 10% of study participants, allowing the secular patterns of SCTC-DI to be summarized in a parsimonious and meaningful fashion. The final model was evaluated using both Bayesian Information Criterion (BIC) values and the average posterior probability of assignment (≥0.70). GBTM can handle missing data by using maximum likelihood estimates, assuming that the data is missing at random (i.e. unrelated to the measured outcome). Because we believe this to be the case in the present study, it was not necessary to perform multiple imputation [11].
We compared the baseline characteristics according to SCTC-DI trajectory groups using variance analysis or Kruskal–Wallis test for continuous variables and χ2 test or Fisher’s exact test for categorical variables. We examined the relation of baseline socio-demographic and clinical variables to the SCTC-DI trajectory groups using multinominal logistic regression models. Variables were selected for the model based on our clinical knowledge and statistical significance (P <0.1 in univariate analysis). Variables such as SSc interstitial lung disease which are included in the SCTC-DI were not included as baseline covariates/predictors. In the multivariable regression model, we adjusted for potential confounders based on our clinical knowledge and as guided by causal diagrams [12].
We then created a probability relationship between the significant predictors and the outcome, i.e. ‘good’ or ‘bad’ trajectories, developed ROC curves for values of the probability and selected the best probability cut-off, balancing sensitivity and specificity.
A result was considered statistically significant if P <0.05 in all our analyses.
Results
Sample population
Derivation cohort
Of 664 incident SSc patients in the CSRG and ASIG who met 2013 ACR/EULAR classification criteria, we excluded 262 patients who either had only a baseline visit (n = 123), had fewer than two SCTC-DI values (n = 99) or had their first calculable SCTC-DI after 2 years of disease onset (n = 32) or if their cutaneous subset data were missing. Of the remaining 402 patients (211 from ASCS and 191 from CSRG), the mean age was 53.7 years (s.d. 12.8), 19.7% were men, 85.1% were Caucasian and 47.8% had diffuse disease (Table 1). The patient characteristics from each database were similar, though the CSRG had fewer Caucasian patients (81.0% vs 88.8%), slightly longer disease duration (1.2 vs 1.0 years) and more diffuse cutaneous patients (53.9% vs 42.2%).
Baseline characteristics of the derivation and validation cohorts
| Derivation cohort (n = 402) | Validation cohort (n = 184) | |||
|---|---|---|---|---|
| lcSSc (n = 210) | dcSSc (n = 192) | lcSSc (n = 146) | dcSSc (n = 38) | |
| Age, mean (s.d.) | 56.0 (13.1) | 51.2 (12.0) | 52.3 (13.6) | 55.5 (13.2) |
| Male, n (%) | 29 (13.8%) | 50 (26.0%) | 22 (15.1%) | 17 (44.7%) |
| Caucasian, n (%) | 176 (86.7%) | 160 (83.3%) | 126 (86.3%) | 32 (84.2%) |
| Ever smoking, n (%) | 110 (52.4%) | 110 (57.6%) | 79 (54.1%) | 19 (50.0%) |
| Disease duration since onset of NR, mean (s.d.) | 1.1 (0.5) | 1.1 (0.5) | 0.4 (0.5) | 0.3 (0.5) |
| Antibodies, n (%) | ||||
| ACA | 99 (49.0%) | 11 (6.3%) | 78 (53.4%) | 0 |
| ATA | 36 (17.7%) | 48 (27.9%) | 31 (21.2%) | 18 (47.4%) |
| ARNAP | 15 (7.9%) | 71 (44.1%) | 4 (3.5%) | 4 (11.8%) |
| CRP, median [IQR] | 4 [1.6, 6.6] | 5 [2.8, 11.4] | 1.3 [0, 4.7] | 7 [0, 17] |
| ESR, median [IQR] | 14 [7, 28] | 16 [8, 33] | 14 [6, 25] | 19 [9, 38] |
| Tendon friction rubs, n (%) | 7 (3.4%) | 52 (27.1%) | 4 (2.8%) | 15 (40.5%) |
| Synovitis, n (%) | 64 (31.2%) | 63 (33.9%) | 16 (11.0%) | 9 (23.7%) |
| Nailfold capillaroscopy abnormalities, n (%) | 148 (71.2%) | 153 (80.5%) | 100 (76.9%) | 22 (73.3%) |
| Other comorbidities, n (%) | ||||
| Diabetes | 20 (9.6%) | 9 (4.7%) | 4 (2.7%) | 2 (5.3%) |
| Atherosclerotic disease | 16 (7.7%) | 10 (5.2%) | 15 (10.3%) | 5 (13.2%) |
| non SSc lung disease | 31 (14.8%) | 20 (10.4%) | 14 (9.6%) | 5 (13.2%) |
| Damage score at baseline | 3.2 (2.8) | 4.8 (3.5) | 4.1 (2.7) | 4.4 (2.5) |
ACA: anticentromere; ARNAP: anti RNA polymerase III; ATA: anti topoisomerase; NR: non-Raynaud’s.
Validation cohort
The validation cohort included 184 subjects: 146 (79%) lcSSc and 38 (21%) dcSSc. A higher proportion of the dcSSc were males (44.7% vs 26%) and the patients had a shorter disease duration than the derivation cohort. Fewer of the dcSSc cases had RNAP antibodies.
The actual DI trajectories of lcSSc vs dcSSc in the derivation cohort are shown in Fig. 1. We calculated the mean and standard errors of DI using observed values at each visit. The dcSSc subjects had already accumulated more damage at baseline and the slope of damage accumulation in the following years is also steeper. Because these curves were so different, we used GBTM on each cutaneous subset separately as it would be simple to assign a subject to either group and increase the accuracy of any prediction.
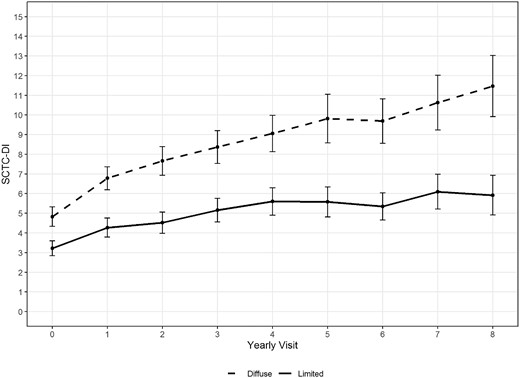
Actual Damage Index trajectories for both diffuse and limited patients: mean with 1.96*Standard Error
The damage index trajectories by GBTM are seen in Fig. 2. Because there were three trajectories for dcSSc (Fig. 2B) and Trajectory 1 stood out as the ‘better’ trajectory, we combined patients from trajectories 2 and 3 for further analyses to determine a prediction model for ‘good’ vs ‘bad’ trajectories. The average posterior probability of group membership assigned to each group were 0.97 for lcSSc and 0.94 for dcSSc, suggesting an excellent model adequacy.
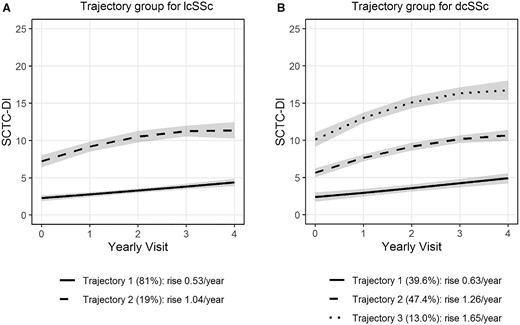
Trajectory Group Based Models. (A) lcSSC patients; (B) dcSSC patients
We compared the models with up to five clusters using the largest BIC. The best models for diffuse and limited patients have three clusters (BIC = −1770.93) and two clusters (BIC = −1752.82), respectively. The BIC values from models with one cluster only are −2027.15 and −1914.49, respectively.
For lcSSc, the smooth function of the trajectories were linear for trajectory 1 and quadratic for trajectory 2. For dcSSc patients, the smooth function of the trajectories were linear for trajectory 1 and quadratic for trajectories 2 and 3.
Slopes were calculated based on the estimated means from the model. Slope of each trajectory = (estimated mean SCTC DI at v4–estimated mean SCTC DI at v0)/4. Table 2 shows the baseline characteristics of patients by cutaneous subset and trajectory. Univariate associations with worse trajectories for dcSSc were older age, male, higher CRP and ESR, TFR, lung disease and higher DI at baseline. There was a tend towards Caucasian being protective. For lcSSc, associations with worse trajectories included older age, ESR and baseline DI only.
Baseline characteristics and mortality of patients by cutaneous subset and latent trajectory as determined by group-based trajectory modelling
| lcSSc (n = 210) | dcSSc (n = 192) | |||||
|---|---|---|---|---|---|---|
| Trajectory 1 (n = 170) | Trajectory 2 (n = 40) | P values | Trajectory 1 (n = 76) | Trajectories 2 & 3 combined (n = 116) | P values | |
| Death | 14 (8.2%) | 14 (29.2%) | <0.001 | 5 (6.6%) | 20 (17.2%) | 0.032 |
| Age, mean (s.d.) | 55.0 (12.8) | 59.9 (13.6) | 0.033 | 48.7 (11.9) | 52.8 (11.9) | 0.020 |
| Male, n (%) | 23 (13.5%) | 5 (15%) | 0.808 | 14 (18.4%) | 36 (31.0%) | 0.052 |
| Caucasian, n (%) | 143 (87.2%) | 33 (84.6%) | 0.670 | 67 (88.2%) | 93 (80.2%) | 0.147 |
| Ever smoking, n (%) | 86 (50.6%) | 24 (60%) | 0.284 | 37 (49.3%) | 73 (62.9%) | 0.063 |
| Disease duration since onset of NR, mean (s.d.) | 1.1 (0.5) | 1.0 (0.6) | 0.557 | 1.1 (0.5) | 1.0 (0.5) | 0.301 |
| Antibodies, n (%) | ||||||
| ACA | 79 (48.8%) | 20 (50%) | 0.889 | 7 (10%) | 4 (3.9%) | 0.102 |
| ATA | 32 (19.6%) | 4 (10%) | 0.153 | 19 (27.1%) | 29 (28.4%) | 0.853 |
| ARNAP | 10 (6.7%) | 5 (12.8%) | 0.199 | 32 (48.5%) | 39 (41.1%) | 0.350 |
| CRP, median [IQR] | 3.8 [1.6, 6.2] | 4.9 [2, 11] | 0.079 | 4.0 [2.3,7.6] | 6.1 [3, 14] | 0.007 |
| ESR, median [IQR] | 13 [7, 27] | 21 [10, 39] | 0.027 | 12 [7, 28] | 18 [9, 38] | 0.023 |
| Tendon friction rubs, n (%) | 5 (3.0%) | 2 (5%) | 0.622 | 16 (21.1%) | 36 (31.0%) | 0.128 |
| Synovitis, n (%) | 50 (30.1%) | 14 (35.9%) | 0.484 | 25 (33.8%) | 38 (33.9%) | 0.984 |
| Silica and other environment exposure, n (%) | 21 (13.2%) | 5 (13.2%) | 0.994 | 13 (17.3%) | 18 (15.9%) | 0.800 |
| Nailfold capillaroscopy abnormalities, n (%) | 121 (72.0%) | 27 (67.5%) | 0.570 | 65 (88.5%) | 88 (77.2%) | 0.155 |
| Other comorbidities, n (%) | ||||||
| Diabetes | 15 (8.9%) | 5 (12.5%) | 0.550 | 1 (1.3%) | 8 (6.9%) | 0.150 |
| Atherosclerotic disease | 11 (6.6%) | 5 (12.5%) | 0.200 | 2 (2.6%) | 8 (6.9%) | 0.333 |
| Non-SSC lung disease | 24 (14.2%) | 7 (17.5%) | 0.598 | 3 (4.0%) | 17 (14.7%) | 0.018 |
| Damage score at baseline | 2.3 (1.8) | 7.2 (2.6) | <0.001 | 2.2 (1.7) | 6.6 (3.3) | <0.001 |
ACA: anticentromere; ARNAP: anti RNA polymerase III; ATA: anti topoisomerase; NR: non-Raynaud’s. Bold text highlights significant values.
The full and selected models for the regression analyses are in Supplemental Table S1, available at Rheumatology online. Logistic regression results using all covariates at baseline (full model) and the selected covariates after backward selection (selected model) are shown. For lcSSc patients, only baseline DI remained in the selected model and for dcSSc only baseline DI and male sex.
Probability values for ‘bad’ vs ‘good’ trajectories were calculated and ROC curves created for each subset and for full and selected models (Fig. 3). The AUC were excellent for both the full (AUC = 0.9535) and selected (AUC = 0.9313) models for lcSSc and were similarly excellent for dcSSc full (AUC = 0.9058) and selected (AUC = 0.9027) models.

ROC curves and AUC for full and selected models as predictors of ‘good’ vs ‘bad’ damage index trajectories. Full models used all covariates at baseline and selected models used only damage index at baseline for lcSSc and damage score plus male gender for dcSSc
We used the selected model to develop the probability equation for lcSSc which was probability =1 / (1 + exp(−X)), where X= −6.29 + 1.08 * DI and the optimum cut-off was probability = 0.294 with sensitivity (0.85) and specificity (0.86).
For dcSSc the equation was probability=1 / (1 + exp(−X)), where X = -3.08 + 1.19 * male + 0.82 * DIand the optimum cut-off was probability = 0.637 with sensitivity (0.82) and specificity (0.83).
For lcSSc and dcSSc the Hosmer and Lemeshow Goodness-of-Fit Test P-values were 0.6176 and 0.5618, respectively, which means our prediction models which require only baseline DI and sex for dcSSc and only baseline DI for lcSSc had good prediction accuracy.
We then determined actual values for the baseline DI that predicted good vs bad trajectories (Table 3).
Cut-off values of Damage Index scores above which worse DI trajectories may be expected
| Cut-off DI score | Sensitivity | Specificity | ||
|---|---|---|---|---|
| dcSSc | Male | >4 | 0.82 | 0.83 |
| Female | >5 | |||
| lcSSc | >5 | 0.85 | 0.86 |
| Cut-off DI score | Sensitivity | Specificity | ||
|---|---|---|---|---|
| dcSSc | Male | >4 | 0.82 | 0.83 |
| Female | >5 | |||
| lcSSc | >5 | 0.85 | 0.86 |
DI: damage index at baseline.
Using these cut-offs, we determined which patients in the derivation and validation cohorts were predicted to have ‘good’ or ‘bad’ trajectories and then plotted their actual DI trajectories (Supplementary Fig. S1, available at Rheumatology online). The number of subjects predicted to be ‘bad’ in lcSSc was 57 (39.1%) and 26 (68.4%) in dcSSc.
Those cases predicted to have a worse DI trajectory over time did fulfil that expectation in both derivation and validation cohorts. We also note that the baseline damage scores in the derivation cohort are very similar in the ‘good’ lcSSc and dcSSc subjects, i.e. scores of 1.9 and 2.0, respectively, and in ‘bad’ lcSSc and dcSSc subjects, i.e. scores of 6.8 and 7.4, respectively. As well, the scores at 4 years in ‘good’ lcSSc are still less than baseline scores in ‘bad’ lcSSc, 4.2 and 6.8, respectively, as they are in dcSSc at 5.9 and 7.4, respectively (Supplementary Fig. S1, available at Rheumatology online).
The actual trajectories in the validation cohort (Supplementary Fig. S1C and D, available at Rheumatology online) appear very similar to those in the derivation cohort (Supplementary Fig. S1A and B, available at Rheumatology online). The AUC of the trajectory curves were as follows: for lcSSc, ‘good’ and ‘bad’ AUC were 12.9 and 33.4, respectively, in the derivation cohort and 18.4 and 37.4 in the validation cohort; for dcSSc 18.1 and 40 in the derivation cohort and 18.8 and 43.1 in the validation cohort. The model worked a bit better in the dcSSc cases but overall, these results suggest that the model works well in a different cohort from which it was developed.
Discussion
Our work has shown that damage occurs in SSc very early in the disease in both lcSSc and dcSSc, that on average all patients accrue more damage over the first 4 years, and that assessing the cutaneous subset, the SCTC DI within the first 2 years of disease and the sex of the patient will allow assignment of a subject to a ‘good’ vs ‘bad’ damage trajectory. ‘Good’ trajectory subjects will continue to have lower damage scores than ‘bad’ trajectory ones, no matter what subset. Indeed, by four years of follow-up the mean DI in the predicted ‘good’ trajectory subjects was lower than the baseline DI in the ‘bad’ trajectory subjects in all analyses. In addition, there is a suggestion from the validation cohort that the damage accrual rates may be higher in dcSSc cases. Unfortunately, the numbers in the latter years of follow-up were very low in that cohort so the significance is uncertain. Another possible contributor to the difference in the slope of the curves is that the dcSSc cases in the validation cohort differed somewhat from the derivation cohort, e.g. fewer RNAP cases, more males and shorter disease duration.
There are several reasons to predict which patients are more likely to accrue significant damage over time. First there is the possibility that therapy may be able to prevent global damage accrual. Selecting patients who are likely to have a worse course may improve the study design of trials of such therapies. Also, as we have shown that in subjects with the more severe damage trajectories the hazard ratio for death was always higher in the ‘bad’ damage group, damage accrual prevention studies would be especially important in those predicted to be in a ‘bad’ damage trajectory. Current drug trials in SSc have been using the Composite Response Index in Diffuse Cutaneous SSc (CRISS) as an outcome measure [13]. We have already shown that in a multinational cohort of dcSSc patients with ≤5 year disease duration, CRISS improvers over 1 year were less likely to accumulate damage on the SCTC-DI adjusting for age, sex, disease duration and immunosuppression use, and also had a trend towards better survival [14]. So it is possible that successful drug trials could demonstrate similar results.
From the clinician’s point of view, it would be similarly important to be able to pay special attention to those most likely to suffer from the effects of severe damage over time. As it is also interesting that ‘bad’ and ‘good’ lcSSc and dcSSc subjects have very similar trajectories over 4 years, and although only 39.1% of lcSSc subjects fall into the ‘bad’ category whereas 68.4% of dcSSc do, the clinician should be aware that lcSSc patients can also fall into a ‘bad’ group.
Our study is not without limitations. Most of our cohort was Caucasian, our trajectories may not be generalizable to other ethnicities. There were missing data and losses to follow up, which is unfortunately inherent to registry studies. We limited the study to 4 years follow-up because we have found that the numbers of subjects drops off after that [6]. Four items were removed from the SCTC-DI due to missing data (>20%). Despite these missing items, the intent of the SCTC-DI was likely still captured, given the excellent fit of our models. The trajectories we have identified describe the evolution of SSc patients receiving standard of care at tertiary centres rather than the natural evolution of the disease. In addition, the influence of treatment on damage accrual was not assessed and would be an important topic of future study. Treatment protocols likely differ between country of recruitment (Australia vs North America vs the Netherlands), as well as between recently vs remotely enrolled patients. We also found some possibly important differences between the derivation and validation cohorts. Despite these differences, we were still able to show good validation of our model and this can be considered a strength of the study.
We defined trajectory groups separately for limited and diffuse patients. This may have limited our analyses because it decreased the sample sizes for each analysis. However, we first showed that the real-world trajectories of the DI were very different in lcSSc and dcSSc. As we wished to develop a model that would be easy for clinicians to use, and as it is easy for clinicians to assign patients to either lcSSc or dcSSc, we decided to develop models in each subset independently. Although this did reduce the size of the sample for each analysis, it meant that one important variable (i.e. subset) did not have to be considered in the prediction model. We feel that this strengthened the model rather than weaken it.
Other strengths of this project include the relatively large number of cases with early disease that were studied and the uniqueness of predicting damage accrual using a newly developed DI.
In conclusion, we have a developed a very simple model using only baseline DI, cutaneous subset and sex to predict damage accrual in SSc. Over a period of 4 years, the mean values in our ‘good’ trajectory group remain below the baseline values in the ‘bad’ trajectory group at baseline. Once patients are placed in ‘good’ or ‘bad’ projected trajectories, the DI rate of accrual over 4 years is very similar in ‘good’ and ‘bad’ lcSSc patients and in ‘good’ and ‘bad’ dcSSc patients.
Supplementary material
Supplementary material is available at Rheumatology online.
Data availability
To protect the privacy of individuals that participated in the study, the data underlying this article cannot be shared publicly. The data will be shared on reasonable request to the corresponding author.
Funding
The Canadian Scleroderma Research Group (CSRG) is funded by the Canadian Institutes of Health Research (CIHR), Scleroderma Canada, the Scleroderma Society of Ontario, the Scleroderma Association of Saskatchewan, Scleroderma Manitoba, the Scleroderma Society of Nova Scotia, the Scleroderma Association of British Columbia, the Cure Scleroderma Foundation, the Canadian Blood and Marrow Transplant Group, and the Lady Davis Institute of Medical Research of the Jewish General Hospital, Montreal, QC. The CSRG has also received educational grants from Actelion pharmaceuticals and Mallinckrodt.
Disclosure statement: The authors have declared no conflicts of interest.
Acknowledgements
Members of the Canadian Scleroderma Research Group are: M. Baron (Montreal Quebec), G. Gyger (Montreal Quebec), S. Ligier (Montreal, Quebec), J. Pope (London, Ontario), M. Larché (Hamilton, Ontario), N. Khalidi (Hamilton, Ontario), A. Massetto (Sherbrooke, Quebec), E. Sutton (Halifax, Nova Scotia), A. Man (Winnipeg, Manitoba), T. S. Rodriguez-Reyna (Mexico City, Mexico), C. Thorne (Newmarket, Ontario), P.R. Fortin (Quebec, Quebec), A. Ikic (Quebec, Quebec), D. Robinson (Winnipeg, Manitoba), M. Osman (Edmonton, Alberta), N. Jones (Edmonton, Alberta), S. LeClercq (Calgary, Alberta), P. Docherty (Moncton, New Brunswick), D. Smith (Ottawa, Ontario), M. Abu-Hakima (Calgary, Alberta), E. Kaminska (Calgary, Alberta) and M. Fritzler (Calgary, Alberta).
Members of the Australian Scleroderma Interest Group are: Mandana Nikpour (Melbourne, Victoria), Susanna Proudman (Adelaide, South Australia), Wendy Stevens (Melbourne, Victoria), Joanne Sahhar (Melbourne, Victoria), Nava Ferdowsi (Melbourne, Victoria), Kathleen Morrisroe (Melbourne, Victoria), Laura Ross (Melbourne, Victoria), Gene-Siew Ngian (Melbourne, Victoria), Jennifer Walker (Adelaide, South Australia), Janet Roddy (Perth, Western Australia), Lauren Host (Perth, Western Australia) and Gabor Major (John Hunter, New South Wales).

Comments