


Abstract
Relapsing polychondritis (RP) is a rare, heterogeneous, systemic inflammatory disease that targets cartilage. Patient-reported outcome measures may differ from physician assessment. This study compared patient global assessment (PtGA) and physician global assessment (PhGA) scores in a prospective cohort of patients with RP.
Adult patients with RP underwent a standardized comprehensive evaluation at ∼6 month intervals. At each visit, three physicians scored PhGA by consensus. The patient independently completed four patient-reported outcomes: PtGA, 36-item Short Form Health Survey (SF-36), Brief Illness Perception Questionnaire (BIPQ) and Multidimensional Fatigue Inventory (MFI). Patient–physician discordance was defined as a difference between PtGA and PhGA of ≥3 on a 0–10 scale.
A total of 76 patients were evaluated over 154 visits. The median PhGA was 3 [interquartile range (IQR) 2–3] and the median PtGA was 5 (IQR 4–7). PtGA and PhGA were concordant in 66 visits (42.9%) and patients scored disease severity ≥3 points higher than physicians scored disease activity (positive discordance) in 84 visits (54.5%). Compared with visits with concordance, visits with positive discordance were associated with significantly worse scores on the MFI, BIPQ, SF-36 physical component score and SF-36 mental component score.
Patients with RP typically self-report high PtGA that does not align with PhGA. Discordance is likely driven by the high physical and psychological burden of illness experienced by patients. Multifaceted treatment approaches that address the burden of disease in RP from the patient perspective are needed.
Patients with relapsing polychondritis (RP) often self-report high disease severity incongruent with physician disease activity assessment.
Clinical features important to patients are not the same as those valued by physicians.
Patient-centred approaches are needed to address pain, fatigue and the emotional impact of RP.
Introduction
Relapsing polychondritis (RP) is a rare, systemic, chronic, disabling condition that primarily affects cartilage [1]. RP can involve multiple organs, including the musculoskeletal system, airway, ear, nose, eyes, skin, vasculature and neurological system, resulting in a high disease burden [2]. Patient-reported outcome measures (PROMs) demonstrate how disease manifestations affect patients and provide unique insight about the impact of a disease [3–5]. PROMs enable a holistic assessment of disease status beyond focussed assessment of active inflammation or damage. The patient global assessment (PtGA) is a summary measure of the patient’s perception of disease severity at a point in time and is a global measure that encompasses many aspects of disease that are important to patients [6]. In contrast, the physician global assessment (PhGA) is a summary measure of the physician’s impression of disease activity at a point in time. The PhGA can be a reliable measure to quantify disease activity and monitor treatment response in RP [7].
The patient’s and physician’s opinion of disease status may differ, potentially impacting treatment and decision making [8]. Measuring discordance between the PtGA and PhGA can provide insight into these differing perspectives. Given that these measures assess a similar construct, they would be expected to be concordant. However, various degrees of discordance have been observed between physician- and patient-based assessment in rheumatologic diseases [9–11].
Comparison of patient assessment of disease severity and physician assessment of disease activity may better detail the effect an illness has on a patient’s life and the factors that drive the patient’s perspective, especially when there is discordance. Therefore the objective of this study was to compare physician global assessment and patient global assessment in RP.
Methods
Study population
Patients ≥18 years of age who fulfilled existing diagnostic criteria for RP were recruited into a prospective, observational cohort at the National Institutes of Health (NIH) Clinical Center from August 2016 to October 2019 (NCT02257866) [12–14]. Consecutive patients with clinical visits in the time period stated were included. Patients were enrolled at any point in the disease course, with no geographic or demographic restrictions. Patients were evaluated at ∼6 month intervals by an investigative team with expertise in RP. Written informed consent was obtained from all patients. The study was approved by the NIH Institutional Review Board (14-AR-0200).
Data collection
At each visit, patients underwent a standardized comprehensive evaluation that included a clinical rheumatology, audiology and otolaryngology evaluation, laboratory studies and dynamic CT scan of the chest. Clinical signs and symptoms related to common organ manifestations of RP were recorded as either present or absent on the day of the visit or within the past month. Blood was collected on the day of the study visit for laboratory assessments including ESR and CRP. All laboratory testing was performed in the NIH Department of Laboratory Medicine. At each visit, patients filled out four PROMs: patient global assessment (PtGA), 36-item Short Form Health Survey (SF-36), Brief Illness Perception Questionnaire (BIPQ) and Multidimensional Fatigue Inventory (MFI). Visits in which patients did not complete the PtGA form were excluded.
PtGA and PhGA
For the PtGA, patients were asked ‘please mark to indicate how severe your vasculitis [RP] disease is today’ on a horizontal numeric rating scale of 0–10, with higher scores indicating more severe disease. The patients were not provided a definition of severity in the question. From the data collected at each patient visit, de-identified clinical vignettes were created that summarized current symptoms, physical examination findings, laboratory results, imaging findings and other diagnostics (e.g. audiogram) at each visit. Using these clinical vignettes derived from patient data, three practicing rheumatologists from the evaluating institution (M.F., K.Q. and P.G.) with expertise caring for patients with RP scored the PhGAs for each study visit blinded to each other. Physicians were asked to score disease activity on a scale of 0 (no clinical activity, remission) to 10 (maximum disease activity). Raters were instructed to consider only symptoms directly attributable to disease activity rather than damage. The consensus PhGA was assigned based on averaging the three raters and rounding to the nearest whole number as described previously [7].
Discordance
The difference between the PtGA and PhGA was analysed as a continuous variable (PtGA-PhGA). Discordance was defined as a difference ≥3, consistent with prior studies [10, 15]. Patient visits were classified as positive discordance (PtGA-PhGA ≥3), negative discordance (PtGA-PhGA ≤−3) or concordance (|PtGA-PhGA| <3) [15].
MFI
Fatigue was measured using the four-item general fatigue scale of the MFI. For the general fatigue scale, patients respond to the following four statements on a 0–5 scale: ‘I feel fit’, ‘I feel tired’, ‘I am rested’ and ‘I tire easily’. A higher score corresponds to more fatigue and the total possible composite general fatigue scores ranged from 4 to 20 [16].
BIPQ
Illness perceptions were assessed using the BIPQ, which is a shortened version of the revised Illness Perception Questionnaire [17]. The BIPQ measures patient’s cognitive and emotional representations of their illness across the following domains, each scored on a 0–10 scale: consequences, timeline, personal control, treatment control, identity, concern, understanding and emotional response [17]. A composite score of 0–80 was computed, with a higher score corresponding to more negative illness perception [17].
SF-36
Health-related quality of life (HRQOL) was assessed using the SF-36 version 2 and was scored according to the standard scoring guidelines [18]. Physical and mental component summary (PCS and MCS, respectively) scores were calculated as well as health factor scores (role physical, role emotional, energy/fatigue, pain, mental health, general health, physical functioning and social functioning). In contrast to other measures, lower scores of the SF-36 MCS and PCS reflect worse health. To account for this, reverse scores of the SF-36 MCS and PCS were calculated by subtracting the MCS and PCS scores from 100, the maximum score.
Treatment
Response to treatment was analysed in all patients who had at least two study visits. A detailed history of immunosuppressive therapy, including use of glucocorticoids, synthetic and targeted synthetic DMARDS or biologic DMARDS was recorded at each visit. Treatment decisions were made and implemented by the referring physicians rather than the investigative team. Treatment change between consecutive visits was categorized as increased, decreased or unchanged. Increased treatment was defined as a daily prednisone dose increase of >5 mg or the addition/50% dose increase of DMARD therapy at the time of the follow-up visit relative to the previous visit. Decreased treatment was defined as a daily prednisone dose decrease of >5 mg or the removal/50% dose reduction of DMARD therapy at the time of the follow-up visit relative to the previous visit. All other visit intervals were classified as no change [7, 19].
Statistical analysis
Demographic and clinical variables were expressed as median and range or frequencies, according to the data type and distribution. Spearman’s rank correlation analysis (rs) was used to evaluate the strength of the association between PhGA, PtGA and PtGA-PhGA and continuous variables and to compare changes in PhGA, PtGA and PtGA-PhGA with changes in other variables. Visit characteristics were compared between the positive discordant group and the concordant group using Mann–Whitney or Fisher’s exact test. Wilcoxon signed rank was used to compare PtGA or PhGA between consecutive visits and changes in PhGA, PtGA and CRP in association with treatment status.
All statistical analysis was performed using JMP 14 (SAS Institute, Cary, NC, USA), PRISM 8 (GraphPad Software, San Diego, CA, USA) or RStudio 1.2.5001 (RStudio, Boston, MA, USA). P-values <0.05 were considered significant. All data are incorporated into the article and its Supplementary Material, available at Rheumatology online.
Results
Demographic and clinical characteristics
A total of 154 visits from 76 patients were analysed. Forty-two patients had at least one follow-up visit. Demographics and patient characteristics are summarized in Table 1. Patients were primarily female (82.9%) with a median age of 46 years [interquartile range (IQR) 36–55] (Table 1). At the baseline visit, 57.9% of patients were receiving a synthetic or targeted synthetic DMARD and 25% were on a biologic DMARD (see Supplementary Table S1, available at Rheumatology online). The median daily prednisone dose was 5 mg (IQR 0–20) (Table 1).
Demographic and clinical characteristics of 76 patients with relapsing polychondritis over 154 visits with PtGA-PhGA discordance status
| Characteristics | Baseline (n = 76) | All visits (n = 154) | Concordant (n = 66) | Positive discordance (n = 84) | Negative discordance (n = 4) | P-value concordant vs positive discordance |
|---|---|---|---|---|---|---|
| Age, years | 46 (36–55) | 47 (39–55) | 46 (36–55) | 50 (40–56) | 49 (43–58) | 0.09 |
| Female, n (%) | 63 (83) | 124 (81) | 55 (83) | 66 (78) | 3 (75) | 0.53 |
| Prednisone dose, mg | 5 (0–20) | 7.5 (0–20) | 5 (0–14.8) | 10 (0.25–20) | 10 (0–25) | 0.57 |
| CRP, mg/l | 2.2 (0.7–7) | 1.6 (0.4–5.6) | 1.4 (0.4–5.7) | 1.7 (0.4–4.6) | 12.5 (0.6–25.8) | 0.37 |
| PhGA | 3 (2–4) | 3 (2–3) | 3 (2–4) | 2 (2–3) | 3.5 (3–6.3) | 0.02 |
| PtGA | 6 (4–7) | 5 (4–7) | 4 (3–5) | 7 (6–7.8) | 0.5 (0–3.3) | <0.001 |
| MFI | 18 (15–20) | 18 (15–19) | 16 (13.3–19) | 18 (16–20) | 11 (7.3–18.5) | 0.002 |
| BIPQ | 64 (57–72) | 62 (55–69.5) | 58 (50–69) | 64 (59–70) | 43.5 (22.5–60) | 0.006 |
| SF-36 PCSa | 28.5 (19.5–33.4) | 27.8 (20–34.5) | 32.7 (25.7–38.9) | 23.8 (17.9–31.7) | 42.3 (23.6–53.9) | <0.001 |
| SF-36 MCSb | 45.6 (35.3–53.6) | 46.4 (36.2–54.3) | 49.8 (37.2–55.5) | 44.7 (35.4–49.7) | 58 (52.4–50.4) | 0.04 |
Values are presented as median (IQR) unless stated otherwise.
positive discordance: PtGA − PhGA ≥3; concordance: PtGA − PhGA <3; negative discordance: PtGA – PhGA ≤−3. aPCS: lower scores indicate worse physical functional status. bMCS: lower scores indicate worse mental health status.
Concordance between PtGA and PhGA
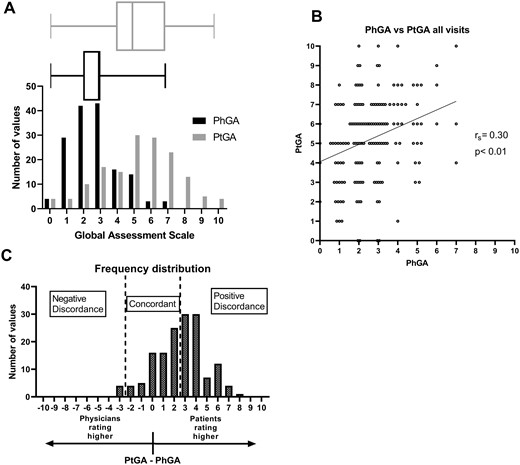
The median PhGA score for all visits was 3 (IQR 2–3) and the median PtGA score was 5 (IQR 4–7) (Fig. 1A). The correlation between the scales for all visits was rs = 0.30 (P < 0.001) (Fig. 1B). PtGA scores were greater than PhGA scores, with a median difference of 3 (IQR 1–4) (P < 0.001). PtGA and PhGA scores were concordant with an absolute difference of ≤2 in 66 visits (42.9%). In 84 visits (54.5%), PtGA was ≥3 points higher than PhGA, whereas in only 4 visits (2.6%) was PtGA ≥3 points less than PhGA (Table 1; Fig. 1C).
Discordance in PhGA and PtGA scores
(A) Histogram and box-and-whisker plot showing the distribution of PhGA scores (black) and PtGA scores (grey) for 154 visits from 76 patients. (B) Scatter plot showing the correlation of PhGA and PtGA scores. (C) Histogram showing the difference PtGA − PhGA with categories of concordance and discordance marked.
Factors associated with patient–physician discordance
In visits with positive discordance, patients reported worse MFI, BIPQ, SF-36 MCS and SF-36 PCS scores compared with concordant visits. There were no differences in treatment, acute phase reactants or clinical signs or symptoms of active disease between the positively discordant and concordant visits (Table 1, Supplementary Table S1, available at Rheumatology online). The prevalence of symptoms related to chondritis in the joints, nose, ears, chest wall or respiratory tract was not different in concordant visits compared with visits with positive discordance (Supplementary Table S1, available at Rheumatology online).
Worse scores on seven of the SF-36 scores (role physical, role emotional, energy/fatigue, pain, general health, physical functioning and social functioning) were seen at visits with positive discordance compared with concordant visits. At visits with positive discordance, patients reported worse (higher) scores on components of the BIPQ assessing the effect of the illness on the patient’s life, the number of symptoms identified with disease and the overall concern about the illness. There were no differences in the other BIPQ components, including the perceived illness timeline, personal control on the illness, perceived benefit of treatment, degree of understanding about the illness and the emotional impact of disease (Supplementary Table S1, available at Rheumatology online).
Correlation of PhGA and PtGA with other outcomes
To further understand factors associated with discordance, the correlation of outcome measures with PtGA-PhGA was assessed. PtGA-PhGA was weakly positively correlated for the MFI (rs = 0.29, P < 0.001) and BIPQ (rs = 0.32, P < 0.001). PtGA-PhGA also weakly positively correlated with the reverse score of SF-36 PCS (rs = 0.37, P < 0.001) and SF-36 MCS (rs = 0.26, P = 0.001), suggesting that worse physical and mental health are associated with more discordance. There were also significant positive correlations with most of the individual components of the composite scores. There was no correlation between PtGA-PhGA and prednisone dose, ESR or CRP (Table 2, Supplementary Table S2, available at Rheumatology online).
Correlations of outcome measures with PtGA, PhGA and PtGA-PhGA
| Variable | PtGA | PhGA | PtGA-PhGA | |||
|---|---|---|---|---|---|---|
| rs | 95% CI | rs | 95% CI | rs | 95% CI | |
| PtGA | 1.00 | 0.30 | 0.15, 0.44 | 0.77 | 0.69, 0.83 | |
| PhGA | 0.30 | 0.15, 0.44 | 1.00 | −0.33 | −0.47, −0.17 | |
| PtGA-PhGA | 0.77 | 0.69, 0.83 | −0.33 | −0.47, −0.17 | 1.00 | |
| ESR (mm/h) | 0.08 | −0.08, 0.24 | 0.14 | −0.02, 0.30 | −0.01 | −0.17, 0.15 |
| CRP (mg/l) | 0.09 | −0.07, 0.25 | 0.28 | 0.12, 0.42 | −0.09 | −0.25, 0.07 |
| Prednisone dose | 0.03 | −0.13, 0.19 | 0.00 | −0.16, 0.16 | 0.05 | −0.12, 0.21 |
| MFI | 0.42 | 0.27, 0.55 | 0.16 | −0.003, 0.32 | 0.29 | 0.13, 0.44 |
| SF-36 MCS reverse score | 0.35 | 0.19, 0.48 | 0.12 | −0.04, 0.28 | 0.26 | 0.10, 0.40 |
| SF-36 PCS reverse score | 0.43 | 0.29, 0.56 | 0.09 | −0.07, 0.25 | 0.37 | 0.23, 0.51 |
| BIPQ total score | 0.41 | 0.26, 0.54 | 0.10 | −0.07, 0.27 | 0.32 | 0.16, 0.46 |
The PhGA positively correlated with MFI (rs = 0.16, P = 0.048), the reverse score of SF-36 energy/fatigue (rs = 0.17, P = 0.03), the reverse score of BIPQ illness control (rs = 0.19, P = 0.02), BIPQ illness symptoms (rs = 0.18, P = 0.03) and CRP (rs = 0.28, P < 0.001). The PhGA did not significantly correlate with the composite measures BIPQ, SF-36 MCS and SF-36 PCS (Table 2, Supplementary Table S2, available at Rheumatology online). The PtGA significantly correlated with almost every PROM but did not correlate with CRP (Table 2, Supplementary Table S2, available at Rheumatology online). Prednisone dose was not correlated with either PtGA or PhGA scores.
Longitudinal change in PtGA vs PhGA
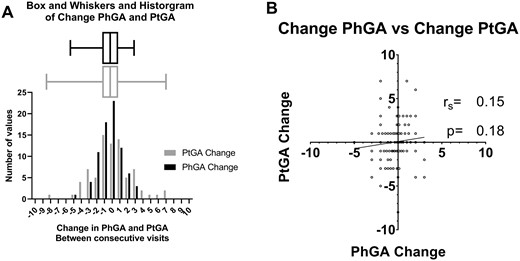
The PtGA change over time was assessed in 42 patients who had 78 follow-up visits after their initial visit when PtGA was first assessed. The median change in PhGA between consecutive visits was 0 (IQR −1–1), and the median (IQR) change in PtGA between consecutive visits was 0 (−1–1). The change in the PtGA score between visits ranged from −8 to 7, whereas the change in the PhGA score ranged from −5 to 3 (Fig. 2A). There was no correlation between the change in PhGA score and the change in PtGA score (rs = 0.15, P = 0.18) (Fig. 2B). There were 18 visit intervals for which there was an increase in PtGA of ≥2 and 18 intervals for which there was a decrease in PtGA of ≥2. The intervals with a decrease in PtGA had a higher median PtGA at the prior visit [7.5 (IQR 6–8) vs 3 (1–4), P < 0.001] but no difference in PhGA at the prior visit [2.5 (IQR 2–3.25) vs 3 (1–3), P = 0.59] (Supplementary Table S3, available at Rheumatology online).
Interval change in PhGA and PtGA scores
(A) Histogram and box-and-whisker plot showing the change in PtGA scores (grey) and PhGA (black) scores between consecutive visits. (B) Scatter plot showing the correlation of change in PhGA and PtGA scores between consecutive visits.
Treatment
Of the 78 follow-up visits from 42 patients, there was an increase in treatment over 49 visit intervals, a decrease in treatment over 13 visit intervals and no change in treatment over 16 visit intervals. There was no significant change in PtGA scores in association with increasing [5 (IQR 3–7) vs 6 (4–7), P = 0.46], decreasing [6 (2–7) vs 5 (3–6), P = 0.69] or not changing [6 (3–7) vs 5 (3–6), P = 0.39] treatment. In contrast, PhGA decreased following increased treatment over the same visit intervals [3 (IQR 2–4) vs 2 (2–3), P = 0.003] (Fig. 3).
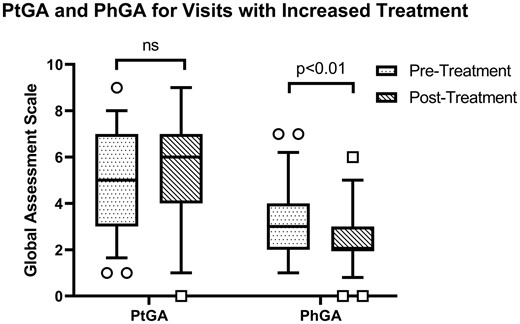
Interval change in PhGA and PtGA scores following increased treatment
Increased treatment improves disease activity from a physician’s perspective [3 (IQR 2–4) vs 2 (2–3), P = 0.0034] but not severity from the patient’s perspective [5 (IQR 3–7) vs 6 (4–7), P = 0.46].
Discussion
This study examined patient and physician assessment in RP. Patients with RP typically self-report high disease severity. Patient assessment of disease severity does not always align with concomitant physician assessment of disease activity. The discordance is driven by the physical and psychological burden of illness experienced by patients. Patients and physicians report dynamic changes in perception of disease severity and activity, respectively, over time. However, patients’ and physicians’ perceptions of change over time are not correlated. Treatment improves disease activity by physician assessment, but increased treatment does not lead to improvement in disease severity by patient assessment. These data highlight the considerable burden of disease experienced by patients, the need to consider patient-reported outcomes in RP and the need to develop therapeutic approaches that address the physical and psychological burden of disease.
Discordance between patient and physician assessment is common in rheumatology, but the discordance is more pronounced for RP than other rheumatologic diseases. For example, 43% of visits have been reported as discordant between patient and physician assessment for patients with RA and 29% of visits for patients with PsA [15, 20]. Strikingly, in this study of patients with RP, PtGA and PhGA were discordant at 57% of all study visits. The higher percentage of discordant visits in RP compared with other rheumatologic diseases likely reflects the many challenges that face patients with RP, including long diagnostic delays with accrual of irreversible cartilage damage, high rates of disability related to musculoskeletal and airway disease, a lack of established evidence-based treatment guidelines, dependence on glucocorticoids for disease control and side effects of medications [21]. In cases of discordance, patients who reported higher disease severity also reported a higher burden of fatigue, negative illness perceptions and worse physical and mental health.
Clinical features that are important to patients with RP are not the same as those valued by physicians. Patient perception of disease severity was associated with self-reported measures of fatigue, pain and general health. In contrast, physician-based ratings of disease activity aligned with objective laboratory data such as acute phase reactants and was not strongly linked to patient-reported outcome data. The discrepancy between clinical features valued by patients and physicians has been found in other chronic diseases. In patients with vasculitis, for example, fatigue was rated by patients as the most important burden of disease, whereas manifestations such as dialysis, seizures and oxygen dependency were ranked significantly lower [22]. In patients with RA, pain and general health perceptions were independent predictors of patient assessment but not physician assessment, whereas swollen joint count and ESR were independent predictors of physician but not patient assessment [23]. Physical limitations and psychological factors likely influence patient perception of disease severity in RP, while directly measurable biological variables drive physician assessment. A solely biomedical approach to assessment may be insufficient for a substantial portion of patients with RP.
Importantly, while physicians believed disease activity was reduced in response to treatment, many patients with RP did not perceive similar improvement in disease severity. In other rheumatologic diseases, changes in patients’ and physicians’ assessments after treatment may be better aligned. A cohort study that evaluated the relationship between changes in fatigue, pain, PtGA and PhGA in patients with RA after initiating or switching biologic treatment found a significant improvement in all disease measures. Change in PtGA was moderately correlated with the change in PhGA [24]. In a pilot study on etanercept in dermatomyositis, both PhGA and PtGA significantly improved after 6 months of treatment, and patients treated with etanercept who successfully weaned off prednisone showed an improvement in both PhGA and PtGA by more than 50% [25]. In contrast, in an observational study of patients with diffuse cutaneous systemic sclerosis, patients who were treated with immunosuppressants were more likely to show improvement in PtGA at the 1 year follow-up; however, concomitant PhGA did not corroborate improvement [26]. A longitudinal observational study of patients with spondylarthritis found that patients with high baseline discordance between PtGA and PhGA had lower rates of remission after initiating TNF inhibitors [27]. Concordant improvement in both PtGA and PhGA likely reflects clear efficacy of a treatment and demonstrates the value of disease assessment from both the physician and patient perspective.
The lack of significant change in patient assessment in response to treatment in RP demonstrates that current treatment approaches for RP may not target the underlying factors that influence patient perception of disease severity. A lack of patient-perceived improvement may be driven by medication side effects or by irreversible damage and the psychological impact due to disability. In cases of discordance, where the physician perceived improvement in disease activity while the patient reported worsening disease severity in response to treatment, patient-reported measures about the emotional psychological burden of disease correspondingly worsened. This further supports the contribution of psychological factors to patient assessment and the need to address these factors when caring for patients with RP. The differences in physician and patient assessment in response to treatment underscore the importance of including patient-reported outcomes as separate outcome measures in future randomized controlled trials in RP.
Additional factors not assessed in this study have been shown to affect PROMs in other diseases. This study did not look at health literacy or the patient’s understanding of the meaning of PtGA, which could impact patient perception [28, 29]. While the physician raters were strict in which elements of the patients’ disease presentation they considered activity, the elements that patients considered when scoring PtGA were not strict, and severity was not defined for the patients. This study also did not compare damage symptoms, medication side effects or underlying comorbidities, which could disparately affect physician and patient assessments [30]. These factors may have contributed to the patients’ assessment. Despite these limitations, the study is strengthened by its large sample size for a rare disease and use of systematically prospectively collected data. At the time of rating both patients and physicians were blinded to each other’s assessment scores, thereby enabling unbiased comparisons.
Patient-reported outcomes are necessary to understand the impact of RP on a patient’s life and the factors that drive the patient’s perspective. A better understanding of the differences between patient and physician assessments may enable more effective communication, stronger goal alignment and improved treatment outcomes. To capture the patient’s perspective, future randomized controlled trials in RP should incorporate patient-reported assessments as independent outcome measures [31]. The patient-reported outcomes assessed in this study were generic measures used in a variety of diseases. Future development of disease-specific PROMs in RP is warranted.
Patients with RP report a high psychological burden of disease, exposing a need for patient-centred approaches to address pain, fatigue and the emotional impact of illness. In addition to treatment of underlying inflammation, therapeutic approaches that address the psychological burden of disease are advisable, including interventions that improve physical and mental health [2, 32]. The use of multifaceted treatment approaches that address the physical and psychological burden of disease in RP may lead to greater improvement in a patient’s functional status, quality of life and self-reported disease assessment.
Funding: This study was supported by the Intramural Research Program at the National Institute of Arthritis and Musculoskeletal and Skin Diseases. This research was made possible through the NIH Medical Research Scholars Program, a public–private partnership supported jointly by the NIH and contributions from the Doris Duke Charitable Foundation, Genentech, the American Association for Dental Research, Colgate-Palmolive and other private donors.
Disclosure statement: The authors have no conflicts of interest to disclose.
Supplementary data
Supplementary data are available at Rheumatology online.

Comments