


Abstract
To evaluate the impact of incorporating treatment guidance into reporting of urate test results.
Urate targets for clinically confirmed gout were added to urate results above 0.36 mmol/l requested after September 2014 within NHS Lothian. Scotland-wide data on urate-lowering therapy prescriptions and hospital admissions with gout were analysed between 2009 and 2020. Local data on urate tests were analysed between 2014 and 2015.
Admissions with a primary diagnosis of gout in Lothian reduced modestly following the intervention from 111/year in 2010–2014 to 104/year in 2015–2019, a non-significant difference (P = 0.32). In contrast there was a significant increase in admissions to remaining NHS Scotland health boards (556/year vs 606/year, P < 0.01). For a secondary diagnosis of gout the number of admissions in NHS Lothian reduced significantly (58/year vs 39/year, P < 0.01) contrasting with a significant increase in remaining Scottish health boards (220/year vs 290/year, P < 0.01). The relative rate of admissions to NHS Lothian compared with remaining Scottish boards using a 2009 baseline were significantly reduced for both primary diagnosis of gout (1.06 vs 1.25, P < 0.001) and secondary diagnoses of gout (0.64 compared with 1.4, P < 0.001) after the intervention; however, there was no difference before the intervention. A relative increase in the prescription rates of allopurinol 300 mg tablets and febuxostat 120 mg tablets may have contributed to the improved outcomes seen.
Incorporation of clinical guideline advice into routine reporting of urate results was associated with reduced rates of admission with gout in NHS Lothian, in comparison with other Scottish health boards.
Admissions with a primary diagnosis of gout have risen 2.6% per year across NHS Scotland in the last decade.
Inclusion of guidance on therapeutic targets for urate within routine laboratory reports was associated with reduced rates of admission due to gout.
Introduction
The prevalence of gout is rising and has been estimated recently at 2.5% in the UK [1]. While gout is largely experienced and managed in the community, this increase is reflected in admissions to hospital, which have risen ∼7% year on year in the UK [2]. In patients with established gout the level of serum urate predicts risk of recurrent gout flares [3], and lowering serum urate levels is associated with a reduced frequency of gout flares [4, 5] as well as improved quality of life [6]. Based on these findings guidelines on gout management emphasize the importance of measuring serum urate in patients with established gout to guide dose escalation of urate lowering therapy to achieve target serum urate levels [7]. This treat to target approach has been shown to reduce gout flares, and is achievable in the vast majority of patients with currently available treatments, albeit with the increased level of support available within clinical trials [8, 9]. Unfortunately over the last decade it is clear that for most patients with gout such standards of care are not being met, with only 14% of gout patients in the UK having had their urate levels measured [10] and a majority of patients continuing to suffer flares of disease [1, 10, 11]. In the Arthritis and Musculoskeletal Alliance (ARMA)’s Standards of Care for People with Gout [12], documentation by biochemistry of urate target levels in patients treated for gout is cited as an example of good practice, but we are not aware that this approach has ever been formally evaluated. Within this study we explored the impact of incorporating treatment guidance into the standard reporting of serum urate.
Methods
Intervention
Urate targets for clinically confirmed gout were added to all urate test results requested after September 2014 within NHS Lothian. Before this date a normal range for serum urate of between 0.12 and 0.42 mmol/l was reported for men, and between 0.12 and 0.36 mmol/l for women, with levels above the normal range marked in bold and reported as ‘High’. After this date a comment was added to all results above 0.36 mmol/l stating: ‘In patients with clinically confirmed gout, the target for serum urate levels is <0.36 mmol/l. Please see Gout Management Flowchart on RefHelp.’ RefHelp is an online NHS Lothian resource to guide referrals into secondary care. Following the updated British Society Rheumatology guidelines on gout in 2017, the report was modified to read ‘In clinically confirmed gout the goal of urate lowering therapy is to achieve target urate of 0.36 mmol/l (or below) in all patients. In newly diagnosed patients, and in patients with tophi, guidelines recommend aiming for target urate of 0.3 mmol/l (or below)’, which was then added to all results above 0.3 mmol/l.
Data
Data on the number of hospital admissions for gout (M10, coded as main condition) in NHS Lothian and across NHS Scotland between the first quarter of 2009 and the second quarter of 2020 were obtained by Public Health Scotland. We also analysed the five most common causes of admission to be complicated by gout flare to identify cases in which gout was a secondary cause of admission. For this analysis the primary diagnosis was either infection [Pneumonia (J18) in 27.6%, cellulitis (L03) in 23.6% and urinary tract infection (N39) in 14.7%] or cardiac dysfunction [heart failure (I50) in 21.9% and chest pain (R07) in 12.2%]. Public Health Scotland also provided data on the number of prescriptions, and dosing in mg of allopurinol and febuxostat for the years 2009–2020 by quarter but excluding data on private prescriptions, and hospital or directly supplied prescriptions. Scottish Morbidity Record coding for inpatient and day case attendances are ∼99% complete in NHS Scotland up to June 2020; however, completeness may vary between NHS boards. Data from NHS Fife was excluded since similar guidance was introduced to biochemistry reporting in October 2015. All other Scottish health boards have confirmed that this approach has not been adopted (other than NHS Western Isles from whom no reply has been received; we note that NHS Western Isles covers <1% of the Scottish population as a whole). Data from 2020 were excluded from analysis since only 6 months’ data were available, and since hospital admission rates were substantially impacted by the Covid-19 pandemic in this period. Data were suppressed to avoid identification of individual patients and no information was available on who provided care for these patients or if the same individual was admitted on more than one occasion. In the comparison of trends in admissions and prescribing, results from the 5 years 2010–2014 were compared with the 5 years after the intervention, 2015–2019. Relative rates of admission and allopurinol prescribing were standardized against levels seen in 2009. Febuxostat was only approved for use in Scotland in 2010 with uptake in NHS Lothian still very low in 2011 and 2012 (<10 prescriptions per year for 120 mg dose) and for the relative rate of prescription of febuxostat, 2013 was chosen as a baseline though we acknowledge these data still need to be treated with caution. The results of all urate tests received by NHS Lothian laboratories were obtained for the period from January 2014 to August 2015.
Analysis
We aimed to establish if there had been an improvement in the rate of admissions with gout in NHS Lothian after the inclusion of guidance advice in urate reports, and to compare relative rates of admission between NHS Lothian and NHS Scotland after the intervention. This analysis was repeated for both primary and secondary gout admissions with a crude Bonferroni correction for these multiple analyses giving a significance threshold of 0.0125. Further analyses are presented exploring changes in prescription rates of urate lowering medication and use of urate results that should be considered hypothesis generating. A two-sided Student’s t-test was used to analyse significance in comparisons of continuous variables, with the chi square test used for tests of proportions.
Ethical approval
This study was a service evaluation of an agreed quality improvement project for which formal ethical review was not required.
Results
Hospital admissions with gout
Scotland-wide admissions with gout increased from 583 in 2009, to a total of 739 in 2019, with the annual percentage increase averaging 2.6%. The characteristics of these 7472 admissions are summarized in Table 1. A majority (71.1%) of the admissions were men. The likelihood of admission increased progressively with age, and we note that over half the admissions (52.9%) were aged 70 years or more. A consistent association with deprivation was also seen with the highest proportion of admissions arising from the most deprived quintile of the population, with admissions more than twice as likely to come from the most deprived compared with the least deprived quintile. Just over half were emergency admissions, with a majority of patients admitted for >2 days, and 24% admitted for over 1 week. Further data showing the yearly admission rates stratified by age and deprivation are included in Supplementary Tables S1 and S2 (available at Rheumatology online). These data suggest that the trend to increasing numbers of admissions of elderly patients is set to continue with the largest absolute increase in admissions seen in the over 80 year age group. Looking at admissions stratified by deprivation, there appears to have been little change in the number of patients admitted from the most deprived quintile, with increased numbers of admissions spread across all remaining quintiles. A total of 3296 admissions were identified across Scotland in which gout was listed as a secondary diagnosis. Our dataset did not allow identification of repeat admissions though a 2010 audit of gout admissions to NHS Lothian found that 81/97 (84%) were one-off admissions, with 16/97 (16%) repeat attendances accrued by seven patients.
Characteristics of 7472 admissions with gout across all NHS Scotland health boards between 2009 and 2019
| Characteristic | Value |
|---|---|
| Gender, n (%) | |
| Male | 5312 (71.1) |
| Female | 2160 (28.9) |
| Admission type, n (%) | |
| Emergency | 3835 (51.3) |
| Routine | 3637 (48.7) |
| Deprivation index (SIMD), n (%) | |
| 1 (most deprived) | 2236 (29.9) |
| 2 | 1749 (23.4) |
| 3 | 1306 (17.5) |
| 4 | 1181 (15.8) |
| 5 (least deprived) | 1000 (13.4) |
| Age range, n (%) | |
| 10–39 | 399 (5.3) |
| 40–49 | 622 (8.3) |
| 50–59 | 1077 (14.4) |
| 60–69 | 1427 (19.1) |
| 70–79 | 1925 (25.8) |
| Over 80 | 2022 (27.1) |
| Length of stay, n (%) | |
| <1 day | 1445 (18.7) |
| 1 day | 1059 (13.6) |
| 2–7 days | 3347 (43.3) |
| >7 days | 1871 (24.4) |
SIMD, Scottish Index Multiple Deprivation derived quintiles.
Comparison of trends between NHS Lothian and remaining NHS Scotland health boards
Trends in hospital admission for gout in NHS Lothian and the remaining health boards in Scotland before and after the introduction of treatment guidance on serum urate results in September 2014 are illustrated in Fig. 1A. The data from the remaining health boards of Scotland are referred to in this figure as ‘Other NHS Scotland’, which excludes data from NHS Lothian and NHS Fife. A rise in hospital admissions for gout is seen across Scotland with the average number of admissions per year in the remaining Scottish health boards increased from 556 per year (2010–2014) to 606 per year (2015–2019) (P < 0.01); however, no significant difference in the number of hospital admissions was seen in NHS Lothian, where the average number of admissions reduced slightly from 111 per year (2010–2014) to 104 per year (2015–2020; P = 0.32). The relative admission rate standardized to a baseline of 2009 diverged after the intervention (mean admission rate 1.06 for NHS Lothian compared with 1.25 for NHS Scotland, P < 0.001) whereas there was no difference pre-intervention (mean admission rate 1.1 NHS Lothian, compared with 1.1 NHS Scotland, P = 0.83).
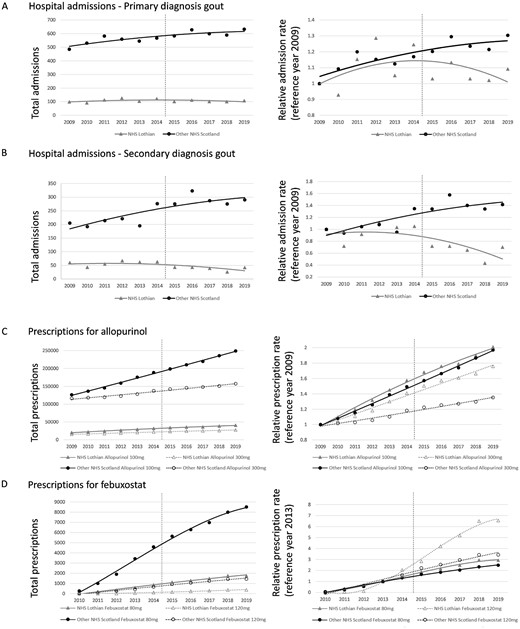
Trends in hospital admission and urate lowering therapy prescriptions
(A, B) Trends for admissions with a primary diagnosis of gout (A) and secondary diagnosis of gout (B), with absolute numbers on the left, and the relative rate standardized to 2009 on the right. (C, D) Number of prescriptions of allopurinol (C) and febuxostat (D), with the absolute numbers on the left, and the relative rate standardized to 2009 for allopurinol or 2013 for febuxostat on the right. Other NHS Scotland refers to all Scottish health boards other than NHS Lothian and NHS Fife, which introduced guidance to urate reports in 2015.
Trends for admissions with a secondary diagnosis of gout are illustrated in Fig. 1B. In the 5 years before or after the intervention, admissions across NHS Scotland boards increased from 220 per year to 290 per year (P < 0.01), but in NHS Lothian there was a significant reduction from 58 per year to 39 per year (P < 0.01). The relative admission rate was reduced in NHS Lothian compared with NHS Scotland post-intervention (0.64 compared with 1.4, P < 0.001) but again showed no difference pre-intervention (1.0 compared with 1.1, P = 0.35).
Trends for prescription of allopurinol are illustrated in Fig. 1C. A linear increase in prescriptions of both 100 mg and 300 mg tablets is seen over the whole time period with significant increases of both doses seen in all areas when comparing the average annual prescriptions for 2010–2014 to 2015–2020. For allopurinol 100 mg tablets prescriptions rose by 36% from 26 733 per year to 36 794 per year in NHS Lothian, and again by 36% across NHS Scotland from 160 961 per year to 222 490 per year (P < 0.01 both comparisons). Prescriptions for 300 mg allopurinol rose by 34% in NHS Lothian from 18 871 per year to 25 273 per year, and by 19% across wider NHS Scotland boards from 125 208 per year to 148 811 per year (P < 0.001 both comparisons). The relative rate of prescription of 100 mg allopurinol standardized to levels of prescribing in 2009 was no different between NHS Lothian and NHS Scotland both before (1.3 compared with 1.27, P = 0.55) and after the intervention (1.8 compared with 1.8, P = 0.49). The relative rate of prescription for 300 mg allopurinol tablets standardized to levels of prescribing in 2009 was not significantly increased in NHS Lothian compared with NHS Scotland over 2010–2014 (1.2 compared with 1.1, P = 0.06) but was significantly increased in NHS Lothian compared with NHS Scotland for the period 2015–2019 (1.6 compared with 1.3, P < 0.001).
Trends for prescription of febuxostat are illustrated in Fig. 1D. Febuxostat was approved for use in Scotland in September 2010 and first used in NHS Lothian in 2011. A progressive increase in prescribing is seen over time in both NHS Lothian and wider NHS Scotland albeit with small numbers of prescriptions in the early years making comparisons of relative prescription rates unreliable. For febuxostat 80 mg tablets prescriptions rose by 370% from 400 per year in 2010–2014 to 1482 per year in 2015–2019 in NHS Lothian, and by 316% across NHS Scotland from 2238 per year to 7081 per year (P < 0.001 both comparisons). Prescriptions of 120 mg febuxostat rose by 779% in NHS Lothian from just 36 per year to 283 per year, and by 422% across wider NHS Scotland boards from 290 per year to 1225 per year (P < 0.001 both comparisons). The relative rate of prescription of 80 mg febuxostat standardized to levels of prescribing in 2013 is no different between NHS Lothian and NHS Scotland in the years 2015–2019 (2.5 compared with 2.1, P = 0.15) but appears to show relatively increased prescribing rates of the higher 120 mg febuxostat dose (5.1 compared with 2.9, P = 0.02).
Use of urate testing
Following the introduction of treatment guidance for elevated urate results, we observed no significant difference in the number of monthly urate requests, which went up modestly from 1032 per month to 1092 per month. The number of tests achieving a urate target of 0.36 mmol/l also went up modestly from 528 per month to 592 per month, and similarly the percentage of all tests performed achieving a urate of 0.36 mmol/l rose from 51% to 53% after the intervention but neither difference achieved even nominal statistical significance of P < 0.05. The proportion of repeat tests increased modestly from 17% to 20%, which would be consistent with adoption of a treat to target approach in a small number of patients (Table 2).
Analysis of urate tests results across NHS Lothian for the period January 2014 until August 2015
| Pre-intervention | Post-intervention | Significance | |
|---|---|---|---|
| Urate requests per month mean (s.d.) | 1032 (97) | 1095 (12) | ns |
| Urate ≤0.36 mmol/l per month mean (s.d.) | 528 (50) | 592 (85) | ns |
| Tests with urate ≤0.36 mmol/l, n/N, % | 4752/9287 (51) | 6352/12 050 (53) | ns |
| Repeated tests performed, n/N, % | 1594/9287 (17) | 2410/12 050 (20) | P < 0.001 |
Significance refers to two-sided Student’s t-test for comparison of monthly urate requests, or chi square test comparing the percentage of repeat tests performed before or after the intervention.
Discussion
Our data confirm that hospital admissions with gout are increasing, with an average annual increase of 2.6% over the last decade seen across Scotland. The impact of this is felt predominantly by the elderly and those suffering the highest levels of deprivation. While increased prescribing of urate lowering therapy was also seen across Scotland this has not itself resulted in reductions in hospital admissions, and may simply reflect the rising incidence of gout. Implementation of clinical guidelines remains challenging, with effective strategies including multifaceted interventions, interactive education and clinical reminder systems [13]. Knowledge gaps in providers of gout care are consistent themes in qualitative reviews of gout management [14]. Our study evaluated a simple intervention that offers healthcare providers appropriate information at an appropriate time; specifically guidance on the goals of urate lowering therapy at the point of reviewing urate test results. This automatically generated comment was associated with stabilization or improvement in rates of admission with gout in NHS Lothian, against a backdrop of rising admissions across remaining Scottish health boards. Although such an intervention was recommended as good practice in the ARMA gout guidelines in 2012, this has still not been widely adopted in Scotland. Outside Lothian we have confirmed that only Fife have also adopted the approach (which followed a presentation of interim results of this audit at a Scottish Society for Rheumatology meeting).
Analysis of local use of urate testing showed modest increases in the number of repeat tests requested suggesting some change in the use of urate testing in line with practice recommended in guidelines, though the overall number of tests did not significantly increase as would be expected if this approach had been widely adopted. A relative increase in prescriptions of allopurinol 300 mg rather than 100 mg tablets, and a similar trend with prescriptions of 120 mg over 80 mg febuxostat could be a result of a pragmatic escalation of therapy without subsequent monitoring; however, we acknowledge that prescribing rates follow a broadly linear increase over the last decade, and that changes in prescribing pattern are difficult to interpret. The step change in admission levels seen following the intervention appears to be a validation of the broad principle of treating to a urate target, even if this data cannot be used to inform the debate on which target level of urate should be aimed for.
We acknowledge that this is an observational study and other factors are likely to have influenced the outcome seen. We note the FAST [15] trial recruited 2384 gout patients across Scotland over this time, but recruitment spanned the intervention running from 2011 to 2017 and occurred across Scotland with major recruitment sites in Tayside and Greater Glasgow as well as Lothian. A dedicated clinic for patients with gout started in 2008 in NHS Lothian, but given limited space in this clinic we estimate that <1% of Lothian patients would be seen in this clinic in any given year, emphasizing that the care of patients with gout remains predominantly in primary care. A number of audits of gout in Lothian primary care practices were carried out between 2008 and 2015, and febuxostat was actively promoted in the years after its introduction in 2010. Collectively these efforts will have increased awareness of best practice in gout management and may have enhanced the response seen. For all these reasons we acknowledge that greater confidence in the effectiveness of this intervention would be achieved by a further evaluation ideally as part of a cluster randomized study.
Conclusion
Inclusion of guidance on therapeutic targets for urate within routine laboratory reports was associated with reductions in the rate of admissions due to gout. Given the rising burden of gout we recommend the wider adoption of such guidance though we acknowledge the limitations of our study design and would welcome further evaluation of this approach.
Acknowledgement
We acknowledge advice from Simon Walker, former member of staff in Clinical Biochemistry, NHS Lothian, and Richard Parker, Senior Statistician, Edinburgh Clinical Trials Unit.Initial results of this study were presented as a poster at the European Crystal Network meeting in 2016.
Funding: No specific funding was received from any bodies in the public, commercial or not-for-profit sectors to carry out the work described in this manuscript.
Disclosure statement: The authors have declared no conflicts of interest.
Data availability statement
The data underlying this article were provided by Public Health Scotland with appropriate suppression of potentially identifiable information. Data will be shared on reasonable request to the corresponding author.
Supplementary data
Supplementary data are available at Rheumatology online.
References
Arthritis and Musculoskeletal Alliance: Standards of Care for People with Gout,

Comments