


Abstract
Eosinophilic granulomatosis with polyangiitis (EGPA) is a necrotizing eosinophil-rich vasculitis. Specific cardiomyopathy (CM) was described in early studies as the most important predictor of mortality. We aimed to revisit EGPA-related CM and investigate its outcome in recent decades.
We reviewed all EGPA patients managed from 2000 to 2019 in our vasculitis clinic. Baseline characteristics and outcomes were analysed. EGPA-related CM was defined as clinical or extra-clinical manifestations of patent myocardial involvement, after exclusion of other causes.
We included 176 patients. The median age was 47 years [interquartile range (IQR) 36–58 years]. Specific CM was observed in 70 patients (40%). Cardiac symptoms were observed in 81% of CM+ patients, including mainly typical or atypical chest pain and peripheral oedema. Abnormal ECG, transthoracic echocardiography and cardiac MRI (CMRI) were found in 72%, 72% and 99% of CM+ patients, respectively, contrasting with abnormalities in 32%, 38% and 60% of CM-negative patients, respectively. Late gadolinium enhancement (LGE) was the most frequent abnormality on CMRI (70%). CM+ patients were less frequently ANCA-positive, had less frequent peripheral neuropathy and had higher eosinophil count. Major adverse cardiovascular events (MACEs) occurred in 13% of patients, both in CM+ and CM– patients. Abnormal ECG and LGE on CMRI were associated with the occurrence of MACEs. Four patients died, but none from cardiac causes.
Specific cardiomyopathy is frequent in EGPA, especially in ANCA-negative patients with high eosinophil counts. Long-term outcome was better than previously reported. Abnormal ECG and LGE on CMRI were associated with the occurrence of MACEs.
Eosinophilic granulomatosis with polyangiitis (EGPA)-related cardiomyopathy was observed in 40% of patients with EGPA, and main symptoms were typical or atypical chest pain and peripheral oedema.
Late gadolinium enhancement (LGE) was the most frequent abnormality on cardiac MRI.
Abnormal electrocardiography and LGE on cardiac MRI were associated with the occurrence of major adverse cardiovascular events.
Introduction
Eosinophilic granulomatosis with polyangiitis (EGPA, formerly Churg–Strauss syndrome) is an eosinophil-rich and necrotizing granulomatous inflammation often involving the respiratory tract, with necrotizing vasculitis predominantly affecting small to medium-sized vessels, associated with asthma and blood and tissue eosinophilia [1]. It is the rarest ANCA-associated vasculitides (AAV), with ANCA being detected in only 30–40% of patients [2, 3]. ANCA-positive (ANCA+) patients are characterized by a predominantly vasculitic pattern with more frequent mononeuritis multiplex and glomerulonephritis, while ANCA-negative (ANCA–) patients are characterized by more frequent cardiomyopathy (CM) [2, 3].
Due to its frequent subclinical presentation as the result of silent eosinophil infiltration, myocardial involvement in EGPA patients may be underestimated and missed by clinicians. Various definitions of cardiac involvement have been used among studies [4–6], and the definition of EGPA-related CM has become more debatable due to multimodal diagnostic tools, especially the implementation of cardiac MRI (CMRI). The reported incidence of myocardial involvement has increased, ranging from 17% when using electrocardiography only to up to 92% in postmortem pathological series [7, 8]. Due to these variations, the spectrum of EGPA-related cardiac manifestations has evolved over time, ranging from pericarditis, myocarditis, endomyocardial fibrosis, dilated CM, intracavitary thrombus or coronary vasculitis to more insidious presentations [6, 9, 10].
Over the past decades, vasculitis-specific CM has been repeatedly recognized as a poor prognostic factor for all vasculitides, as defined by the 1996-Five Factor Score (FFS) [11] and the 2011-revisited FFS [12]. In a large study from the French Vasculitis Study Group, including 383 EGPA patients diagnosed between 1957 and June 2009, CM was identified in multivariate analysis as an independent risk factor for death [5]. In this series, 31% of the deaths were attributed to CM, and the 5-year survival rate was 78.2% for patients with CM (CM+) compared with 91.6% for those without CM (CM–) [5]. However, better and earlier diagnosis of EGPA over time has led to a modification of clinical presentation and prognosis of CM.
Therefore, the aim of this study was to describe EGPA-related CM and its outcome in recent decades in a tertiary monocentric cohort.
Methods
Patients
This retrospective, descriptive and monocentric study included all EGPA patients followed-up in our tertiary referral centre for systemic vasculitis (the French National Reference Centre for Rare Systemic Autoimmune Diseases) from January 2000 to June 2019. Patients were classified as EGPA according to the Chapel Hill Consensus Conference Nomenclature [1] and/or when satisfying the ACR classification criteria [13]. This study was conducted in compliance with the Good Clinical Practice protocol and the Declaration of Helsinki principles and was approved by the local ethics committee Institutional Review Board from Cochin Hospital, Paris. Patient consent for publication was not required.
Clinical and laboratory assessment
Medical charts were retrieved and reviewed for demographic, clinical, biological, radiological and histological findings. Patients’ and disease characteristics were recorded at diagnosis and throughout follow-up. Clinical and extra-clinical data included: gender, cardiovascular risk factors, date of EGPA diagnosis, EGPA-related manifestations, cardiovascular risk factors, cardiac symptoms (chest pain, palpitations, arrhythmia, peripheral oedema, heart murmur, pericardial rub, syncope, cardiogenic shock, cardiac arrest, etc.), ECG, transthoracic echocardiogram (TTE), cardiac MRI (CMRI), coronary angiography and 24-h Holter ECG, ANCA status and serotype, laboratory findings at diagnosis [i.e. eosinophil count, CRP, troponin and N-terminal prohormone of brain natriuretic peptide (NT-proBNP) levels].
Definition of EGPA-related CM
CM was diagnosed based on clinical and laboratory findings in combination with ECG, TTE and CMRI. Patients were considered to have EGPA-related CM when clinical (i.e. typical chest pain, manifestations of cardiac failure, cardiac shock) or extra-clinical signs (i.e. increased troponin levels, left ventricular dysfunction and hypokinetic or akinetic areas on TTE or CMRI) of patent CM were present and no other causes of CM could be found (i.e. known pre-existing valvular heart disease, atherosclerosis, hypertensive heart disease, heart rhythm disorder), despite extensive extra-clinical workup. In the absence of clinical manifestations of cardiac failure, patients had to have at least one of the following abnormalities: significant impairment of cardiac contractility (defined as left ventricular ejection fraction <50%), endomyocardial fibrosis, dilated CM and/or intracavitary thrombus on TTE and/or CMRI. Coronary angiography was performed when necessary to rule out coronary artery disease in patients aged 50 years and older and/or in those with cardiovascular risk factors. Diagnosis of myocarditis was based on criteria from the European Society of Cardiology Working Group on Myocardial and Pericardial Diseases [14]. Briefly, myocarditis is clinically suspected myocarditis if there ≥1 clinical presentation and ≥1 diagnostic criteria, in the absence of: (1) overt coronary artery disease; (2) known pre-existing cardiovascular disease or extra-cardiac causes that could explain the syndrome (e.g. valve disease, congenital heart disease, hyperthyroidism, etc.). Diagnostic criteria include ECG/Holter/stress tests features, myocardiocytolysis markers, functional and structural abnormalities on cardiac imaging, and oedema and/or late gadolinium enhancement (LGE) on CMRI. Finally, isolated pericarditis without involvement of the myocardium was not considered as an EGPA-related CM.
Response to therapy and outcome
Long-term outcomes were collected for all EGPA patients enrolled, and included vasculitis relapses, major adverse cardiovascular events (MACEs), damage, and causes of deaths. Vasculitis activity was assessed using the BVAS version 3 [15, 16]. Vasculitis severity was assessed using the 1996 Five Factor Score (FFS) [11]. Patients with a FFS ≥1 were usually treated with a combination of glucocorticoids (GCs) plus CYC, while those with a FFS of 0 received GCs alone as first-line therapy. The following definitions were applied based on disease activity [17]. Remission was defined as the absence of signs of new or worsening disease activity (BVAS = 0) with a stable low dose of prednisone. Vasculitis relapse was defined as the recurrence or new onset of disease activity attributable to active vasculitis (BVAS > 0). Major vasculitis relapse was the recurrence or new onset of potentially organ- or life-threatening disease activity, and minor relapse was the recurrence or new onset of manifestations that are not potentially organ- or life-threatening. Extra-cardiac vasculitis relapse was defined as disease relapse with manifestations attributable to active vasculitis but not isolated to the heart. Increased eosinophil count without any other clinical EGPA manifestation and isolated asthma or sinusitis exacerbations necessitating therapeutic adjustments were not considered as vasculitis relapses. Damage was assessed with the Vasculitis Damage Index [18]. MACEs were defined as an acute or chronic heart failure, rhythm or conduction disorders (especially atrial fibrillation or ventricular tachycardia), ischaemic cardiopathy, need of cardiac surgery or revascularization, or death from cardiac cause.
Statistical analysis
Data are presented as mean (s.d.) or as median (range), as appropriate, for continuous variables, and as number (%) for qualitative variables. Univariate analysis, including the Chi2 or Fisher’s exact test as appropriate to compare categorical variables and the non-parametric Mann–Whitney test to compare continuous variables, was performed to identify variables associated with the diagnosis of EGPA-related CM and the occurrence of MACEs. Based on the diagnostic performance of biological and imaging tests, we assessed a score including items associated with EGPA-specific CM. Receiver operating characteristic (ROC) curves were created to assess this diagnostic score. Survival curves and their 95% CIs were estimated using the Kaplan–Meier method. The association of the variables with the occurrence of MACEs was assessed using a univariate Log-rank test. All tests were 2-sided at the 0.05 significance level. Analyses were performed using Prism (GraphPad Software Inc.).
Results
Patient characteristics
Overall, 176 patients [93 men; median age 47 years (IQR 36–58)] were included. Table 1 shows the characteristics of patients included in the study. EGPA diagnosis was characterized by asthma in 175 patients (99%), eosinophilia in 167 patients (95%), at a median level of 5239/mm3 (IQR 2500–9540), sinonasal abnormalities in 147 patients (84%), pulmonary infiltrates in 92 patients (52%), peripheral neuropathy in 102 patients (58%) and eosinophil-rich infiltrates in 32 patients (18%). The median baseline BVAS was 17 (IQR 11–22). Sixty-one patients (39%) were ANCA+, targeting MPO in 47/155 (30%).
Baseline characteristics of the 176 EGPA patients included in the study
| Characteristics | All patients (n = 176) | EGPA-related CM (n = 70) | No cardiomyopathy (n = 106) | P |
|---|---|---|---|---|
| Demography | ||||
| Age, mean (s.d.), years | 47.3 (15.5) | 47.3 (15.4) | 47.3 (15.7) | 0.71 |
| Male gender, n (%) | 93 (53) | 39 (56) | 54 (51) | 0.54 |
| EGPA features | ||||
| Interval between asthma and EGPA diagnosis, median (IQR), years | 6 (2–18) | 5 (2–14.8) | 9.5 (2.3–20) | 0.10 |
| Asthma | 175 (99) | 70 (100) | 105 (99) | >0.99 |
| Eosinophilia | 167 (95) | 69 (99) | 98 (93) | 0.09 |
| Sinonasal involvement | 147 (84) | 58 (83) | 89 (84) | 0.84 |
| Pulmonary infiltrates | 92 (52) | 41 (59) | 51 (48) | 0.22 |
| Peripheral neuropathy | 102 (58) | 33 (47) | 69 (65) | 0.02 |
| Histological evidence | 32 (18) | 10 (14) | 22 (21) | 0.32 |
| Vasculitis features | ||||
| Fever | 51 (41) | 21 (40) | 30 (41) | 0.87 |
| Weight loss | 75 (60) | 31 (60) | 44 (60) | 0.76 |
| Arthralgia | 47 (38) | 16 (31) | 31 (43) | 0.39 |
| Skin involvement | 79 (45) | 30 (43) | 49 (46) | 0.76 |
| Purpura | 35 (44) | 10 (33) | 25 (51) | 0.18 |
| Gastrointestinal involvement | 9 (5) | 4 (6) | 5 (5) | 0.74 |
| Renal involvement | 9 (5) | 3 (4) | 6 (6) | >0.99 |
| CNS involvement | 13 (7) | 8 (11) | 5 (5) | 0.14 |
| Laboratory tests | ||||
| Eosinophils, median,/mm3 | 5239 (2500–9540) | 7130 (3800–13 380) | 4298 (2068–7865) | 0.002 |
| Positive ANCA | 61/155 (39) | 16/63 (25) | 45/92 (49) | 0.004 |
| Positive MPO-ANCA | 47/155 (30) | 12/63 (19) | 35/92 (38) | 0.01 |
EGPA: eosinophilic granulomatosis with polyangiitis; IQR: interquartile range. Bold values are the significant values with P-value <0.05.
Cardiac manifestations in patients with EGPA-specific CM
EGPA-specific CM was observed in 70/176 patients (40%), 58/70 (83%) diagnosed at initial presentation of the disease and 12/70 (17%) during follow-up, after a median interval of 61 months (IQR 17–161). Coronary angiography was performed in 34 patients. Of the specific CM diagnosed during follow-up, 7 were made during a relapse and the remaining 5 during systematic evaluation. Seventeen out of 176 patients (10%) had preexisting arterial hypertension, including 5 patients with EGPA-specific CM (7%) and 12 without (11%) (P = 0.44).
Clinical cardiac symptoms at presentation in CM+ patients were observed in 57/70 patients (81%) and included typical chest pain of myocardial infarction in 7/57 (12%), atypical chest pain in 13/57 (23%), peripheral oedema in 10/57 (18%), palpitations in 6/57 (11%) and hypotension or cardiac shock in 4/57 (7%). Paraclinical findings from ECG, TTE and CMRI in CM+ and CM– patients are summarized in Table 2. CM+ patients had an abnormal ECG, TTE and CMRI in 49/68 (72%), 49/68 (72%) and 66/67 (99%) patients, respectively. On CMRI, late gadolinium enhancement (LGE) was present in 70%, and patterns of LGE were intramyocardial in 53%, subendocardial in 42%, subepicardial in 19% and transmural in 22% (Figs 1 and 2). LGE lesions were found in the septum in 64%, inferior left ventricle (LV) wall in 62%, lateral LV portion in 59%, anterior LV portion in 43%, LV apex in 33% and posterior LV portion in 7%. No endomyocardial biopsy was performed. Overall, patients with EGPA-related CM had myocarditis in 54 patients (77%), pericarditis in 30 patients (43%) endomyocardial fibrosis in 8 patients (11%), dilated CM in 6 patients (9%), intracavitary thrombosis in 6 patients (9%) and/or coronary vasculitis on angiography in 1 patient (1%) (Supplementary Fig. S1, available at Rheumatology online).
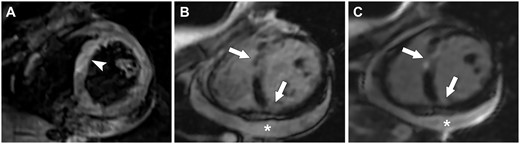
Eosinophilic granulomatosis with polyangiitis (EGPA)-related cardiomyopathy
Cardiac MRI shows myocardial oedema on the T2-weighted sequence (arrowhead in A), as well as several foci of early (arrows in B) and late (arrows in C) gadolinium enhancement, and pericardial effusion (star in B and C).
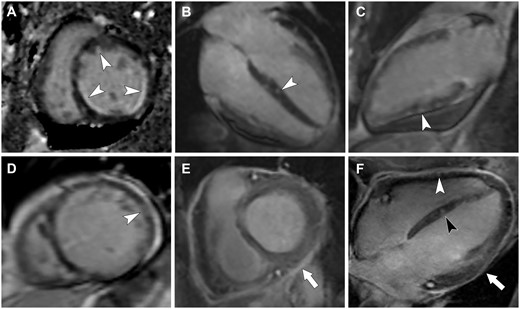
Different patterns of late gadolinium enhancement (LGE) in patients with eosinophilic granulomatosis with polyangiitis (EGPA)
LGE can have a subendocardial (arrowheads in A), an intramyocardial (arrowhead in B), a subepicardial (arrowhead in C) or a transmural (arrowhead in D) pattern. LGE of the pericardium can also be seen (arrow in E) in pericarditis. Panel F shows the association of intramyocardial (black arrowhead), subepicardial (white arrowhead) and pericardial LGE in an EGPA patient with myopericarditis.
Diagnostic accuracy of clinical, laboratory and imaging findings for the identification of EGPA-related cardiomyopathy
| Findings | EGPA-CM (n = 70) | No CM (n = 106) | Sensitivity (95% CI), % | Specificity (95% CI), % | PPV (95% CI), % | NPV (95% CI), % | Diagnostic OR (95% CI) | P |
|---|---|---|---|---|---|---|---|---|
| Extra-cardiac features | ||||||||
| Peripheral neuropathy | 33/70 (47) | 69/106 (65) | 47.2 (35.9, 58.7) | 34.9 (26.5, 44.4) | 32.3 (24.1, 41.9) | 50.0 (38.9, 61.1) | 0.48 (0.26, 0.90) | 0.02 |
| Eosinophils >3000/mm3 | 49/63 (78) | 57/88 (65) | 77.8 (66.1, 86.3) | 35.2 (26.1, 45.6) | 46.2 (37.0, 55.7) | 68.9 (54.3, 80.5) | 1.90 (0.91, 3.85) | 0.10 |
| Eosinophils >5000/mm3 | 42/63 (67) | 37/88 (42) | 66.7 (54.4, 77.1) | 58.0 (47.5, 67.7) | 53.2 (42.2, 63.8) | 70.8 (59.5, 80.1) | 2.76 (1.39, 5.46) | 0.003 |
| Positive ANCA | 16/63 (25) | 45/92 (49) | 25.4 (16.3, 37.3) | 51.1 (41.0, 61.1) | 26.2 (16.8, 38.4) | 50.0 (40.0, 59.9) | 0.36 (0.18, 0.73) | 0.004 |
| Positive MPO-ANCA | 12/63 (19) | 35/92 (38) | 19.1 (11.3, 30.4) | 62.0 (51.8, 71.2) | 25.5 (15.3, 39.5) | 52.8 (43.4, 61.9) | 0.38 (0.18, 0.81) | 0.01 |
| ECG | 68 | 96 | ||||||
| Abnormal ECG | 49 (72) | 31 (32) | 72.1 (60.4, 81.3) | 67.7 (57.8, 76.2) | 61.3 (50.3, 71.2) | 77.4 (67.4, 85.0) | 5.41 (2.73, 10.24) | <0.0001 |
| Repolarization abnormalities | 25 (37) | 12 (13) | 36.8 (26.3, 48.6) | 87.5 (79.4, 92.7) | 67.6 (51.5, 80.4) | 66.1 (57.6, 73.8) | 4.07 (1.93, 9.05) | 0.0005 |
| Rhythm abnormalities | 19 (28) | 10 (10) | 27.9 (18.7, 39.6) | 89.6 (81.9, 94.2) | 65.5 (47.4, 80.1) | 63.7 (55.3, 71.3) | 3.34 (1.40, 7.69) | 0.006 |
| Conduction abnormalities | 13 (19) | 12 (13) | 19.1 (11.5, 30.0) | 87.5 (79.4, 92.7) | 52.0 (33.5, 70.0) | 60.4 (52.1, 68.2) | 1.66 (0.68, 3.72) | 0.28 |
| Q wave abnormalities | 5 (7) | 4 (4) | 7.4 (3.2, 16.1) | 95.8 (90.0, 98.4) | 55.6 (26.7, 81.1) | 59.4 (51.5, 66.8) | 1.83 (0.52, 6.12) | 0.49 |
| Laboratory findings | ||||||||
| Increased troponin | 44/51 (86) | 6/52 (12) | 86.3 (74.3, 93.2) | 88.5 (77.0, 94.6) | 88.0 (76.2, 94.4) | 86.8 (75.2, 93.5) | 48.2 (14.87, 133) | <0.0001 |
| Increased NT-pro-BNP | 38/43 (88) | 10/46 (22) | 88.4 (75.5, 94.9) | 78.3 (64.4, 87.7) | 79.2 (65.7, 94.7) | 87.8 (74.5, 94.7) | 27.4 (8.46, 77.0) | <0.0001 |
| Transthoracic echography | 68 | 89 | ||||||
| Abnormal TTE | 49 (72) | 34 (38) | 72.1 (60.4, 81.3) | 61.8 (51.4, 71.2) | 59.0 (48.3, 69.0) | 74.3 (63.4, 82.9) | 4.17 (2.10, 7.98) | <0.0001 |
| Pericardial effusion | 28 (41) | 12 (13) | 41.2 (30.3, 53.0) | 86.5 (77.9, 92.1) | 70.0 (54.6, 81.9) | 65.8 (56.8, 73.8) | 4.49 (2.02, 9.94) | <0.0001 |
| Left ventricular dysfunction | 21 (31) | 2 (2) | 30.9 (21.2, 42.6) | 97.8 (92.2, 99.6) | 91.3 (73.2, 98.5) | 64.9 (56.5, 72.5) | 19.44 (4.65, 85.5) | <0.0001 |
| Hypokinetic areas | 22 (32) | 2 (2) | 32.4 (22.4, 44.2) | 97.8 (92.2, 99.6) | 91.7 (74.2, 98.5) | 65.4 (57.0, 73.0) | 20.80 (5.01, 91.3) | <0.0001 |
| Cardiac MRI | 67 | 60 | ||||||
| Abnormal CMRI | 66 (99) | 36 (60) | 98.5 (92.0, 99.9) | 40.0 (28.6, 52.6) | 64.7 (55.1, 73.3) | 96.0 (80.5, 99.8) | 44.0 (7.24, 461) | <0.0001 |
| Pericardial effusion | 27 (40) | 25 (42) | 40.3 (29.4, 52.3) | 58.3 (45.7, 69.9) | 51.9 (38.7, 64.9) | 46.7 (35.8, 57.8) | 0.95 (0.46, 1.95) | >0.99 |
| Pericardial GE | 18 (27) | 13 (22) | 26.9 (17.7, 38.5) | 78.3 (66.4, 86.9) | 58.1 (40.8, 73.6) | 49.0 (39.2, 58.8) | 1.33 (0.61, 3.07) | 0.54 |
| Left ventricular dysfunction | 32 (48) | 6 (10) | 47.8 (36.3, 59.5) | 90.0 (79.9, 95.3) | 84.2 (69.6, 92.6) | 60.7 (50.3, 70.2) | 8.23 (3.26, 20.97) | <0.0001 |
| Dilated left ventricle | 7 (10) | 3 (5) | 10.5 (5.2, 20.0) | 95.0 (86.3, 98.6) | 70.0 (39.7, 89.2) | 48.7 (39.9, 57.7) | 2.22 (0.57, 8.14) | 0.33 |
| Myocardial oedema | 15 (22) | 4 (7) | 22.4 (14.1, 33.7) | 93.3 (84.1, 97.4) | 79.0 (56.7, 91.5) | 51.9 (42.5, 61.1) | 4.04 (1.28, 11.66) | 0.02 |
| EGE | 24 (36) | 8 (13) | 35.8 (25.4, 47.8) | 86.7 (75.8, 93.1) | 75.0 (57.9, 86.9) | 54.7 (44.7, 64.4) | 3.63 (1.43, 8.60) | 0.004 |
| LGE | 47 (70) | 13 (22) | 70.2 (58.3, 79.8) | 78.3 (66.4, 86.9) | 78.3 (66.4, 86.9) | 70.2 (58.3, 79.8) | 8.50 (3.88, 18.41) | <0.0001 |
CM: cardiomyopathy; CMRI: cardiac MRI; EGE: early gadolinium enhancement; EGPA: eosinophilic granulomatosis with polyangiitis; LGE: late gadolinium enhancement; NPV: negative predictive value; NT-pro-BNP: N-terminal (NT)-pro hormone brain natriuretic peptide; OR: odds ratio; Pericardial GE: pericardial gadolinium enhancement; PPV: positive predictive value; TTE: transthoracic echocardiogram.
Compared with CM+ patients, CM– patients had abnormal ECG, TTE and CMRI in 32%, 38% and 60%, respectively. However, on CMRI, myocardial oedema, early gadolinium enhancement (EGE) and LGE were significantly less frequently observed, i.e. in 7%, 13% and 22%, respectively.
Phenotype of patients according to specific CM
The main extra-cardiac differences between patients with specific CM and those without are indicated in Table 1. Compared with those without specific CM, those with CM were less frequently ANCA+ (25% vs 49%, P = 0.004), had less frequent peripheral neuropathy (47% vs 65%, P = 0.02) and had a higher eosinophil count [median 7130 (3800–13 380) vs 4298 [2068–7865]/mm3, P = 0.002]. No other between-group differences were noted.
Performance of biological and imaging tests for the diagnosis of EGPA-specific CM
The diagnostic accuracy of clinical, laboratory and imaging findings are summarized in Table 2. Despite significant differences between patients with and without specific CM, ECG had a poor overall performance for the diagnosis of specific CM, with a sensitivity of 72.1%, specificity of 67.7%, positive predictive value of 61.3% and negative predictive value of 77.4%. In contrast, serum troponin had a good overall performance for the diagnosis of specific CM, with a sensitivity of 86.3%, specificity of 88.5%, positive predictive value of 88% and negative predictive value of 86.8%. NT-pro-BNP measurement was slightly less efficient compared with serum troponin, mainly because of a lower specificity compared with troponin (78.3%). Finally, CMRI had a good sensitivity (98.5%) and negative predictive value (96%) for the diagnosis of specific CM, but lacked specificity (40%) and positive predictive value (64.7%). Among CMRI abnormalities, LGE had the best overall performance, with a sensitivity of 70.2%, specificity of 78.3%, positive predictive value of 78.3% and negative predictive value of 70.2%. However, myocardial oedema and EGE were more specific (93.3 and 86.7%, respectively), but poorly sensitive (22.4 and 35.8%, respectively).
Based on the diagnostic performance of biological and imaging tests, we assessed a score (ranging from 0 to 6) including four items that were associated with EGPA-specific CM: rhythm and/or repolarization abnormalities on ECG (+1 point), increased serum troponin (+2 points), hypokinetic areas and/or left ventricular dysfunction on TTE (+2 points) and myocardial oedema and/or EGE and/or LGE on CMRI (+1 point), with a score ranging from 0 to 6. Among the 77 in which all the items were available at diagnosis, a score ≥3 had a sensitivity of 85.7% (95% CI: 73.3, 92.9%), a specificity of 96.4% (95% CI: 82.3, 99.8%) and an area under the curve of 0.9708 (95% CI: 0.9403, 1.000, P < 0.0001) for the identification of patients with EGPA-specific CM (Fig. 3A and B).
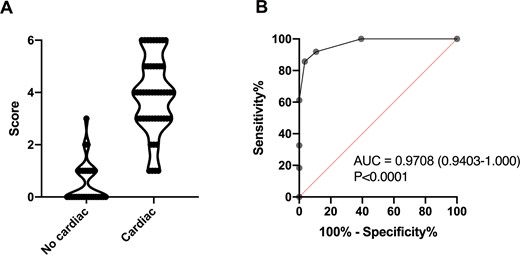
Diagnostic score and corresponding ROC curve analysis for EGPA-related specific cardiomyopathy
(A) Diagnostic score for eosinophilic granulomatosis with polyangiitis (EGPA)-related specific cardiomyopathy between patients without and with cardiac involvement. (B) Receiver operating characteristic (ROC) curve analysis of diagnostic score for the identification of patients with specific cardiomyopathy.
Outcomes
Patients with EGPA-related CM were treated with GCs in all cases, including pulses of methylprednisolone in 36 patients (51%), in combination with CYC in 56 patients (80%). Patients without CM were treated with GCs in all cases, including pulses of methylprednisolone in 40 patients (38%), in combination with CYC in 25 (24%).
After a mean follow-up of 122.3 ± 99.7 months, 71 patients (40%) experienced vasculitis relapses, with no between-group differences (37% in patients with EGPA-related CM vs 42% in those without, P = 0.53). Vasculitis relapses involved the heart in 12 patients (17%), but 50% of relapses from patients with baseline EGPA-related CM were located to the heart.
MACEs occurred in 22 patients (13%), both in patients with EGPA-related CM (n = 13) and those without (n = 9). MACE included rhythm disorders in 11, myocardial ischaemic events in 9, acute decompensated heart failure in 5, coronary artery revascularization in 6, cardiac surgery in 3, and conduction disorder in 1 patient. Because MACEs occurred in patients with specific CM and those without as well, we analysed the association of baseline clinical and paraclinical characteristics with the occurrence of MACEs. In univariate analysis, the following variables were significantly associated with the occurrence of MACEs during follow-up: age > 65 years [hazard ratio (HR) 103.1, 95% CI: 12.64, 842, P < 0.0001], specific CM (HR 2.62, 95% CI: 1.03, 6.67, P = 0.043), abnormal ECG (HR 7.03, 95% CI: 2.88, 17.1, P < 0.0001) and LGE on cardiac MRI (HR 3.52, 95% CI: 1.33, 9.32, P = 0.01) (Table 3 and Supplementary Fig. S2, available at Rheumatology online). Finally, 4 patients died, but none from cardiac causes (2 from severe asthma exacerbations and 2 from unknown causes).
Univariate analysis of variables associated with the occurrence of major cardiovascular events
| Characteristics | HR (95% CI) | P |
|---|---|---|
| Demography | ||
| Age >65 years | 103.1 (12.64, 842) | <0.0001 |
| Male gender | 1.67 (0.69, 4.03) | 0.26 |
| Cardiovascular risk factors | 1.94 (0.80, 4.69) | 0.14 |
| EGPA features | ||
| Eosinophils >3000/mm3 | 0.82 (0.31, 2.18) | 0.69 |
| Eosinophils >5000/mm3 | 0.76 (0.30, 1.95) | 0.57 |
| MPO-ANCA | 1.21 (0.41, 3.62) | 0.73 |
| Specific cardiomyopathy | 2.62 (1.03, 6.67) | 0.043 |
| ECG | ||
| Abnormal ECG | 7.03 (2.88, 17.1) | <0.0001 |
| Transthoracic echography | ||
| Abnormal TTE | 1.47 (0.60, 3.63) | 0.40 |
| Pericardial effusion | 0.44 (0.12, 1.59) | 0.21 |
| Left ventricular dysfunction | 3.58 (0.75, 16.98) | 0.11 |
| Hypokinetic areas | 3.37 (0.72, 15.74) | 0.12 |
| Cardiac MRI | ||
| Abnormal CMRI | 1.23 (0.38, 3.95) | 0.73 |
| Pericardial effusion | 0.59 (0.22, 1.62) | 0.30 |
| Left ventricular dysfunction | 1.36 (0.47, 3.89) | 0.56 |
| Myocardial oedema | 1.75 (0.40, 7.71) | 0.45 |
| Early gadolinium enhancement | 1.81 (0.60, 5.50) | 0.29 |
| Late gadolinium enhancement | 3.52 (1.33, 9.32) | 0.01 |
| First-line treatments | ||
| Pulses of methylprednisolone | 0.51 (0.21, 1.25) | 0.14 |
| Immunosuppressive agents | 1.13 (0.47, 2.75) | 0.78 |
CMRI: cardiac MRI; EGPA: eosinophilic granulomatosis with polyangiitis; IQR: interquartile range; HR: hazard ratio; TTE: transthoracic echocardiogram. Bold values are the significant values with P-value <0.05.
Discussion
The present report provides data on baseline characteristics and outcomes of specific CM in a large cohort of EGPA patients. We confirm some findings previously described but also provide new insights into the diagnosis of EGPA-related CM and its prognosis, especially in recent decades.
Patients’ characteristics from our series were similar to those previously reported in other large cohorts [2, 3, 5, 8]. Comparison of characteristics of cardiac involvement between studies is in contrast more difficult, since no consensus definition of EGPA-related CM was defined. Current scores assessing disease activity do not provide a clear definition of vasculitis-specific cardiac involvement, while CM was defined in the FFS [11, 16]. In the 1996 FFS, specific CM was based only on the presence of clinical symptoms, and in the absence of clinical symptoms, TTE or other complementary investigations were not considered for diagnosis of cardiac failure [11]. Also, EGPA may include different clinical, radiological and histological scenarios, such as pericarditis, myocarditis, or presence of myocardial granulomas that could neither affect myocardial contractility nor result in heart failure.
Recently, CMRI has emerged to assess the myocardium in the context of inflammatory diseases, but its diagnostic role in EGPA is still debated. Also, many studies focused on ECG, TTE and/or CMRI findings in EGPA, without analysing in detail the clinical presentation and the reliability of the diagnosis of patent EGPA-related CM [10, 19–21]. Definitions are not sensitive and/or specific enough to diagnose EGPA-related CM, explaining variations in the incidence of CM in the literature, ranging from 11% to 49% [2, 3, 5, 8].
We decided to define EGPA-related CM based on clinical and/or imaging criteria associated with cardiac failure, but not on asymptomatic lesions. Despite this restrictive definition avoiding asymptomatic cardiac abnormalities, EGPA‐specific CM was found in 40% of patients. Taken alone, cardiac manifestations suggestive of EGPA-specific CM were not very specific, but their concomitant occurrence at diagnosis of EGPA or during a flare was in contrast highly suggestive of EGPA-specific CM. Based on this definition, we analysed the prognostic interest of abnormalities on ECG, serum troponin level, TTE and CMRI in EGPA, which remains unclear in the literature [6, 10, 22]. According to their respective diagnostic performances, we aimed to define for the first time an easy and usable diagnostic score in daily practice (ranging from 0 to 6) that includes the four most relevant items, i.e. the results of ECG, serum troponin level, TTE and CMRI. Using this tool, CMRI is not mandatory for considering or ruling out patent CM in patients with or without clinical symptoms. Obviously, identified relevant items were directly related to our definition of EGPA-related CM, but our goal was to highlight the most relevant items.
For decades, CM was described as a major contributor to disease-related death in EGPA [21]. In a large French cohort of patients diagnosed between 1957 and 2009, the only independent predictors of death were specific CM at diagnosis, older age and EGPA diagnosed prior to 1996 (i.e. before the use of the FFS) [5]. Nowadays, with the use of treatment stratification according to severity using the 1996 FFS, EGPA patients’ survival rate is very good, and the long-term outcome is now dominated by sequelae, usually chronic asthma and peripheral neuropathy, and relapses [23]. Forty percent experienced vasculitis relapses, with no between-group differences. However, half of the relapses from CM+ patients were located in the heart, showing the importance of screening for new cardiac manifestations in these patients during a flare. Analysing the prognostic impact of specific CM in patients diagnosed in the 2000s was a major goal of this study. Fortunately, only 4 deaths were recorded during follow-up and none from cardiac causes, suggesting a significant improvement in therapeutic management of patients with EGPA-related CM, and no heart transplantations were performed. Also, MACEs were rare, occurring in 10–15% of patients during follow-up, both in CM+ and CM– patients. Such cardiovascular complications were not restricted to CM+ patients, since age >65 years, abnormal ECG at baseline and LGE on CMRI were also predictors of MACEs. These findings suggest that an abnormal ECG at baseline could identify patients at risk of MACEs, and support that LGE probably has more a prognostic than a diagnostic role in patients with EGPA. LGE patterns were variable, but lesions were mainly found in the septum, and in the inferior and lateral LV portion. Importantly, in patients with suspected myocarditis, LGE presence was shown to be associated with a more than doubling risk of MACEs. Regarding location and pattern, septal LGE showed the strongest association with MACEs in the literature, as well as a patchy distribution [24]. In contrast, normal CMRI corresponded to a low annual rate of MACEs. Also, in patients with non-ischaemic CM, the presence of LGE strongly predicted the occurrence of MACEs [25].
The main limitation of the present study is that all data were derived from a retrospective, descriptive and monocentric study spanning over two decades, in which diagnostic management, but not therapeutic management, has evolved. All patients were followed-up in our vasculitis clinic, which decreases heterogeneity in patients’ management. In addition, the main outcomes were robust events, i.e. vasculitis relapses and MACEs. However, cardiac imaging tests were more frequently performed in patients with clinically suspected EGPA-related CM than in those without, and coronary angiography was not performed in all patients. Also, we were not able to obtain data on the evolution of new subclinical cardiac abnormalities using more accurate evaluations, such as repeated 24-h Holter monitoring or cardiac MRI.
Overall, specific CM is frequent in EGPA, especially in ANCA– patients with high eosinophil counts and no peripheral neuropathy. The long-term outcome was found to be better than previously reported. Further international studies are needed to homogenize diagnosis and therapeutic management of EGPA-related CM, and better identify patients with a poor prognosis. However, so far, abnormal ECG and LGE on cardiac MRI are associated with an increased risk of MACEs.
Acknowledgements
The members of the French Vasculitis Study Group who contributed to this paper are included in the authorship list.
S.S. and B.T. devised the project, the main conceptual ideas and the proof outline; pooled and analysed the data; and wrote the manuscript. All authors contributed to the follow-up of patients, discussed the results and contributed to the final manuscript.
Funding: No specific funding was received from any bodies in the public, commercial or not-for-profit sectors to carry out the work described in this article.
Disclosure statement: B.T. reports personal fees and research grants from Roche, AstraZeneca and GlaxoSmithKline, outside the submitted work. The remaining authors have declared no conflicts of interest.
Data availability statement
All data relevant to the study are included in the article or uploaded as supplementary information.
Supplementary data
Supplementary data are available at Rheumatology online.

Comments